You need to understand what is happening to do well with influencer marketing. An influencer marketing dashboard lets you see, study, and make your campaigns better. The table below explains why this tool is important:
| Feature | What It Means for You |
|---|---|
| Definition | Lets you watch and make influencer campaigns better |
| Real-Time Tracking | Shows how each influencer is doing |
| Decision-Making | Puts all data together for better choices |
| Efficiency | Saves time and helps your team work better |
Set your goals before you begin. Tools like FineReport from FanRuan help you build your dashboard fast and easily.
Set Influencer Marketing Dashboard Objectives
Define Campaign Goals
You need to have clear goals before you build your influencer marketing dashboard. These goals help guide your influencer marketing work. Setting specific goals makes it easier to check if you are doing well. You can see how much progress you make. Brands with clear goals are much more likely to get good results from influencer partnerships.
Your campaign goals should follow these five steps:
- Specific: Make your goals easy to understand for everyone.
- Measurable: Pick metrics you can track to show progress and prove ROI.
- Achievable: Set targets you can reach so your team stays motivated.
- Relevant: Choose goals that fit your business needs.
- Time-bound: Set deadlines to keep your campaign on track.
When you know what you want to achieve, you can pick the influencer marketing metrics that matter most. This helps you build a dashboard that shows the right data and supports better decisions.
Align Dashboard with Marketing Strategy
Your dashboard should match your influencer marketing strategy. You want your dashboard to help your team work together and reach your business goals.
You can make your dashboard more helpful by following these steps:
- Match your influencer marketing work with your company’s main goals.
- Use shared data so teams can work together.
- Focus on the most important metrics to measure success.
- Give each stakeholder the information they need.
When your dashboard fits your influencer marketing strategy, it becomes a tool that helps your team make smart choices and succeed with campaigns.
Key Metrics for Influencer Marketing Dashboard
When you make an influencer marketing dashboard, you must pick key metrics. These metrics show how well your campaigns do. They help you see what works and what needs fixing. FineReport lets you track these metrics. It turns them into easy visuals for quick study.
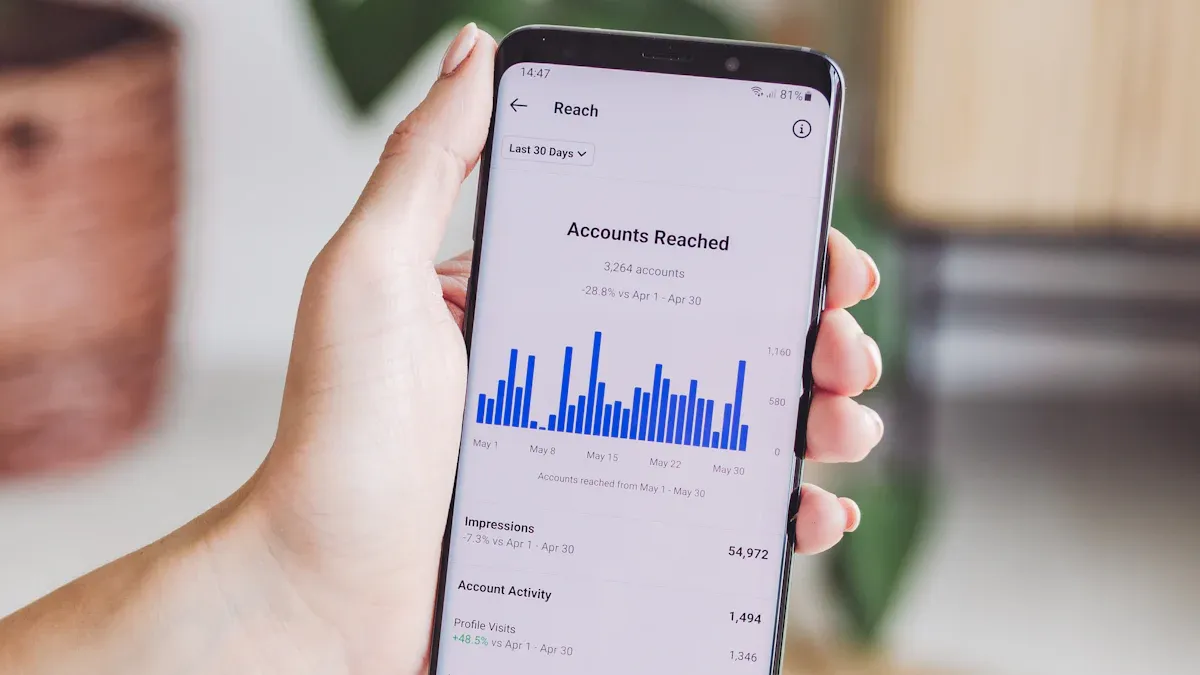
Engagement and Reach Metrics
Engagement metrics show how much people interact with influencer content. You should check likes, comments, shares, and engagement rate. Many marketers think engagement rate is the best way to measure success. It shows if your audience cares about your message. Audience relevance is important too. If your influencer reaches the right people, you get better results.
Reach metrics show how many people see your content. You can track impressions, reach, and video views. These numbers help you understand campaign performance and spot trends. FineReport can show these numbers in charts and graphs. This helps you compare influencers and see who does best.
ROI and Conversion Tracking
You want to know if influencer marketing brings value. Return on investment is a key metric. You can measure ROI by looking at sales, sign-ups, or other actions after someone sees your campaign. Track metrics like click-through rate, conversion rate, and cost per outcome. Use tracking links, discount codes, or affiliate links to see where your results come from.
FineReport helps you automate analytics and show ROI with graphs. You can set up your dashboard to show return on investment for each influencer. This makes it easy to see which campaigns give you the best results.
- Track referral traffic with UTM links.
- Watch purchases and sign-ups.
- Compare campaign performance across different influencers.
Content Performance Indicators
A content performance dashboard shows how each piece of influencer content works. You should track metrics like pacing vs expected, engagement quality trend, and comment sentiment. These indicators help you spot risks and see if your content matches your goals.
| Metric | Description |
|---|---|
| Pacing vs expected | Compares actual performance against expected outcomes by creator and format. |
| Cost per outcome | Focuses on a key performance indicator that matches campaign goals. |
| Engagement quality trend | Looks at the quality of engagement over time, not just the engagement rate. |
| New-to-brand reach | Measures the reach of new audiences or audience overlap among creators. |
| Comment sentiment plus risk flags | Checks audience sentiment and finds possible risks within 24 to 48 hours. |
FineReport lets you build dashboards that show all these analytics in one place. You can track metrics over time, compare influencers, and spot patterns. This helps you make smart choices and improve your influencer marketing strategy.
Tools and Data Integration for Influencer Marketing Dashboard Creation
Using FineReport Solutions
You need good tools to make a strong dashboard. FineReport are great for influencer marketing. These tools help you gather, sort, and show data with easy visuals. You can check how your influencer campaigns do right away.
FineReport lets you make dashboards by dragging and dropping. You do not have to be a tech expert. You can build dashboards and charts that help your team decide fast. You can look for pipeline data, make reports, and share dashboards on any device. Teams can use out-of-the-box data cubes and show results to everyone.
Connecting Data Sources
You need to connect all your data for a full view. Bring in social media stats, campaign numbers, and other sources. This gives you one big dashboard for your marketing campaign. You can track posts, likes, audience size, and hashtag use for each influencer. Here are some best practices:
- Put together data from all social media and campaign sources.
- Watch data as it comes in for quick updates.
- Use clear reports to show what is happening.
FineReport can connect to many data sources. You can link databases, spreadsheets, and APIs. This makes your dashboard complete and correct. Always control who can see or change your dashboard. Only let the right people in and follow privacy rules like GDPR.
Automating Data Collection
Typing in data by hand takes too long and can cause errors. Use automation to collect data for your dashboard. This gives you fast and correct feedback on your influencer marketing. Automation links feedback with results, so you know which influencer works best. You can:
- Get feedback faster to track your campaign better.
- Receive up-to-date and exact data for your dashboard.
- Match opinions with numbers for a full picture.
FineDataLink from FanRuan helps you sync data right away. It supports ETL and ELT, so your dashboard always has the newest results. You can back up your dashboard and test recovery to keep your data safe. Automation lets you spend more time making your influencer marketing better instead of just collecting numbers.
Build and Optimize Your Influencer Marketing Dashboard
Making a good dashboard for influencer marketing helps you see how creators do. You can track results and make things better. Follow these steps to build, use, and improve your dashboard for success.
Design Dashboard Layout
First, plan how your dashboard will look. A simple layout helps you find information fast. Organize your dashboard so you can see creator results and trends quickly. FineReport lets you move charts and tables easily. You do not need to write code.
| Frequency | Purpose |
|---|---|
| Weekly | Scorecards for each creator show spend, reach, and efficiency. |
| Monthly | Reviews show results by platform, niche, and content type. |
| Quarterly | Dashboards for leaders connect influencer spend to big company goals. |
Set clear goals for your campaign before picking your dashboard layout. Make sure your goals match your brand’s vision. Choose key indicators that show progress for each creator. This helps you see if your content marketing works.
FineReport lets you change your dashboard layout. You can use tiled, vertical, or full-screen views. This helps you build a dashboard that fits your team. Responsive design means you can check live analytics on any device.
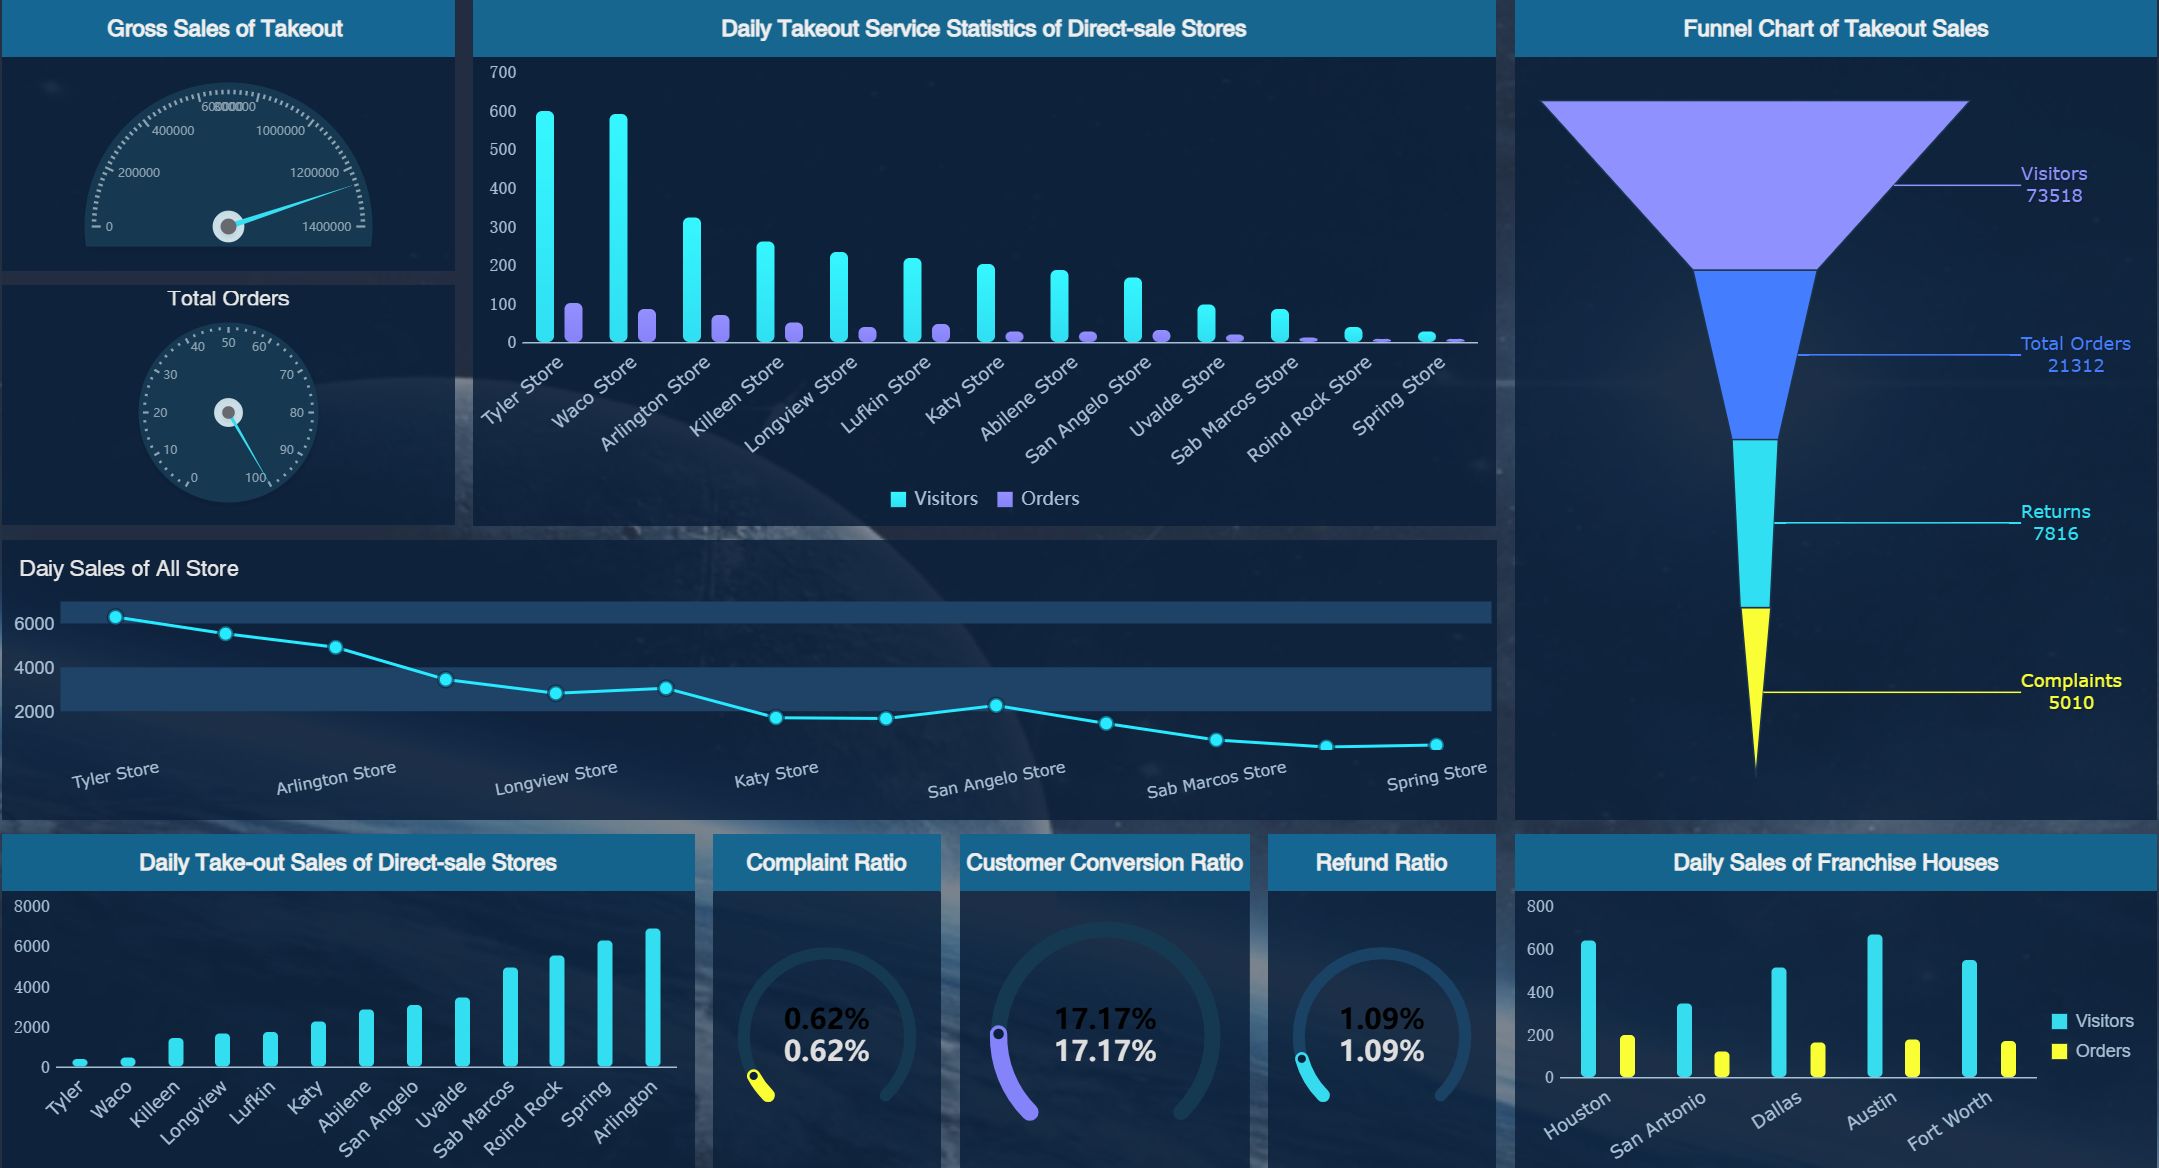
Add Visualizations and KPIs
Visualizations turn numbers into easy stories. Use charts, graphs, and tables to show how creators perform. Pick KPIs that matter most, like engagement, reach, conversions, and cost per acquisition. Do not add too many metrics. Focus on the ones that show real results.
| Strategy | Details |
|---|---|
| Select Relevant KPIs | Pick KPIs like engagement, reach, and conversions that fit your campaign goals. |
| Visual Hierarchy | Organize data so important metrics are easy to see. |
| Interactive Features | Let users explore data with filters and drill-downs. |
| Combine Insights | Mix numbers with feedback for a full view of engagement. |
| Multi-Platform Integration | Bring in data from different social media platforms for one big analysis. |
| Emphasize ROI | Focus on metrics that show the money impact of campaigns. |
| Standardize Definitions | Use the same metric definitions so everyone understands. |
FineReport has over 100 chart types, including 3D charts. You can drag and drop these into your dashboard. Responsive design means your dashboard looks good on any screen. Use filters to compare creator results by platform or campaign. Drill down to see what drives engagement and conversions.
You can mix numbers with sentiment analysis. This gives you a full view of creator results and audience feelings. Use the same metric definitions so your team understands the results.
Automate Reporting and Updates
Automation saves time and keeps your dashboard current. Set up FineReport to pull data from social platforms, spreadsheets, and APIs. Your dashboard always shows the latest creator results and campaign outcomes. Automation helps you track live analytics and react fast to changes.
Use UTM parameters to track conversions for each creator. This shows which influencer brings the most results. FineReport can schedule reports, so you do not need to update them by hand. Stakeholders get the newest results automatically.
Stay flexible and check your dashboard metrics often. Remove metrics that do not help you decide. Add new ones as your goals change. Test your dashboard with your team. Get feedback and make your dashboard easier to use.
Use tools like sentiment analysis and usability testing to make your dashboard better. Track industry benchmarks for engagement rate, conversion rate, and ROI. Compare your results to these benchmarks to see how you are doing.
A good dashboard helps you make smart choices. You can manage creator performance, improve results, and make your content marketing strategy stronger. FineReport give you tools to build a dashboard that grows with your business.
You can make a good influencer marketing dashboard by following easy steps. Use analytics to watch what is important and change your plan fast. Custom dashboards help you see how your campaigns are doing. They also help you make smart choices. Keep making your dashboard better for long-term success.
- Custom dashboards show analytics in a simple way for your team.
- Look at analytics that show real results, not just simple numbers.
- Analytics tools help you find trends and change your plans quickly.
| Strategy | Description |
|---|---|
| Meaningful Metrics | Use analytics to check engagement, conversions, and audience feelings. |
| Tracking Engagement Authenticity | Look at analytics to see if the audience really acts, not just counts. |
| Predictive Analytics | Use analytics to help plan and make future campaigns better. |
Start making your dashboard now. Let analytics help your influencer marketing get even better.


FAQ

The Author
Lewis
Related Articles

Portfolio Reporting for PMOs: 9 Executive Metrics Every Weekly Portfolio Dashboard Should Include
Weekly portfolio reporting should help executives answer three questions fast: Are we delivering the right initiatives, are we putting outcomes at risk, and what decisions need leadership this week? For PMOs, that means
Yida Yin
Jul 01, 2026

How to Build an Investment Portfolio Reporting Dashboard for Executives: KPIs, Benchmarks, and Drill-Down Views
Investment portfolio reporting for executives is not about showing every holding, transaction, and chart your investment team can produce. It is about giving CEOs, CFOs, CIOs, boards, and investment committees a fast, re
Yida YIn
Jun 25, 2026

12 KPI Reporting Examples for Executive Dashboards: What to Show in Weekly, Monthly, and Quarterly Reviews
Executive leaders do not need more data. They need decision ready $1 examples that match how often they review the business and what actions they are expected to take. A weekly $1 should surface fast moving risks and per
Yida YIn
Jun 25, 2026