A GRC dashboard is a centralized visual interface that aggregates data across Governance, Risk, and Compliance functions to provide real-time insights into an organization's risk posture. It enables executives to monitor regulatory adherence, identify emerging threats, and ensure corporate activities align with strategic objectives through automated reporting and interactive analytics.
Understanding the Core Value of a GRC Dashboard
Defining Governance, Risk, and Compliance (GRC) Integration
In the modern enterprise, Governance, Risk, and Compliance are no longer distinct silos but interconnected pillars. Governance sets the strategic direction; Risk Management identifies the obstacles to that strategy; and Compliance ensures the journey stays within legal and ethical boundaries. A GRC Dashboard acts as the nervous system of this framework. By consolidating these three domains, organizations can see how a failure in compliance directly impacts their risk profile and, subsequently, their governance objectives. According to Gartner, integrated GRC platforms are essential for navigating the "polycrisis" environment where risks are increasingly correlated.
The Transition from Manual Spreadsheets to Automated Dashboards
For decades, GRC data lived in fragmented Excel sheets, updated manually every quarter. This "static" approach is no longer viable. Manual reporting is prone to human error, lacks version control, and is outdated the moment it is printed. Transitioning to an automated GRC dashboard allows for dynamic data refreshing. Instead of looking in the rearview mirror, leadership can view a "live" cockpit. This shift reduces the "compliance tax"—the hidden cost of manual data gathering—and redirects expert resources toward strategic analysis rather than administrative data entry.
Key Stakeholders: Who Benefits from GRC Visualization?
A well-designed dashboard serves multiple audiences. Board Members require high-level summaries to fulfill their fiduciary duties. Chief Risk Officers (CROs) need to see cross-departmental risk correlations. Compliance Officers focus on specific regulatory checklists (like GDPR or SOX). Finally, Internal Auditors use these dashboards to identify "red flags" before they become audit failures. Effective visualization ensures that each stakeholder receives the right level of granularity without being overwhelmed by noise.
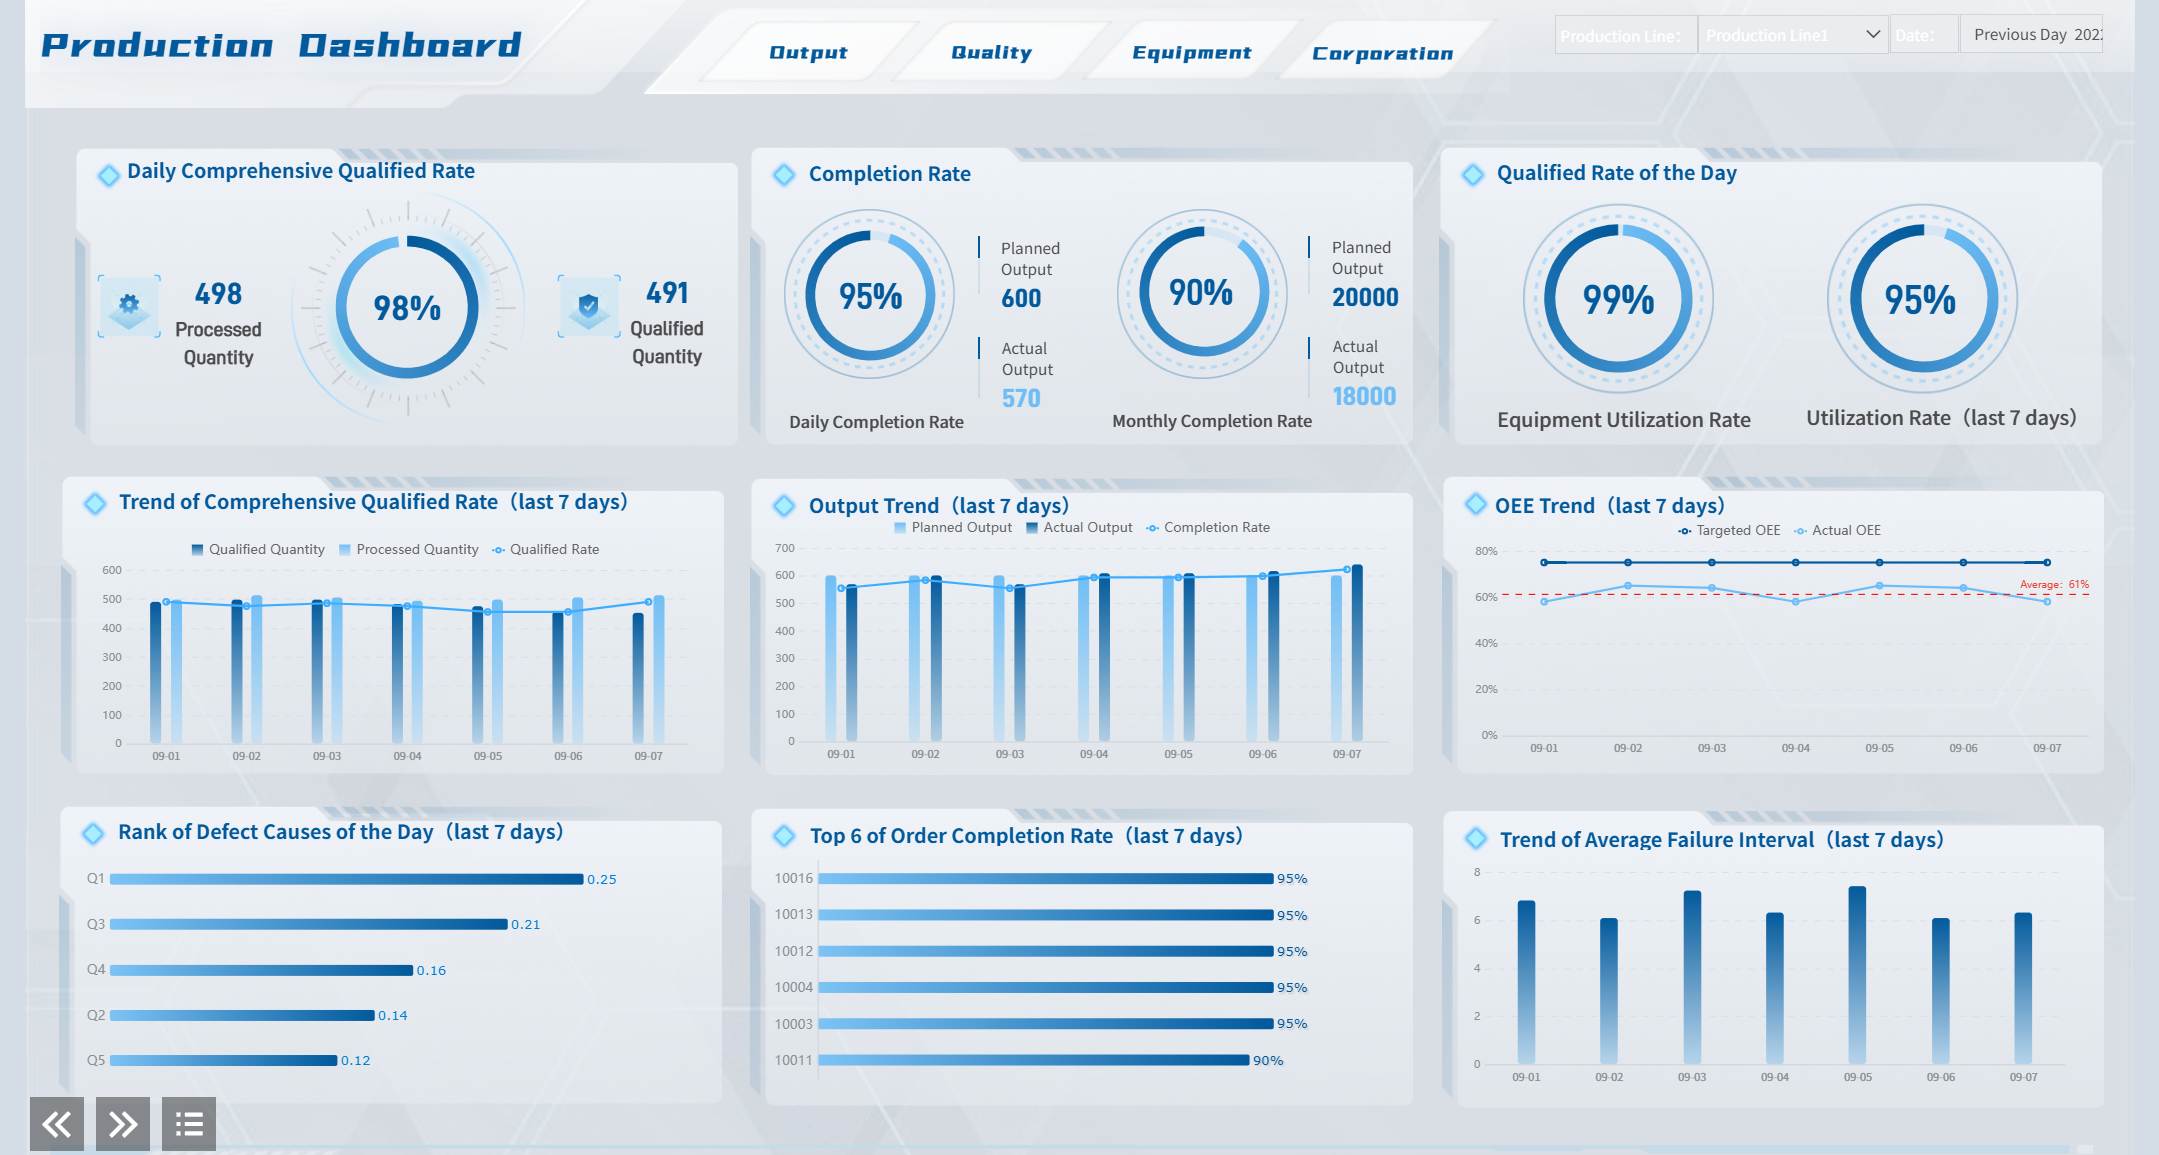
A multi-level management dashboard showing high-level KPIs for executives and detailed operational views for department heads, similar to the "Management Dashboard" templates in the FineReport Demo Gallery.
When organizations struggle with fragmented data sources , you can click the banner below to see how FineReport’s powerful data integration engine creates a unified view for all stakeholders.

Essential Features of a High-Performing GRC Dashboard
Real-Time Risk Heat Maps and Trend Analysis
The cornerstone of any GRC dashboard is the Risk Heat Map. This visualizes risks based on Likelihood vs. Impact. However, a high-performing dashboard goes further by incorporating "Trend Indicators." Are your cybersecurity risks increasing or decreasing over the last six months? By utilizing color-coded zones (Red, Amber, Green), decision-makers can instantly prioritize where to allocate capital and human resources. This proactive visualization helps in identifying "Black Swan" events before they escalate.
Compliance Status Tracking and Regulatory Mapping
Regulatory landscapes are shifting faster than ever. A robust dashboard must map internal controls to specific regulatory requirements. Whether it’s ISO 27001, HIPAA, or local financial regulations, the dashboard should provide a "Compliance Scorecard."
- Current Adherence Rate: Percentage of controls currently passing.
- Gap Analysis: Number of outstanding remediations.
- Upcoming Deadlines: Automated alerts for license renewals or audit filings.
Drill-Down Capabilities for Root Cause Analysis
Surface-level data is rarely enough to solve a problem. If a dashboard shows a spike in "Operational Risk" in the APAC region, a user must be able to click that data point to reveal the underlying cause—be it a specific vendor failure or a localized process bottleneck. This "Drill-Down" functionality transforms a dashboard from a mere display into a diagnostic tool.
| Feature | Strategic Value | Operational Impact |
|---|---|---|
| Heat Map | Long-term resource planning | Immediate risk prioritization |
| Drill-Down | Identifies systemic weaknesses | Shortens incident response time |
| Real-time API | Ensures data integrity | Eliminates manual entry errors |

Effective risk management requires capturing data from the front lines in real-time. You can check the button below to explore how FineReport's mobile-entry features allow field staff to report risks directly into your central GRC system.

Implementation Methodology: Building a Robust GRC View
Data Consolidation: Breaking Down Silos for a Single Source of Truth
The biggest hurdle in GRC is "Dirty Data" spread across ERPs, HR systems, and local servers. Implementation must begin with an ETL (Extract, Transform, Load) process. By creating a unified data layer, you ensure that the GRC dashboard reflects the truth. This involves standardizing risk taxonomies so that "High Risk" means the same thing in Finance as it does in IT.
Designing User-Centric UI/UX for Executive Decision Making
A dashboard is only as good as its adoption rate. Complexity is the enemy of clarity. High-performing GRC views utilize "progressive disclosure"—showing only the most critical information first and hiding complex datasets behind tabs or clicks. Using a low-code design approach allows GRC professionals to build layouts that mirror their actual workflows rather than forcing them into a rigid vendor template.
Integrating Continuous Monitoring and Alert Systems
Modern GRC is moving toward "Continuous Control Monitoring" (CCM). Instead of periodic testing, the dashboard is linked to live system logs. If a user’s access rights exceed a certain threshold (violating Segregation of Duties), the GRC dashboard should trigger an automated alert. This turns the dashboard into an active defense mechanism.
Managing complex data environments requires a tool that connects to any database. Use the banner below to see how FineReport's 60-plus data source connectors simplify the creation of a "Single Source of Truth" .

Overcoming Common Challenges in GRC Reporting
Solving Data Fragmentation and Quality Issues
Many firms suffer from "Multiple Versions of the Truth." When the Finance dashboard says one thing and the Risk dashboard says another, trust in the system evaporates. Overcoming this requires strong data governance. Establishing clear ownership of data points and using automated validation rules at the point of entry can significantly improve the reliability of your GRC dashboard.
Balancing Depth of Detail with Executive Clarity
Executives often complain of "Dashboard Fatigue." To counter this, use the "Rule of Three": highlight the Top 3 Risks, the Top 3 Compliance Gaps, and the Top 3 Strategic Actions. Detailed technical logs should be accessible but never the primary view.
Ensuring Scalability in a Shifting Regulatory Landscape
As a business grows, its risk profile changes. A dashboard built for a regional player will break under the weight of global regulations. Choosing a platform that supports high-concurrency and multi-node clusters ensures that as your data grows, your dashboard performance doesn't degrade.
| Challenge | Solution | ROI Metric |
|---|---|---|
| Siloed Data | Unified BI Integration | Reduction in reporting time |
| Lack of Context | Qualitative Commentary fields | Increased board engagement |
| Performance Lag | Intelligent Caching/Indexing | Dashboard load speed |
Future Trends: AI and Predictive Analytics in GRC
From Reactive to Proactive: The Rise of Predictive Risk Modeling
The next generation of the GRC dashboard will not just show what happened, but what might happen. By applying machine learning to historical data, these systems can identify patterns that precede a breach or a compliance failure.
Natural Language Processing (NLP) for Regulatory Intelligence
Imagine asking your dashboard, "What is our exposure to the new EU AI Act?" and having it scan thousands of pages of regulations and cross-reference them with your internal controls. NLP integration is making this a reality, allowing for conversational GRC queries.
The Role of Low-Code Platforms in Agile GRC Development
Agility is key. When a new regulation like ESG (Environmental, Social, and Governance) reporting arises, firms cannot wait six months for IT to build a new report. Low-code reporting tools like FineReport empower the GRC team to build and modify their own dashboards in days.
As you look to future-proof your risk management strategy, you can click the Demo Experience banner below to see how FineReport’s flexible, low-code architecture adapts to emerging ESG and AI regulations.
Continue Reading About GRC Dashboard
How to Create a Risk Management Dashboard for Your Business
What is a Risk Dashboard and How Does It Work
What ESG Risk Management Is and Why It Matters For Companies


FAQ

The Author
Lewis
Senior Data Analyst at FanRuan
Related Articles

Portfolio Reporting for PMOs: 9 Executive Metrics Every Weekly Portfolio Dashboard Should Include
Weekly portfolio reporting should help executives answer three questions fast: Are we delivering the right initiatives, are we putting outcomes at risk, and what decisions need leadership this week? For PMOs, that means
Yida Yin
Jul 01, 2026

How to Build an Investment Portfolio Reporting Dashboard for Executives: KPIs, Benchmarks, and Drill-Down Views
Investment portfolio reporting for executives is not about showing every holding, transaction, and chart your investment team can produce. It is about giving CEOs, CFOs, CIOs, boards, and investment committees a fast, re
Yida YIn
Jun 25, 2026

12 KPI Reporting Examples for Executive Dashboards: What to Show in Weekly, Monthly, and Quarterly Reviews
Executive leaders do not need more data. They need decision ready $1 examples that match how often they review the business and what actions they are expected to take. A weekly $1 should surface fast moving risks and per
Yida YIn
Jun 25, 2026