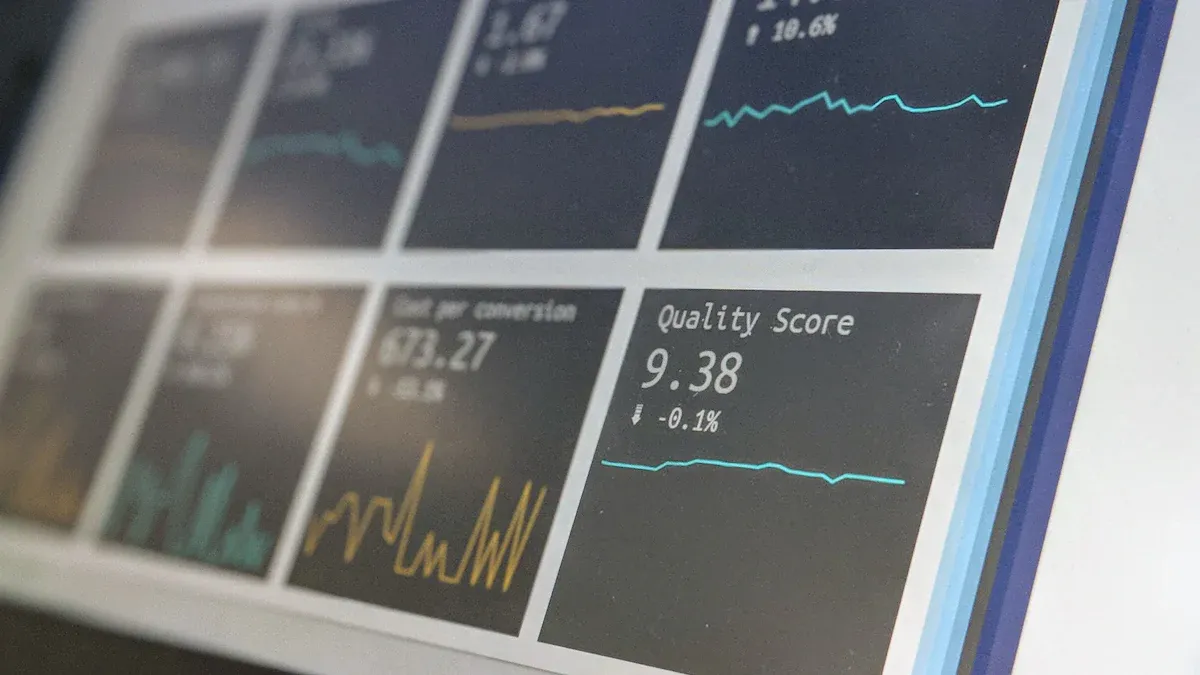
An enterprise dashboard shows your company’s main data in one spot. You use it to watch important numbers, see patterns, and make good choices fast. In 2026, you depend on dashboards to get correct data, act quickly, and earn more money. Tools like FineReport help you save time and work better by doing analytics for you and giving you reliable ideas. With new features, companies make more money and choose better, faster than before.
An enterprise dashboard lets you see your company’s most important information all in one place. This tool helps you keep track of your business goals, find problems, and make smart choices. You do not have to look through lots of reports or systems. Everything you need is right on one screen.
Business experts talk about enterprise dashboards in different ways. You can look at the main types in the table below:
Definition Type
Description
High-level Reporting
Gives you quick answers to big business questions and helps you decide fast.
Operational Dashboard
Lets you watch daily business activities with real-time data for quick action.
Strategic Dashboard
Shows you an overview of important numbers for leaders, focusing on long-term trends and patterns.
Analytical Dashboard
Helps you dig deep into data and find out why things happen in your business.
You might use an operational dashboard to check sales every hour. A strategic dashboard helps you see how your company grows over months or years. An analytical dashboard lets you find out why sales dropped last week. Each type gives you a different view, but all help you understand your business better.
You can also call this tool an enterprise data dashboard. It brings together numbers from many places, so you always see the newest updates. You get a clear picture of your business, which helps you act fast and stay ahead.
Core Purpose and Value of Enterprise Dashboard
The main reason for an enterprise dashboard is to help you make better choices. You see real-time numbers and trends, so you can act before problems get bigger. You save time because you do not have to gather data from lots of places. You also work better because you see everything you need at once.
Here are some main functions and benefits:
You make better decisions. Real-time data and clear visuals help you pick the best path quickly.
You work faster. You spend less time looking for information and more time using it.
You boost teamwork. When everyone sees the same dashboard, your team can talk about the same facts and work together better.
You fix problems early. Dashboards show you issues as soon as they come up, so you can solve them before they get worse.
You watch performance. You track progress toward goals and spot areas that need help.
A dashboard works as a main hub for your business. It brings together key performance indicators (KPIs) and metrics, making hard information easy to understand. You can track sales, costs, customer feedback, or any other important number. When you see all this data in one place, you can spot trends and make changes fast.
You also get real value. Many companies save money on training because dashboards are simple to use. Some organizations cut training costs by half, saving thousands of dollars each year. Teams save time, reach goals faster, and even grow their business more quickly. For example, some companies see new workers become productive weeks sooner, which helps the whole business do better.
Dashboards also help you plan for the future. You can look at old data, spot patterns, and guess what might happen next. This helps you set better goals and get ready for changes. You create one place for the truth in your company, so everyone trusts the numbers and works toward the same goals.
Tip: When you use an enterprise dashboard, you build a data-driven culture. Your team learns to trust data, make choices based on facts, and work together to reach business goals.
Why Enterprise Dashboard Matters
Impact on Decision-Making
You have to make good choices every day. An enterprise dashboard helps you do this easily. It puts all your important numbers together in one spot. This way, you can see problems and fix them quickly. You do not need to wait for old reports or guess what is happening. You get real-time data, so you always know what is going on right now.
Many companies changed a lot after using dashboards. For example:
United Airlines made a real-time data hub with over 100 systems.
Leaders could see everything about their work in one place.
They cut delay minutes by 27% and had 42% fewer maintenance cancellations.
The dashboard helped them find problems early and fix them fast.
You face many problems when making business choices. The table below shows how dashboards help you solve these problems:
Connects all data types and gives you answers without waiting
Delayed understanding and reactive choices
Reasons across all data and lets you act within safe limits
Execution gap in analytics systems
Brings in data all the time and helps you act on real-time insights
FineReport makes things even easier for you. You can use its real-time numbers to watch sales, costs, and other key facts as they happen. The dashboard lets you look into data and find out why things change. You can see patterns, learn what works, and make better choices every day.
When you use a dashboard, you do more than see numbers. You get ideas that help you lead your team and grow your business.
Boosting Efficiency and Performance
You want your team to work faster and smarter. A dashboard helps you do this. You save time because you do not have to search for information in many places. Everything you need is right in front of you.
After companies started using dashboards, they saw big improvements:
Customer satisfaction went up by 18%.
Profit margins grew by 12%.
Employee productivity increased because training and roles matched better.
Delays dropped by 25%.
You also save time with automated reporting. The dashboard finds problems early, so you can fix them before they cost you money. You avoid mistakes and keep your business running smoothly.
FineReport gives you even more ways to boost performance. The table below shows how its features help your business:
Feature
Benefit
Real-Time Data Visualization
Lets you watch sales and performance as they happen
Comprehensive Analysis
Helps you look deep into your data and find ways to improve
Works with your current systems for smooth workflows
Predictive Insights
Uses analytics to forecast sales and spot new growth opportunities
You can use FineReport to connect all your data, make clear visuals, and share ideas with your team. You get one place for the truth, so everyone works with the same facts. This helps you reach your goals faster and with less effort.
A dashboard is not just a tool. It is your partner in making your business stronger every day.
Key Features of FineReport Enterprise Dashboard
Real-Time Enterprise Data Integration
Your enterprise dashboard should always show the newest numbers. FineReport connects to many data sources like databases and cloud storage. You can build reports fast with drag-and-drop tools. FineReport updates your data in real time, so you see the latest facts. This helps you make smart choices. FineDataLink lets you move data between systems easily. You do not need to write hard code because FineReport uses a simple, Excel-like design.
You want your dashboard to match your business. FineReport lets you change reports and dashboards in many ways. You can use charts, 3D pictures, and flowcharts to show your data. These tools help you spot patterns and trends. FineReport supports bullet maps, combo charts, and pictograms. This makes your analytics more fun and easy to use. When you use these features, hard data becomes simple to understand. This helps your team stay interested and make smart choices.
Data visualization helps you see big numbers and changes. You can use advanced analytics to learn more and find what helps your business grow.
Mobile Dashboard Access
You need to check your dashboard when you are away from your desk. FineReport lets you see your dashboard on phones and tablets. You get real-time data and important facts anywhere. This helps you act fast and stay in touch with your business. Mobile dashboards help your team react quickly and keep up with changes. You can make choices while moving, which helps you work better and keeps your business strong.
Benefit
Description
Responsive Access
See dashboards on any device
Real-Time Insights
Get updates and analytics right away
Faster Decision-Making
Make choices quickly, even when not in the office
Security and Permission Control
You want to keep your business data safe. FineReport uses strong security to protect your information. You get encryption, data masking, and many layers of safety. The platform has login checks, password rules, and storage encryption. You can set permissions so only the right people see private data. This role-based dashboard follows top industry rules. You can also watch user actions and get back lost data if needed. FineReport keeps your data safe on computers and mobile devices.
Security Feature
Description
Encryption and Data Masking
Keeps private data safe from wrong users
Authority Control
Lets you choose who can see what
Mobile App Security
Makes sure phones and tablets are safe
Operational Audit
Watches user actions for safety and rules
FineReport helps you feel safe by protecting your dashboard and making sure only the right people can see it.
Enterprise Dashboard Analytics and Use Cases
Industry Applications
Enterprise dashboards are used in almost every industry now. These dashboards help you turn numbers into clear information. You can find trends and see how things are going. Dashboards help you make better choices. They show you what is most important at work.
When all your data is together, you make better choices. You see all your numbers in one place and act fast.
Dashboards do some jobs for you. They make reports, so you save time and do less work by hand.
You and your team see the same data right away. This helps everyone work together better.
You can check how busy your team is. This helps you give out jobs in a smart way.
Dashboards link your plans to what you do each day.
Dashboards help you understand hard data fast. You do not need to be a data expert. You can click and look around the dashboard to get answers. This makes data easy for everyone at work.
Here is how different industries use dashboards:
Sector
Purpose
Manufacturing
Watch main numbers, make work better, and help production.
Retail
See what customers do, watch sales, and check stock.
Healthcare
Watch important numbers to help patients and use resources well.
Finance
Watch money, stick to budgets, and make good choices.
Success Stories with FineReport
You can see real changes when you use FineReport. For example, BOE Technology Group had problems with data in many places and slow reports. They used FineReport to make one dashboard. Now, all their data is together and they can watch important numbers easily.
After using FineReport, BOE spent 5% less on inventory. They worked 50% better than before. Managers could compare factories and find problems early. The dashboard helped them make faster and smarter choices.
Many other companies use FineReport dashboards too. You can watch sales, check on patients, or handle budgets easily. FineReport helps you see your data and act fast. You get one true place for your numbers, so your team can work together and reach goals.
Tip: Dashboards like FineReport help everyone at work make better choices every day.
Enterprise dashboards give you a clear view of your business. You make decisions 23% faster and spot problems before they grow. With dashboards, you get instant insights, share data with your team, and act on real-time alerts.
AI and machine learning will make dashboards smarter, giving you better predictions and advice.
Dashboards help you track progress, plan for the future, and reach your goals.
You can use tools like FineReport to turn data into action. In 2026 and beyond, dashboards will shape how you grow and succeed.
Product Trial
FineReport
Pixel-perfect reports · Interactive dashboards · Easy data entry · Digital twins
Access a wealth of case studies, industry insights, and solution guides to accelerate digital transformation.
FAQ
What is enterprise data and why does it matter?
Enterprise data puts all your company’s information together. It helps you make smart choices for your business. You can watch sales, costs, and what customers think. Enterprise data shows you how your business is doing. You need it to help your company grow and do well.
How does enterprise analytics help my business?
Enterprise analytics helps you look at enterprise data. You can find patterns and see trends. It helps you notice problems before they get big. You use enterprise analytics to make better plans. It lets you act quickly and reach your goals.
Can I use enterprise data on my phone?
Yes, you can use enterprise data on your phone. FineReport lets you see your data anywhere you go. You get updates right away. You can check your data at work or when you travel. Enterprise data is always there for you.
How do dashboards keep enterprise data safe?
Dashboards use strong security to keep enterprise data safe. You choose who can see your data. FineReport uses encryption and checks to protect it. You control who gets access to your data. This keeps your data safe from people who should not see it.
Why should I use enterprise analytics every day?
You use enterprise analytics every day to stay ahead. It helps you see changes fast. You can fix problems before they get worse. Enterprise analytics helps you make smart choices. It keeps your business strong.