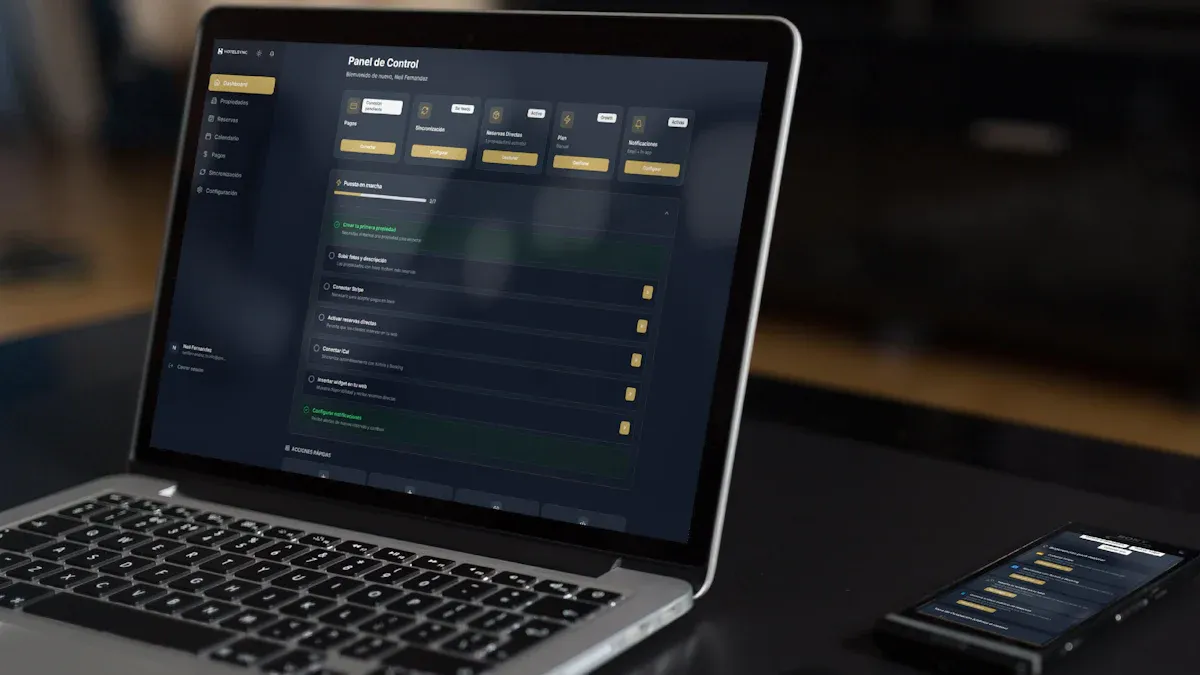
Operations Directors do not need another static inventory report. They need a weekly operating view that links demand forecasting and inventory management to real decisions: what to buy, what to produce, where to replenish, and which risks need intervention before service levels drop.
A strong dashboard should do two jobs at once. First, it should show trusted operational KPIs across forecast quality, stock health, service performance, and inventory cost. Second, it should upgrade those KPIs from passive visibility into guided action. With FineBI + Dora, business users can ask for analysis in chat, generate chart-based answers or dashboard-style views from trusted BI assets, and receive scheduled summaries before the next meeting.
 Click To Try The Dashboard
All dashboards in this article are built with FineBI
Demand forecasting and inventory management dashboard essentials
A weekly dashboard for Operations Directors should connect three goals:
- Planning quality: Are forecasts still reliable enough to support this week’s purchasing and production decisions?
- Replenishment effectiveness: Are reorder points, safety stock, and supplier lead times still aligned with current demand?
- Service performance: Are customers receiving what they need without unnecessary working capital tied up in excess inventory?
In practical operations terms, demand forecasting means estimating what customers or internal channels will require by SKU, location, and time period. It is not only a planning exercise for next quarter. It is a weekly control mechanism for deciding whether inventory policies still fit actual demand behavior.
Weekly visibility matters more than monthly summaries because operations risk builds quickly. A monthly report may confirm that forecast bias existed or service performance declined. A weekly dashboard helps teams see the pattern early enough to correct allocations, expedite replenishment, adjust purchasing, or re-prioritize constrained stock.
A KPI dashboard turns forecast signals into inventory decisions by answering questions such as:
- Which SKUs or categories are deviating most from the forecast?
- Where is forecast error now large enough to threaten service?
- Which locations are overstocked while others face stockouts?
- Are lead time shifts making current reorder points unsafe?
- Which exceptions deserve management attention this week?
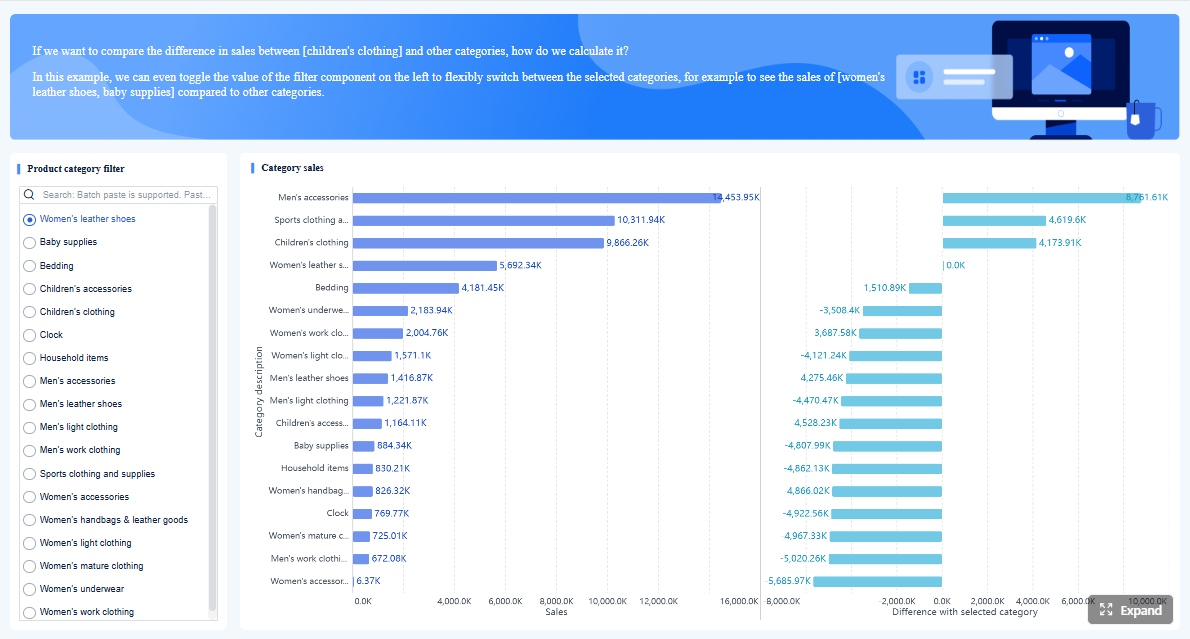
With FineBI, these questions can be structured into governed dashboards, metric models, and drill-down paths. With Dora layered on top, teams do not have to search through multiple views manually. They can use natural-language requests over trusted BI assets, retrieve the relevant dashboard or metric, and get a chart-based answer or dashboard-style analysis view with summaries and follow-up prompts.
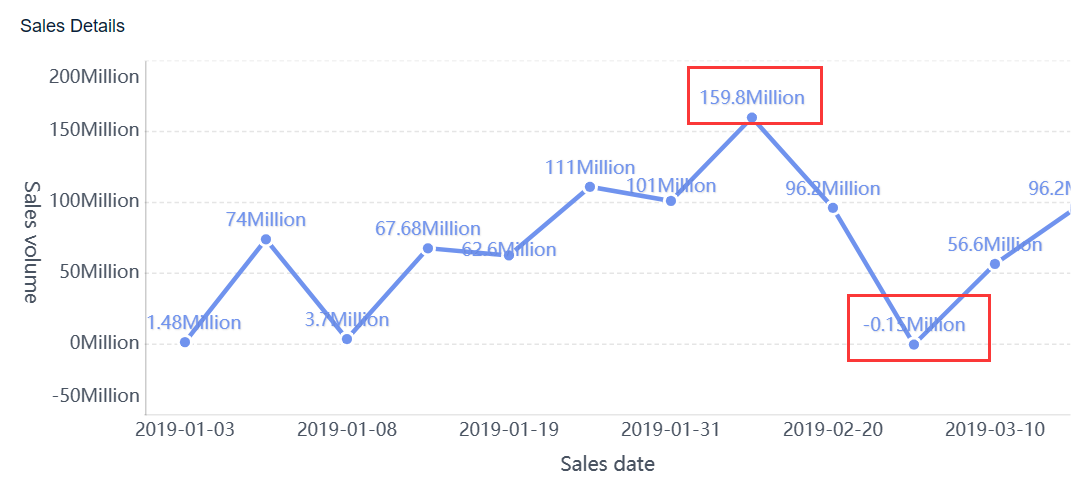
The 12 KPIs Operations Directors should track weekly
The best demand forecasting and inventory management dashboard does not overload users with dozens of metrics. It highlights the weekly indicators that connect demand quality to inventory action and financial impact.
Forecast accuracy and forecast bias
These two KPIs are the first signal of whether planning quality is improving or drifting.
-
Forecast Accuracy: Measures how close forecasted demand is to actual demand over a defined period.
Business value: Better accuracy supports more reliable purchasing, production planning, and replenishment decisions. Poor accuracy leads directly to overstock, stockouts, and unstable service.
AI use: Dora can retrieve forecast accuracy by SKU, category, region, or planner, compare current results with prior weeks, and summarize where forecast quality is deteriorating. -
Forecast Bias: Measures whether forecasts consistently overestimate or underestimate demand.
Business value: Bias is especially useful because average accuracy alone can hide systematic error. Persistent over-forecasting inflates inventory, while under-forecasting raises shortage risk.
AI use: Dora can detect directional bias, flag categories with repeated over- or under-planning, and push a weekly exception summary to planning and operations owners.
Operations Directors should not review these metrics only at aggregate level. Weekly breakdowns by product family, warehouse, planner, and channel reveal where forecasting discipline is breaking down before inventory problems become expensive.
Stockout rate, fill rate, and service level
These are the customer-facing outcomes of demand and replenishment quality.
-
Stockout Rate: The percentage of SKUs, orders, or demand instances where inventory was unavailable when needed.
Business value: A rising stockout rate signals missed revenue, fulfillment disruption, and customer dissatisfaction.
AI use: Dora can identify the top drivers of stockouts by SKU and location, summarize likely causes, and notify responsible teams when threshold levels are breached. -
Fill Rate: The percentage of customer demand fulfilled immediately from available stock.
Business value: Fill rate shows how well the current inventory position supports immediate service without delay or substitution.
AI use: Dora can return fill rate trends through chat, compare regions or product lines, and generate a chart-based answer for weekly service reviews. -
Service Level: The broader measure of whether target availability or fulfillment expectations are being met.
Business value: Service level links operations performance to customer experience and commercial reliability.
AI use: Dora can retrieve service level metrics from FineBI dashboards, match them to SLA or internal target rules, and include them in scheduled weekly briefings.
When these metrics weaken while forecast bias and lead time variability rise, the dashboard should make that relationship visible. FineBI supports that cross-metric analysis through a trusted semantic layer, while Dora helps users ask for the cause in plain language.
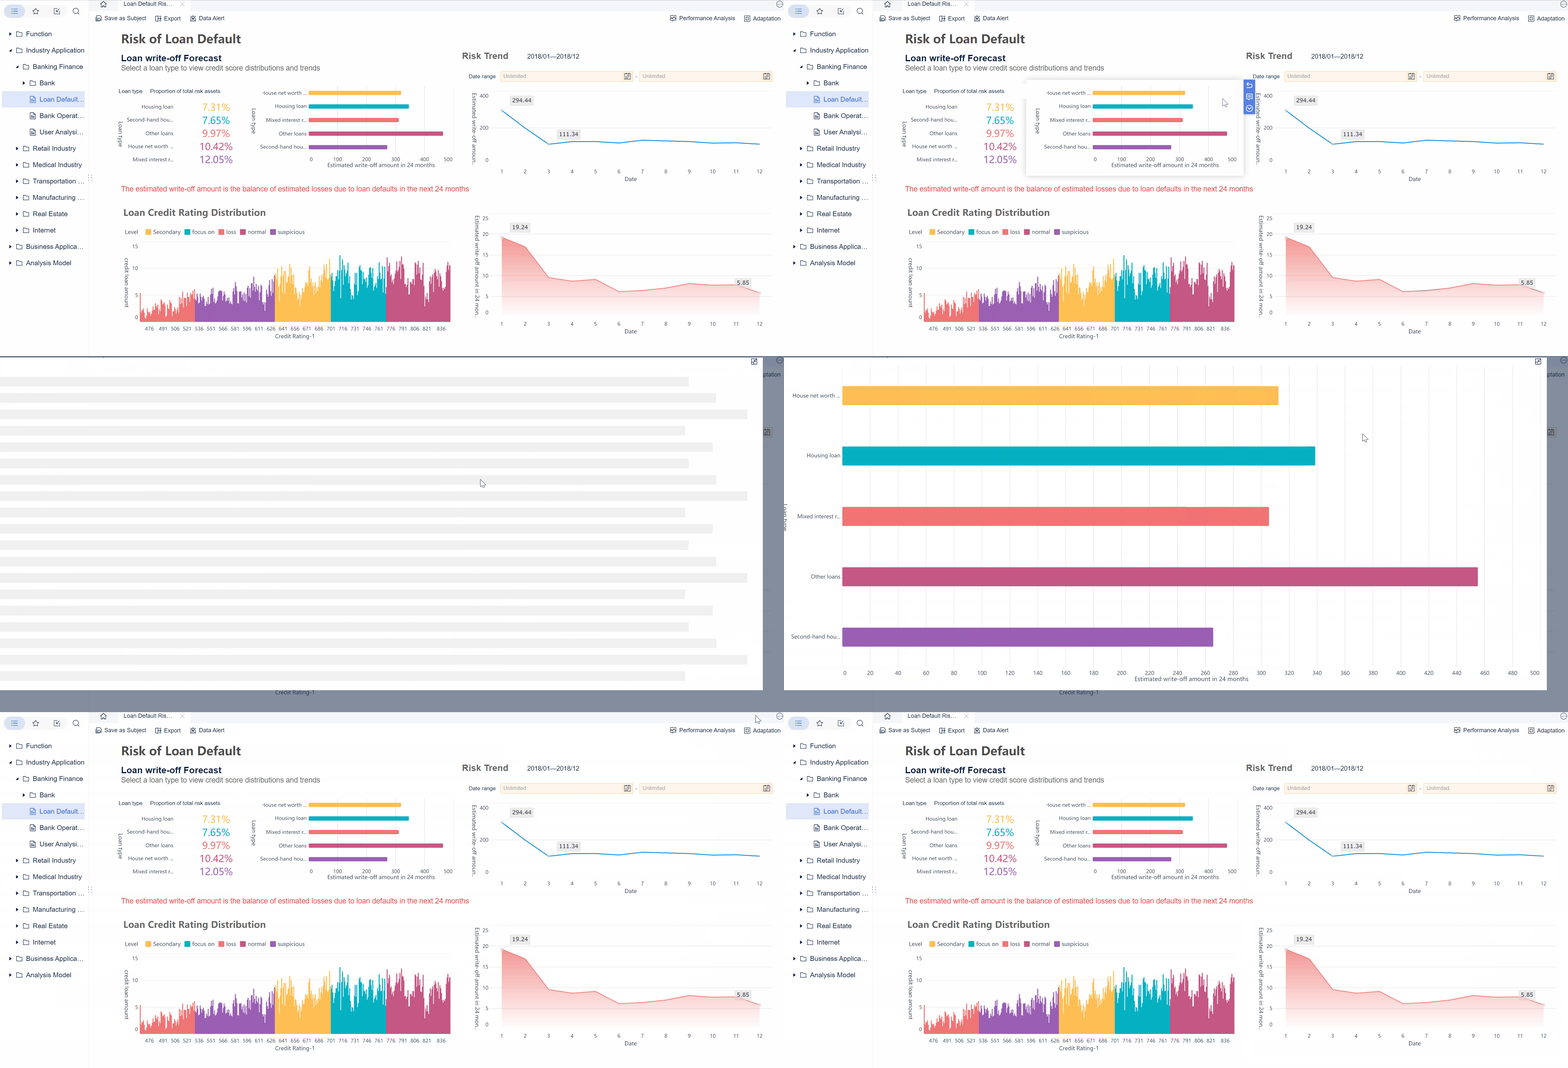
Inventory turnover and days of inventory on hand
These KPIs show whether inventory is moving at the right speed.
-
Inventory Turnover: Measures how often inventory is sold or used during a period.
Business value: Higher turnover typically indicates healthier stock movement and better capital efficiency, though context matters by category.
AI use: Dora can retrieve turnover by SKU class or warehouse, compare against historical norms, and summarize which segments are slowing. -
Days of Inventory on Hand (DOH): Estimates how many days current stock will last based on recent or forecasted demand.
Business value: DOH helps balance working capital against shortage risk. Too high suggests excess stock; too low suggests vulnerability.
AI use: Dora can answer questions like “Which SKUs have less than 10 days of coverage but high demand variance?” and return a chart-based risk list.
These KPIs are especially valuable when reviewed together. A category can show acceptable total inventory but still contain a dangerous mix of slow-moving overstock and fast-moving understock.
Safety stock, reorder point, and lead time variability
These are policy metrics. They show whether inventory control logic still fits current operating conditions.
-
Safety Stock: The buffer inventory held to absorb demand or supply uncertainty.
Business value: Too little safety stock increases stockout risk; too much ties up cash and storage capacity.
AI use: Dora can compare current safety stock rules to actual variability and highlight which buffers look misaligned. -
Reorder Point: The inventory level that triggers replenishment.
Business value: An outdated reorder point can cause both shortages and excess buying. It should reflect current demand patterns and supplier timing.
AI use: Dora can retrieve reorder point exceptions, compare against actual consumption and lead time behavior, and suggest which SKUs deserve review. -
Lead Time Variability: Measures how inconsistent supplier or internal replenishment lead times are.
Business value: Volatile lead times reduce the reliability of reorder logic and often require safety stock adjustments.
AI use: Dora can monitor lead time volatility weekly, flag sudden changes, and push alerts to procurement and operations stakeholders.
For Operations Directors, these KPIs are often where the real action happens. Forecasts may be acceptable on paper, but if lead times shift or supplier consistency drops, inventory rules must be updated quickly.
Carrying cost, obsolescence risk, and backorder rate
These KPIs expose the financial and service consequences of poor inventory alignment.
-
Carrying Cost: The cost of holding inventory, including storage, capital, insurance, and handling.
Business value: Carrying cost makes excess stock visible in financial terms rather than just units on hand.
AI use: Dora can summarize where carrying cost is rising fastest and link that trend to forecast bias or low turnover. -
Obsolescence Risk: The likelihood that inventory will become unsellable, expired, outdated, or heavily discounted.
Business value: This helps protect margin and reduce write-downs, especially for seasonal, fast-changing, or lifecycle-sensitive items.
AI use: Dora can combine aging, slow movement, and forecast patterns to produce a weekly exception list for review. -
Backorder Rate: The percentage of demand that cannot be fulfilled immediately and must wait for future stock.
Business value: Backorders indicate service pressure and often reveal planning or replenishment issues not fully visible in stockout metrics alone.
AI use: Dora can monitor backorder patterns, identify concentration by product or location, and send threshold-based alerts to owners.
Together, these 12 KPIs create a complete weekly operating picture. They connect forecast quality, service performance, inventory efficiency, control policy, and financial impact in one governed view.
How demand forecasting drives smarter inventory decisions
Demand forecasts matter because they influence action, not because they exist in a spreadsheet. The weekly dashboard should help Operations Directors translate forecast outputs into concrete inventory choices.
Here is how demand signals should shape decisions:
- Purchasing: If forecasted demand rises for a product family with stable lead times, purchasing can bring orders forward before shortages appear.
- Production planning: If weekly demand changes for finished goods or components, production schedules can be rebalanced to avoid bottlenecks or excess work-in-process.
- Allocation: If one location is likely to stock out while another is over-covered, inventory can be repositioned more intelligently.
- Replenishment timing: Updated short-term demand forecasts should influence order timing, not just order quantity.
- SKU prioritization: High-value or service-critical SKUs may require closer review and tighter thresholds than long-tail items.
Weekly KPI trends should lead to actions such as:
- revising reorder points for volatile SKUs
- increasing safety stock where lead time variability has risen
- reducing buys for categories showing consistent over-forecasting
- escalating supplier performance issues that threaten availability
- prioritizing root-cause review for high-backorder, high-margin products
This is where a standard dashboard often falls short. It shows what happened but leaves the user to interpret next steps manually. FineBI creates the trusted BI structure for this analysis. Dora extends that structure into a governed AI workflow that can answer questions, summarize exceptions, push alerts, and support follow-up across the business.
Demand forecasting vs. inventory forecasting
These two concepts are related, but they are not the same.
Demand forecasting predicts what customers or internal demand drivers are likely to require in the future. It focuses on expected consumption by product, location, and time.
Inventory forecasting predicts what stock position will be needed or available to support that demand. It includes incoming supply, current on-hand stock, replenishment timing, and inventory policy.
Why the distinction matters:
- If teams confuse demand with inventory, they may treat current stock levels as evidence that demand is healthy.
- They may also use the wrong KPI to diagnose the wrong problem.
- A weak service level might come from poor forecast demand signals, poor inventory policy, or delayed supply execution. Those are different issues.
Simple examples help clarify the difference:
- When to focus on demand forecasting: A seasonal promotion is approaching, and the team needs to estimate likely customer demand by region and channel.
- When to focus on inventory forecasting: The forecast already shows higher demand, and now the team must calculate whether current stock, in-transit supply, and reorder timing are sufficient.
An Operations Director’s dashboard should represent both correctly. Demand metrics tell you what the business expects to consume. Inventory metrics tell you whether the business is prepared to serve it.
How an AI Data Agent Handles This Scenario
In many operations teams, the weekly review still depends on analysts pulling reports, planners exporting spreadsheets, and directors asking follow-up questions in meetings after the reporting window has already passed. That process is slow, inconsistent, and hard to scale across locations and SKU groups.
This is where Dora works as an enterprise Data Agent on top of FineBI’s trusted BI foundation. For this scenario, the most relevant digital employees are:
- Data Analyst digital employee for natural-language data query, dashboard retrieval, and follow-up analysis
- Daily Briefing Secretary for scheduled weekly KPI summaries before the operations meeting
- Risk Alert Officer for exception monitoring, anomaly detection, and owner notification
A scenario-specific chat example might be:
“Show me this week’s demand forecasting and inventory management performance by category, including forecast accuracy, stockout rate, days of inventory on hand, and the top SKUs at risk due to lead time variability.”
Dora then handles the workflow through a governed AI process rather than an uncontrolled prompt chain:
- Retrieve trusted FineBI assets such as the weekly operations dashboard, semantic model, and approved KPI definitions for forecast accuracy, fill rate, DOH, and backorder rate.
- Understand business meaning including metric definitions, SKU hierarchies, filters, date windows, target thresholds, and permission rules.
- Generate a chart-based answer or dashboard-style analysis view in chat, such as category performance, trend comparisons, and exception tables.
- Detect anomalies or breaches such as sudden forecast bias in a category, rising lead time variability, or service metrics dropping below target.
- Push alerts or summaries to responsible owners, such as planners, procurement leads, or warehouse managers, with the relevant KPI context.
- Support follow-up execution by producing a meeting summary, highlighting unresolved risks, and preparing the next weekly briefing.
This is a practical example of Agentic BI. FineBI remains the BI foundation that provides governed dashboards, trusted metrics, visual exploration, and semantic assets. Dora turns that foundation into a scenario-specific AI assistant that helps operations users ask, analyze, generate, push, alert, and follow up.
That matters for enterprise adoption. Operations teams do not need a generic chatbot. They need a governed AI workflow that can:
- query trusted KPI assets in natural language
- respect permissions and semantic rules
- return controlled, auditable outputs
- generate scheduled summaries and exception pushes
- reduce the manual effort of repeated weekly reporting work
Compared with raw prompt-only agents, this skills-based execution model is more controllable for enterprise scenarios. It is designed for stronger workflow stability, better landing capability, and stronger fit with permissions, KPI governance, semantic rules, and data quality requirements.
A typical weekly scenario could look like this:
- On Monday morning, the Daily Briefing Secretary pushes a summary of the 12 KPIs to the Operations Director.
- During the review, the director asks Dora for a category-level breakdown of forecast bias and backorder risk.
- Dora retrieves the FineBI dashboard assets, returns a chart-based answer, and highlights three supplier-driven risk areas.
- The Risk Alert Officer then pushes threshold alerts to procurement and inventory owners.
- After the meeting, Dora produces a follow-up summary of key risks, owners, and unresolved exceptions.
That is the shift from “people looking at dashboards” to “AI helping people work through the dashboard scenario.”
Best practices to strengthen the dashboard over time
A good dashboard should not remain static. As demand patterns, supply constraints, and operating priorities change, the dashboard and its AI workflows should evolve as well.
Use the right forecasting techniques for different demand patterns
Not every SKU should use the same forecasting logic.
- Stable items may work well with moving averages or smoothing methods.
- Seasonal items need seasonality analysis and period-aware comparisons.
- Fast-changing or promotion-sensitive items may require trend-based models and scenario planning.
- Low-volume or intermittent-demand SKUs may need special handling to avoid distorted averages.
The dashboard should segment these demand types so that forecast performance is interpreted fairly and inventory rules are updated appropriately.
Improve data quality and cross-functional ownership
Forecasting and inventory dashboards only work when teams trust the data.
Operations, sales, procurement, and finance should align on:
- SKU and location master data
- shared KPI definitions
- standard time windows
- approved forecast versions
- exception thresholds
- review ownership
Treat data quality as part of the AI implementation, not a separate cleanup project. Dora can only produce reliable chart-based answers and summaries if FineBI is built on governed, trusted data and metrics.
Build a semantic layer inside the BI workflow
This is one of the most important foundations for scalable AI use.
Use FineBI to standardize:
- KPI definitions and formulas
- business terms and synonyms
- hierarchy logic
- filter rules
- drill paths
- metric ownership
That semantic layer gives Dora the trusted context it needs to answer natural-language questions accurately and consistently across teams.
Start with high-value recurring workflows
Do not try to automate every supply chain decision at once.
A better approach is to start with recurring weekly workflows such as:
- operations briefing preparation
- forecast exception review
- stockout risk monitoring
- backorder summary generation
- aging inventory exception pushes
These use cases are easier to govern, easier to validate, and more likely to deliver adoption.
Preserve governance and human review
AI outputs should respect FineBI access boundaries and enterprise governance rules.
Best practice includes:
- keeping permission governance intact
- defining alert thresholds and escalation paths
- reviewing AI-generated summaries before wider distribution at early rollout stages
- gradually expanding Dora Skills as trust and process maturity improve
This is how enterprises make AI useful in operations: governed, repeatable, and tied to clear business processes.
FineBI + Dora solution pitch
Building this manually is complex. FineBI helps teams build trusted dashboards, metrics, and semantic assets. Dora turns those assets into an AI assistant that can answer questions in chat, generate dashboard-style analysis views, push scheduled summaries, monitor anomalies, and follow up with responsible owners.
For an Operations Director working on demand forecasting and inventory management, this combination is practical because it matches how operations actually runs:
- FineBI provides the weekly dashboard foundation
- Dora adds natural-language access to trusted BI assets
- Dora can generate chart-based answers for meeting questions
- Dora can act as a Daily Briefing Secretary for weekly KPI summaries
- Dora can work as a Risk Alert Officer for stock, lead time, or service exceptions
- IT can govern the semantic layer, permissions, data quality, and reusable Skills without rebuilding every question manually
This also changes the role of IT in the AI era. Instead of manually answering every reporting request, IT teams can focus on enterprise data connections, semantic layers, KPI governance, data quality, permission control, and reusable Data Agent workflows. That is a more scalable operating model than one-off dashboards or uncontrolled prompting.
For business users, the value is lower friction. They do not need to hunt through multiple reports, wait for analyst support, or translate every question into technical language. They can ask for the metric, trend, exception, or breakdown they need and receive a governed answer grounded in FineBI’s trusted semantic assets.
For executives, the value is concrete. Dora is not an AI experiment. It is a landed digital employee for recurring data work such as weekly operations briefing, inventory risk follow-up, service-level review, and demand exception escalation.
FineBI + Dora is not only a BI upgrade; it is a practical fourth-generation Agentic BI path. FineBI provides governed metrics and visual analysis. Dora provides the AI assistant layer for scenario execution, with more controlled Skills, lower token waste, faster execution paths, and more stable workflows than prompt-only agents.

Get Ready-to-Use Dashboard Templates in Fine Gallery
The strongest Dora pitch is scenario + product + service: FineBI provides the trusted BI foundation, Dora provides the AI digital employee, and implementation service connects data, governance, semantic setup, Skills, and rollout.
For organizations that want to make weekly operations reviews faster, more consistent, and more actionable, that combination is what turns dashboard visibility into actual execution.
FAQs
Demand forecasting estimates future customer demand by product, location, and time period. Inventory forecasting uses that demand signal to decide how much stock to buy, produce, or replenish and when it should be available.