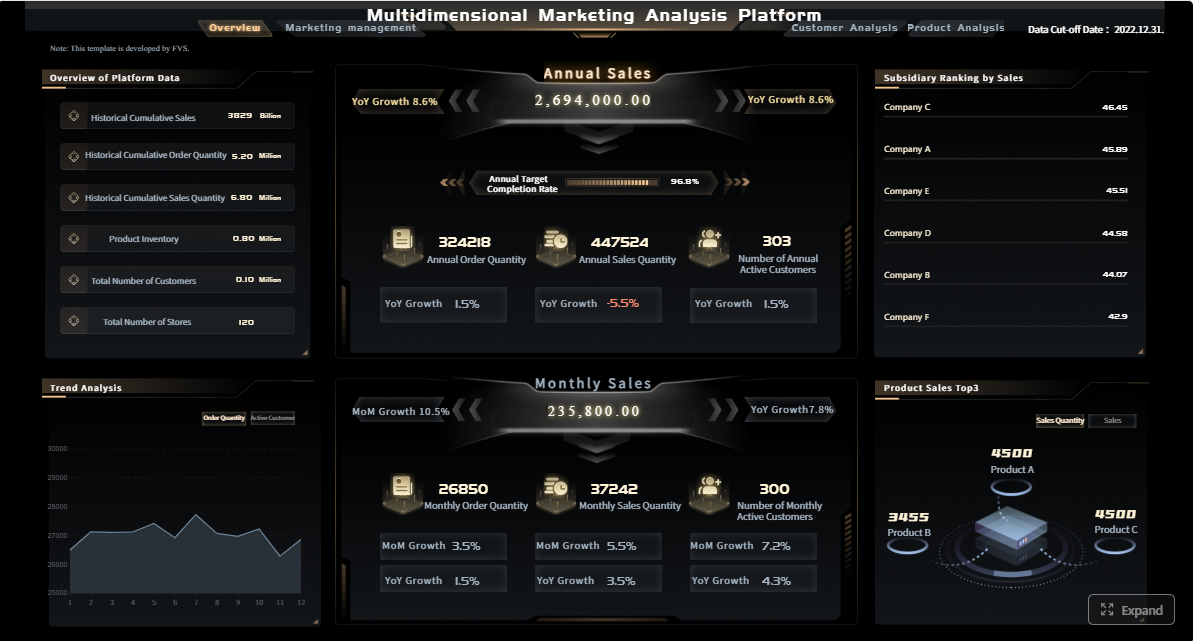
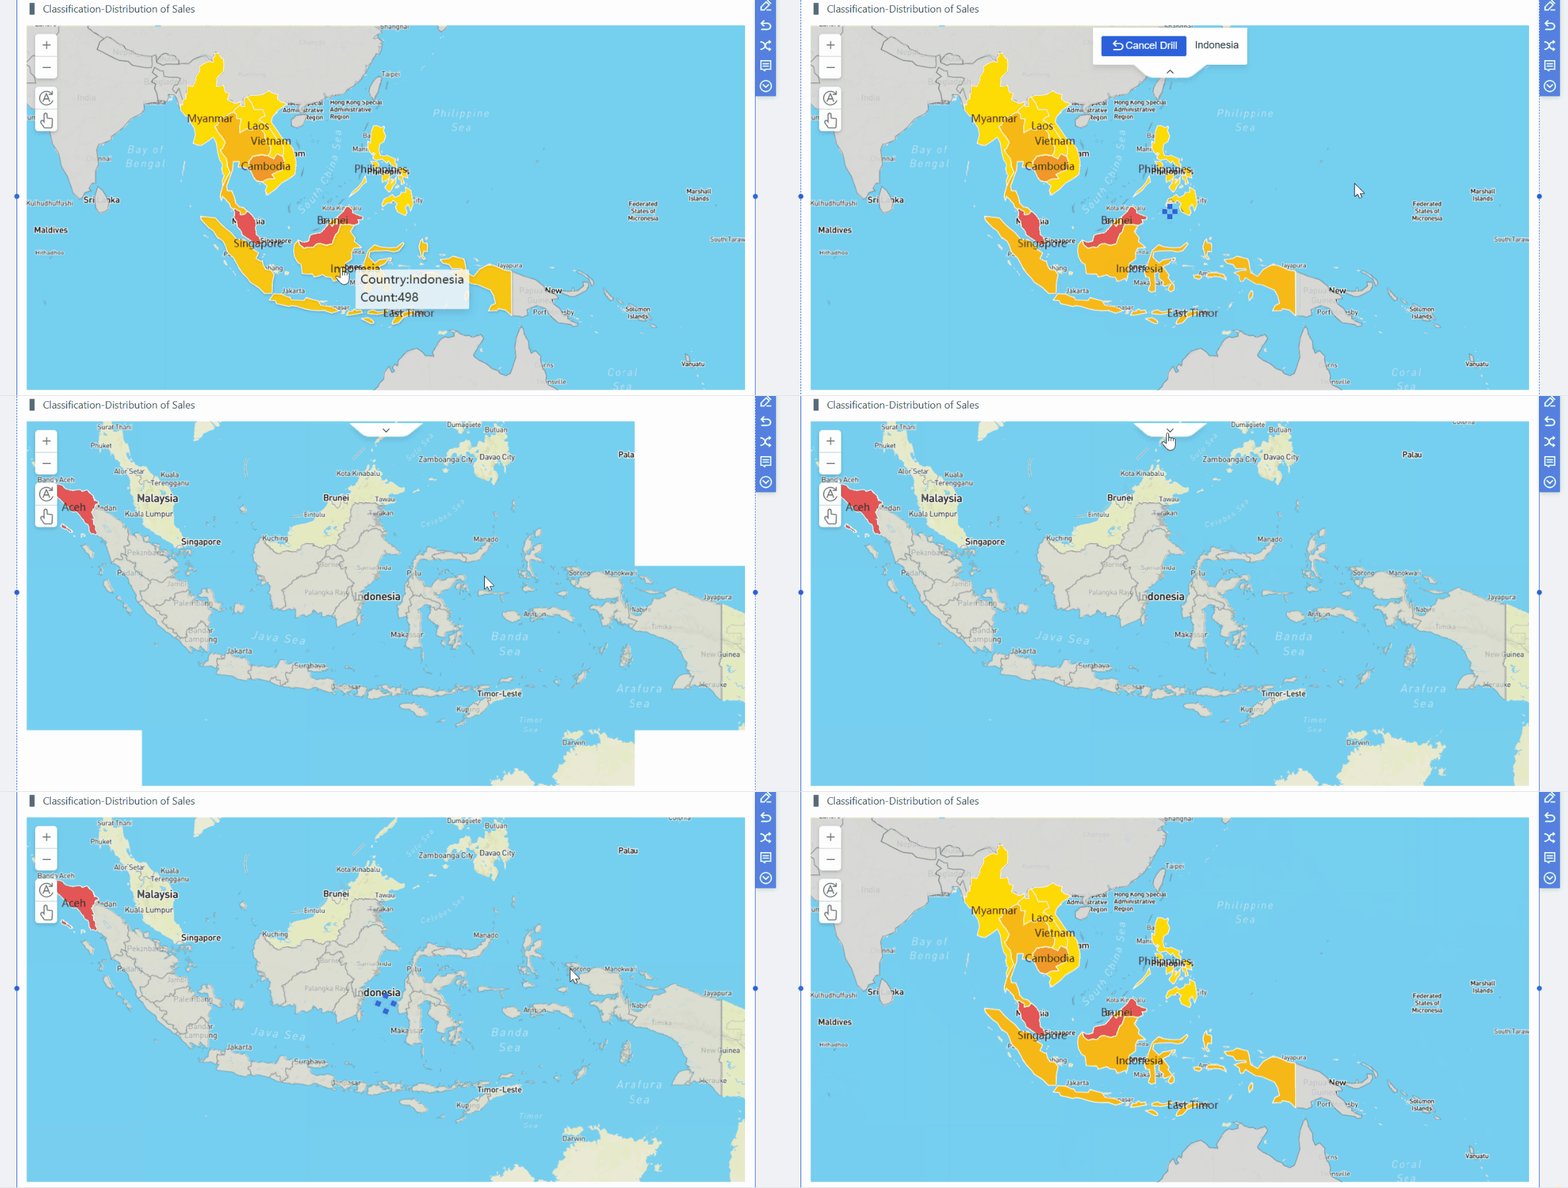
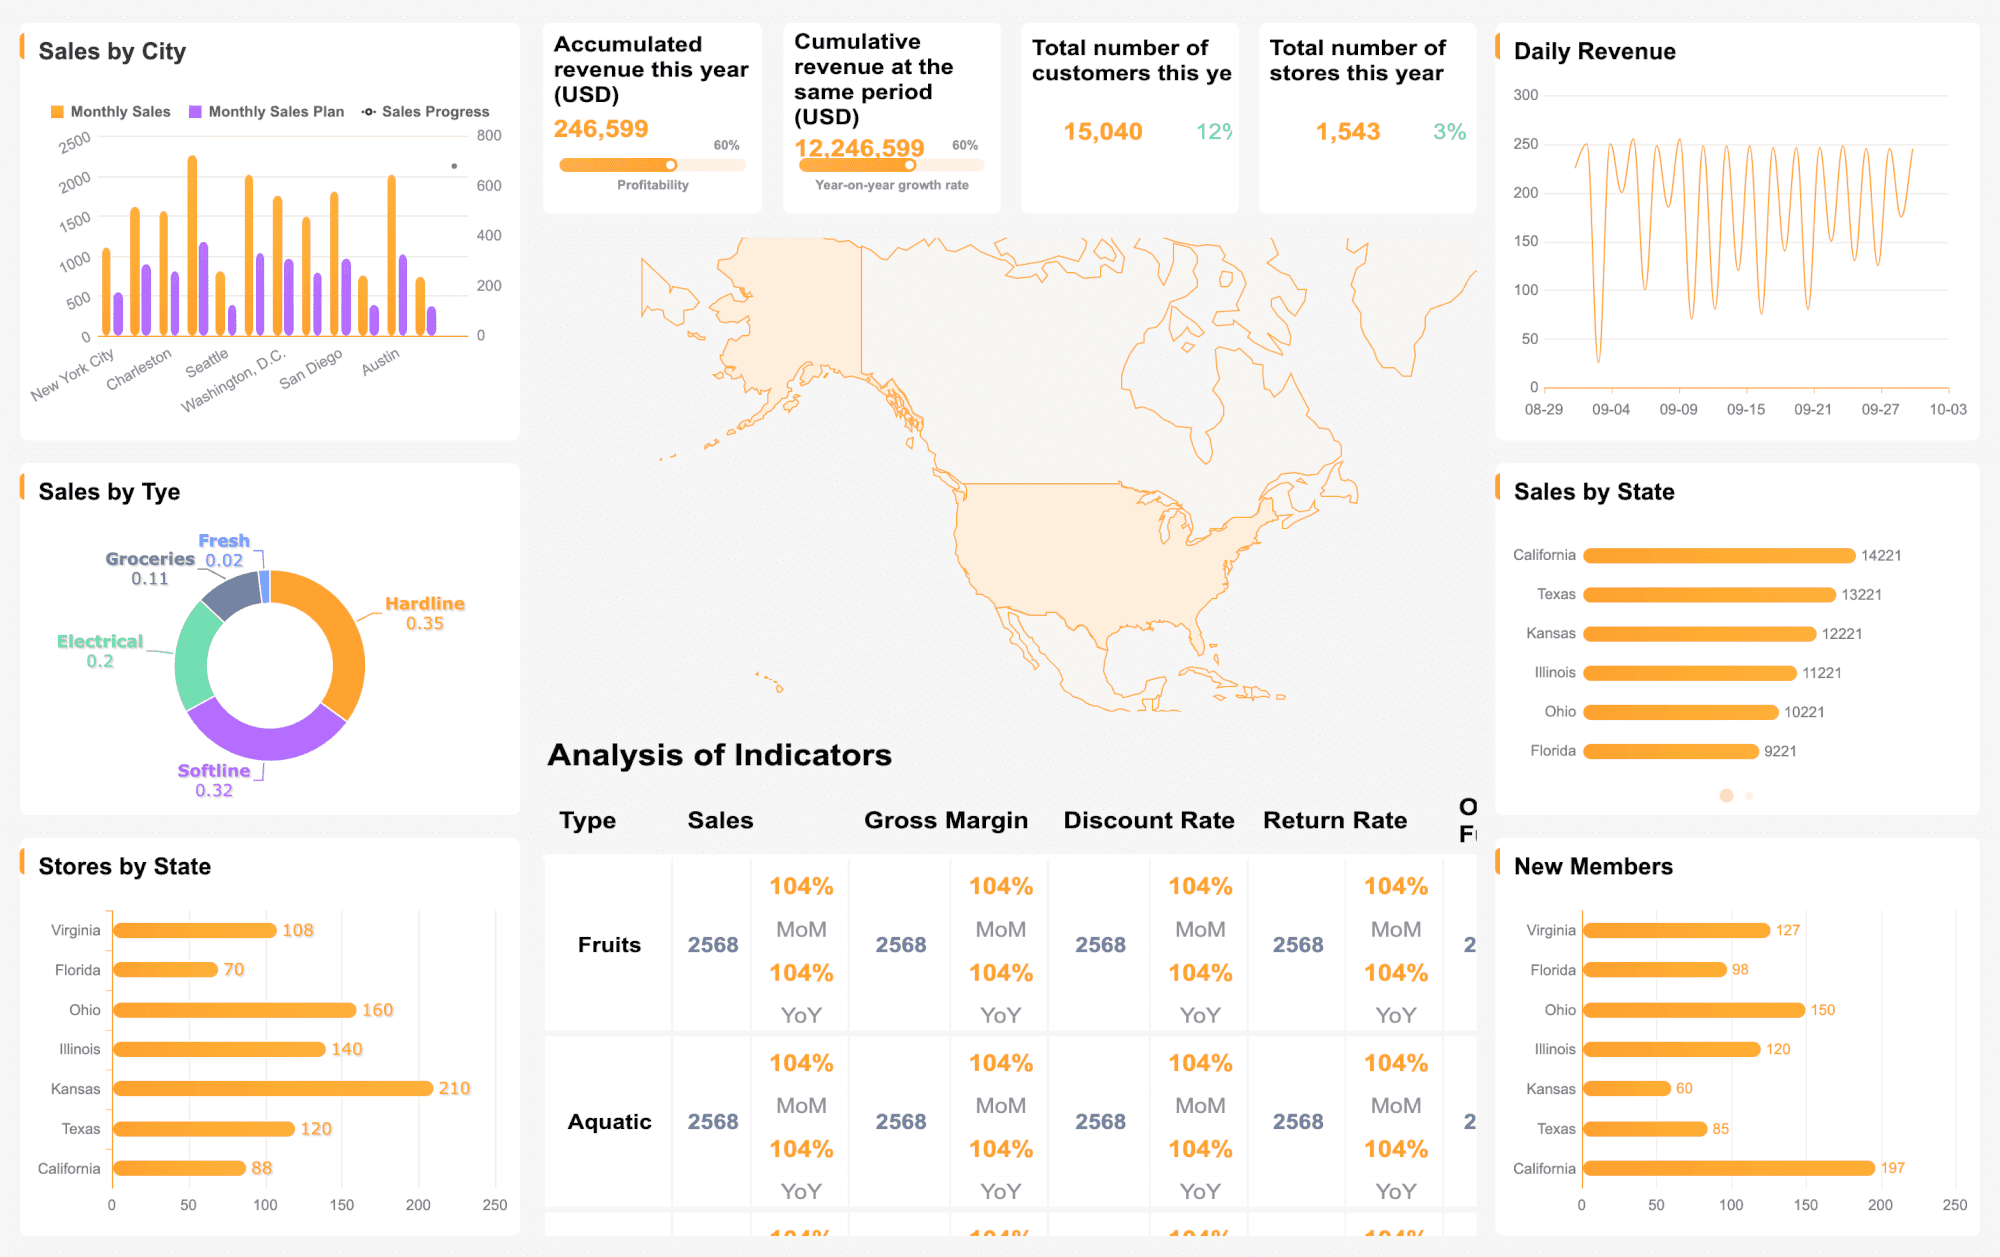
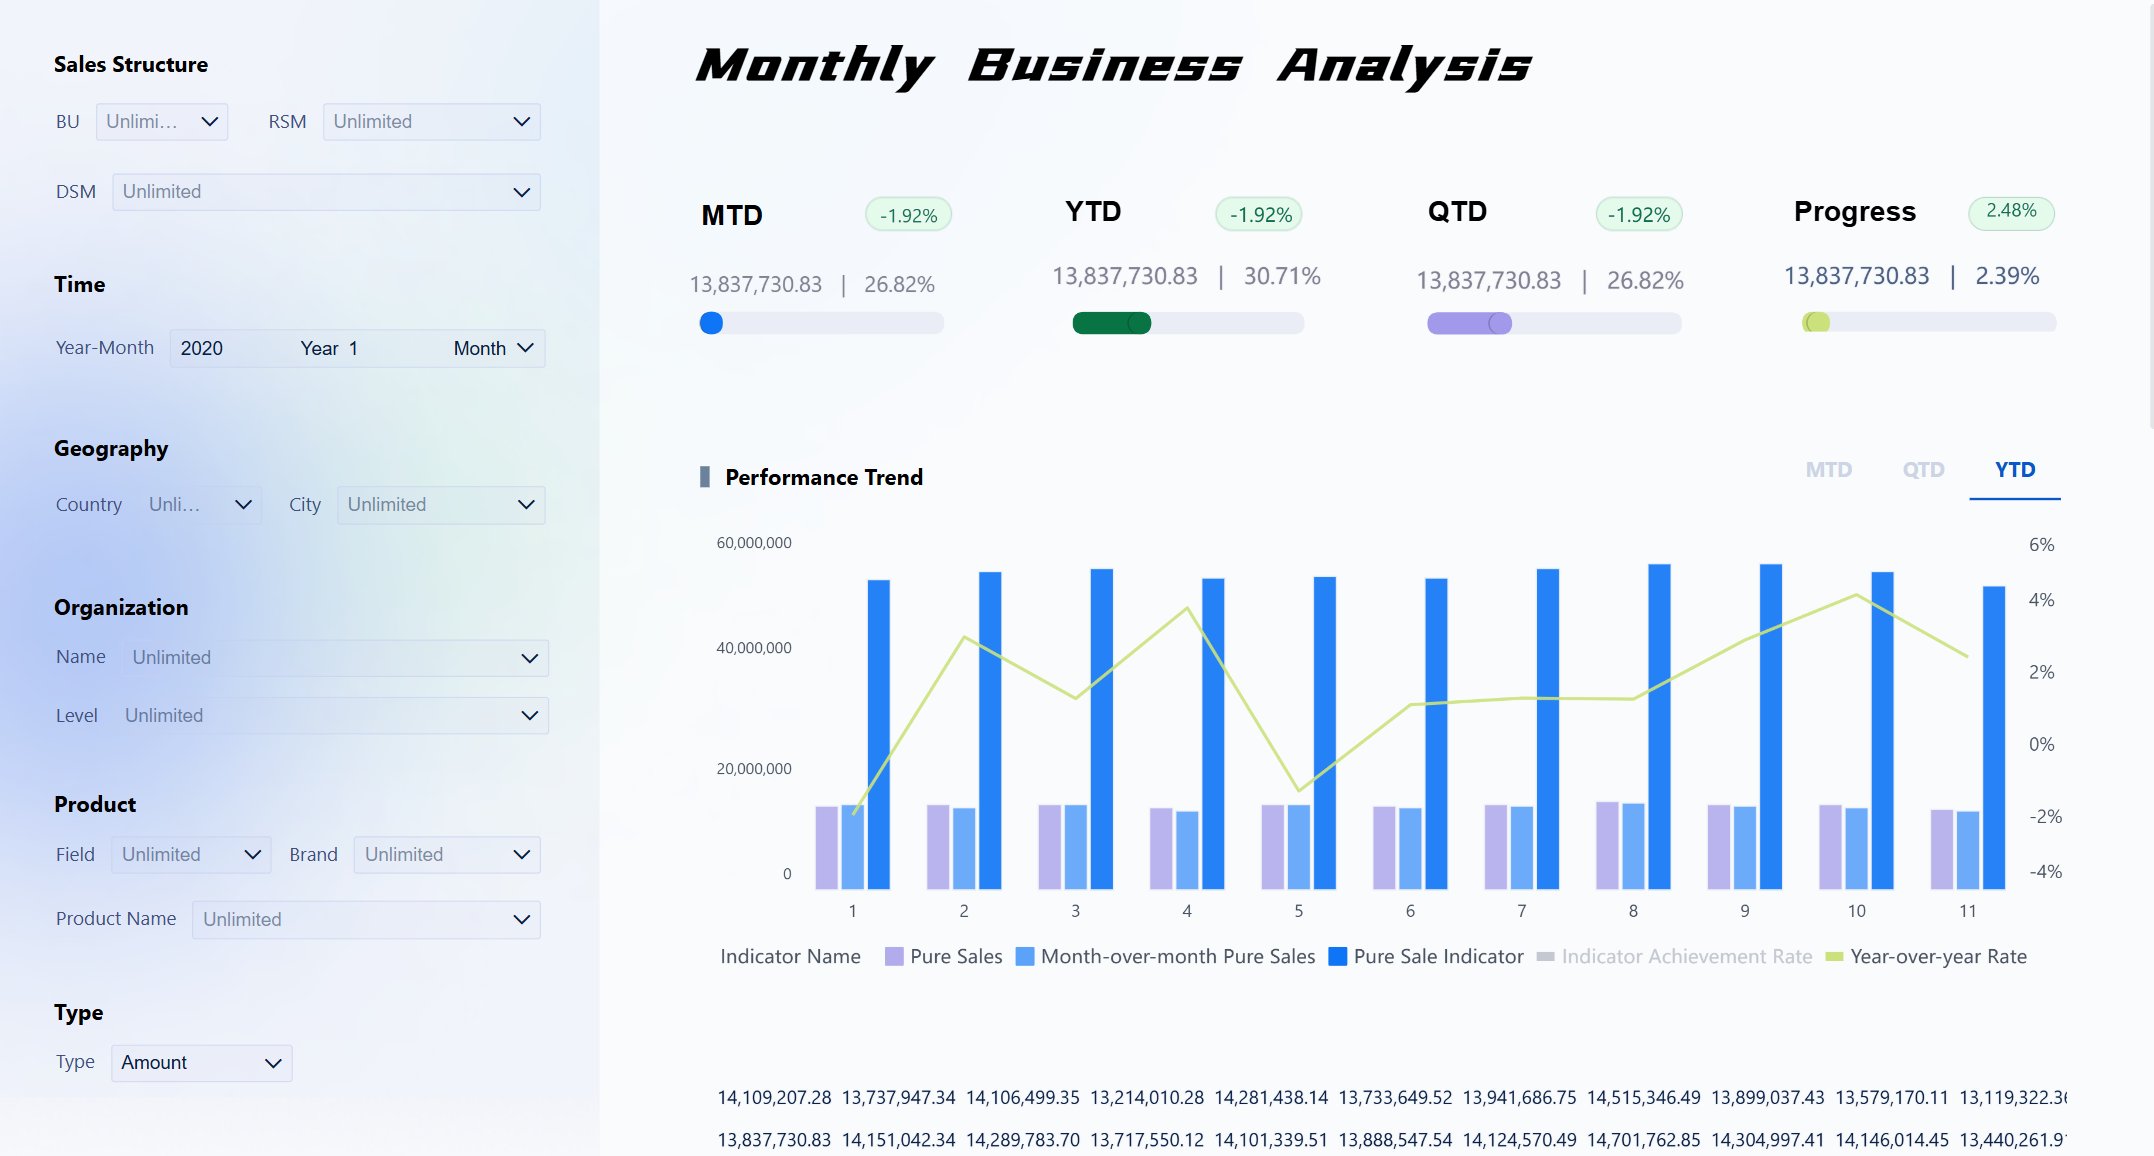
A CMO dashboard is not a prettier marketing report. It is a leadership tool built to help CMOs, VP Marketing teams, growth leaders, and revenue stakeholders answer one question fast: is marketing driving efficient business growth, and where should we act next? If your current reporting is fragmented across ad platforms, CRM exports, web analytics, and spreadsheets, you are likely spending too much time reconciling numbers and not enough time making decisions. A strong dashboard solves that by connecting marketing activity to pipeline, revenue, retention, and budget performance in one executive-ready view.
All dashboards in this article are built with FineBI.
A CMO dashboard is a high-level performance system designed for executive decision-making. Unlike a channel dashboard that tracks paid media, email, SEO, or social metrics in isolation, a CMO view consolidates the metrics that matter most to leadership: growth, efficiency, conversion, retention, and strategic risk.
At this level, the dashboard should not focus on campaign trivia. It should show whether marketing is creating measurable business outcomes, where momentum is improving or slowing, and which issues need intervention from leadership.
A useful dashboard helps marketing leaders do three things better:
Align teams around business goals rather than isolated channel targets
Spot risks early such as rising acquisition cost, slowing pipeline, or retention decline
Communicate clearly to executives in the language of revenue, efficiency, and forecast confidence
The most important distinction is this:
Monitoring activity means tracking what marketing did, such as sends, clicks, impressions, and spend
Measuring outcomes means tracking what those activities produced, such as MQLs, opportunities, and conversions
Proving business impact means tying marketing to pipeline, revenue, retention, and profitability
Too many dashboards stop at activity. Executive dashboards must go further.
The core structure of a CMO dashboard
The best CMO dashboards are organized so leaders can move from summary to diagnosis in seconds. A practical structure is to group metrics across three dimensions:
Business goal: growth, efficiency, retention, brand strength
Time horizon: current week, month-to-date, quarter-to-date, trailing 12 months
This structure makes it easier to answer both short-term and strategic questions. For example, a traffic spike may look positive in a weekly view, but if lead-to-opportunity conversion is dropping over the quarter, the executive takeaway changes entirely.
An executive summary should include only the metrics required to make leadership decisions quickly. A deeper drill-down report can then support channel managers and operations teams with segmentation by campaign, geography, product line, audience, or source.
Comparability: include prior period, target, and benchmark views
Context: explain why a metric changed
Accountability: connect each KPI to an owner or decision area
Key Metrics (KPIs) every CMO dashboard structure should support
Before selecting the final 20 KPIs, make sure your dashboard can consistently display these core elements:
Actuals: the current measured result
Target: the planned performance level
Trend: direction over time
Variance: gap between actual and target
Benchmark: comparison against peer, historical, or internal standard
Budget context: spend, pacing, and efficiency by period
Owner: team or function responsible for action
Segment filter: by channel, product, region, audience, or campaign
How to build a dashboard that justifies marketing spend
If the dashboard cannot help you defend, reallocate, or increase budget, it is not executive-grade. To justify spend, every metric should connect to one of four outcomes:
Revenue
Efficiency
Pipeline quality
Strategic growth
That means reporting should not stop at spend, clicks, or lead counts. It should show whether spend is turning into qualified demand, how fast that demand converts, and whether acquired customers retain and expand.
To support faster executive decisions, present metrics with:
Trend lines to show momentum
Targets to define expected performance
Benchmarks to indicate competitiveness
Budget context to reveal efficiency and pacing
A practical executive layout often follows this order:
Pipeline slowdown, CAC inflation, conversion decline, share of voice loss
20 KPIs every marketing leader should track in a CMO dashboard
Below are the 20 KPIs that belong on most executive-level marketing dashboards. You may adjust weighting by business model, but these measures give leadership a balanced view of growth, efficiency, customer value, and market position.
Revenue and pipeline KPIs
1. Marketing-sourced revenue
Revenue from deals originated by marketing efforts. This is one of the clearest indicators of direct marketing contribution to growth.
2. Marketing-influenced revenue
Revenue from deals where marketing meaningfully impacted the buyer journey, even if the opportunity was not originally sourced by marketing. Useful for understanding broader contribution across long sales cycles.
3. Pipeline generated by marketing
The total value of opportunities created from marketing programs. This metric helps leadership assess whether demand generation is producing enough future revenue coverage.
4. Pipeline velocity
The speed at which opportunities move through the pipeline toward close. Slow velocity often signals handoff friction, poor qualification, or weak follow-up.
5. Customer acquisition cost
The total cost required to acquire a new customer. A critical efficiency metric that should be monitored by channel, segment, and time period.
Demand generation and funnel KPIs
6. Lead volume
The total number of inbound or captured leads. This is useful only when paired with quality and conversion metrics.
7. Marketing qualified leads
Leads that meet agreed marketing qualification criteria. MQL quality matters more than raw count.
8. Sales accepted leads
Qualified leads that sales has reviewed and accepted for follow-up. This is a strong alignment metric between marketing and sales.
9. Lead-to-opportunity conversion rate
The percentage of leads that become sales opportunities. This shows whether demand quality and qualification rules are effective.
10. Opportunity-to-customer conversion rate
The percentage of opportunities that close into customers. This helps marketing leaders evaluate downstream quality, not just top-of-funnel output.
Retention and customer value KPIs
11. Customer lifetime value
Projected total revenue or margin generated by a customer over the relationship. This metric is essential for judging whether acquisition economics are sustainable.
12. Retention rate
The percentage of customers retained over a defined period. Strong retention often reflects better targeting, fit, and lifecycle marketing effectiveness.
13. Churn rate
The percentage of customers or revenue lost in a period. Rising churn can quickly erase gains from new acquisition.
14. Expansion revenue
Revenue generated from upsell, cross-sell, or account growth. Important for subscription and account-based growth models.
15. Net revenue retention
Revenue retained from existing customers after accounting for churn and expansion. For recurring-revenue businesses, this is one of the most important executive metrics.
Brand, engagement, and efficiency KPIs
16. Share of voice
Your visibility relative to competitors across relevant channels or market conversations. A valuable leading indicator of future demand and brand strength.
17. Website conversion rate
The percentage of website visitors who complete a desired action, such as form submission, demo request, or purchase. A core indicator of digital effectiveness.
18. Paid media return on ad spend
Revenue generated per dollar of paid media spend. This helps leaders evaluate paid efficiency, but should be viewed alongside pipeline quality and attribution logic.
19. Content engagement rate
A measure of how actively audiences consume and interact with content. This may include time on page, downloads, scroll depth, shares, or repeat visits depending on the content model.
20. Marketing spend as a percentage of revenue
Total marketing investment relative to company revenue. A useful executive metric for budget control, board communication, and trend analysis.
KPI definitions in one scannable list
For teams building a new CMO dashboard, here is the featured-snippet version:
Marketing-sourced revenue: Revenue from deals originated by marketing
Marketing-influenced revenue: Revenue where marketing impacted the deal path
Pipeline generated by marketing: Opportunity value created by marketing
Pipeline velocity: Speed of movement from opportunity to close
Customer acquisition cost: Cost to win one new customer
Lead volume: Total leads captured
Marketing qualified leads: Leads that meet marketing qualification rules
Sales accepted leads: Qualified leads accepted by sales
Lead-to-opportunity conversion rate: Share of leads that become opportunities
Opportunity-to-customer conversion rate: Share of opportunities that close
Customer lifetime value: Total expected customer value over time
Retention rate: Percentage of customers retained
Churn rate: Percentage of customers or revenue lost
Expansion revenue: Revenue growth from existing customers
Net revenue retention: Existing customer revenue after churn and expansion
Share of voice: Brand visibility relative to competitors
Website conversion rate: Share of visitors who convert
Paid media return on ad spend: Revenue generated from paid spend
Content engagement rate: Strength of audience interaction with content
Marketing spend as a percentage of revenue: Budget level relative to business size
CMO dashboard examples by business model
A strong CMO dashboard should not look identical across every company. The right design depends on sales cycle length, revenue model, and go-to-market motion.
For example:
SaaS companies need stronger retention, expansion, and recurring revenue visibility
B2B companies usually need deeper pipeline quality and sales alignment metrics
Multi-channel growth teams often prioritize acquisition efficiency, attribution, and website conversion patterns
If your team has a long sales cycle, emphasize influenced pipeline, sales acceptance, and velocity. If you operate a recurring revenue model, churn, retention, and expansion deserve top placement. If you run a high-volume digital motion, conversion rate, CAC, and ROAS likely need tighter weekly monitoring.
SaaS dashboard priorities
For SaaS leaders, the dashboard should emphasize durable growth over short-term lead counts. Priority metrics typically include:
Net revenue retention
Churn rate
Expansion revenue
Customer lifetime value
Customer acquisition cost
Pipeline generated
Pipeline velocity
It is also useful to combine product and lifecycle signals with core marketing KPIs. For example, activation rate, product usage frequency, and onboarding completion can explain why some acquisition channels produce stronger retention than others.
Executive dashboard example layout
A practical executive layout should include four sections:
Tips for building a better CMO dashboard and avoiding common mistakes
Most dashboards fail for one of two reasons: they collect too much data, or they answer too few executive questions. The solution is disciplined design.
Best practices for implementation
1. Start with executive decisions, not available data
List the questions leadership needs answered first. Examples include:
Is marketing on track to hit pipeline goals?
Which channels are becoming less efficient?
Are we acquiring customers that retain and expand?
Only then choose metrics.
2. Standardize metric definitions across teams
If marketing, sales, and finance define pipeline, sourced revenue, or CAC differently, your dashboard will create disputes instead of trust. Build shared definitions early.
3. Use one summary layer and one diagnostic layer
Do not overload the executive page. Keep the summary simple, then allow drill-down into channel, campaign, segment, or region performance as needed.
4. Add context to every number
A metric without a target or trend is just a number. Show:
current value
prior period
target
variance
benchmark where possible
5. Review the dashboard quarterly
As strategy, budget, and market conditions evolve, your dashboard should evolve too. Remove stale metrics. Add leading indicators where risk is rising.
The biggest mistakes to avoid are:
Tracking vanity metrics that do not influence decisions
Mixing operational detail into the executive summary
Ignoring retention and customer value
Failing to reconcile definitions across systems
Building static reports that cannot be filtered or explored
A modern BI platform helps solve many of these issues by centralizing data, enforcing consistent logic, and allowing both summary and drill-down analysis in one environment. FineBI is especially useful here because marketing leaders can combine CRM, web, ad, and finance data into a unified view without relying on endless manual spreadsheet updates.
Get Ready-to-Use Dashboard Templates in Fine Gallery
Final takeaway: a CMO dashboard should drive decisions, not just reporting
The best CMO dashboard does not try to show everything. It shows the few measures that matter most to leadership and connects them directly to growth, efficiency, and strategic risk. If you build your dashboard around the 20 KPIs above, organize them by business goal and funnel stage, and add targets, trends, and accountability, you will give executives a tool they can actually use.
The real benchmark is simple: can your dashboard help justify marketing spend, reveal where action is needed, and strengthen confidence in marketing as a growth engine? If the answer is yes, you have built the right system.
A strong CMO dashboard should include revenue, pipeline, customer acquisition cost, return on ad spend, conversion rates, retention, and budget pacing. It should also show targets, trends, and variance so leaders can act quickly.
A CMO dashboard is built for executive decision-making, while a general marketing dashboard often focuses on channel or campaign activity. The CMO view connects marketing performance to business outcomes like pipeline, revenue, and efficiency.
The most important KPIs are usually marketing-sourced pipeline, revenue contribution, CAC, LTV to CAC ratio, ROI or ROAS, and retention. These metrics help show whether marketing spend is creating sustainable growth.
The dashboard should refresh as close to real time as possible for fast decisions, especially when budget or pipeline is shifting quickly. Most executive reviews still happen weekly, monthly, or quarterly depending on the reporting rhythm.
It helps justify budget by linking spend directly to revenue, pipeline quality, efficiency, and long-term customer value. When leaders can see results against targets and trends in one place, budget decisions become easier to defend.
Product Trial
FineReport
Pixel-perfect reports · Interactive dashboards · Easy data entry · Digital twins