A budget vs actual dashboard gives you a clear view of business spending, linking planned budgets to real financial activity. Many teams rely on manual tools, but these create big challenges:
Pain Point
Impact
Poor Spend Visibility
43% of finance teams struggle to track spending
Time Drain for Controllers/CFOs
10+ hours weekly lost on manual tasks
Human Error in Data Entry
Leads to costly mistakes
You need real-time insight to guide business management. FineReport by FanRuan connects your budget plans with live business data, helping you spot issues fast and make better decisions for your business.
What Is a Budget vs Actual Dashboard?
Core Purpose and Financial Impact
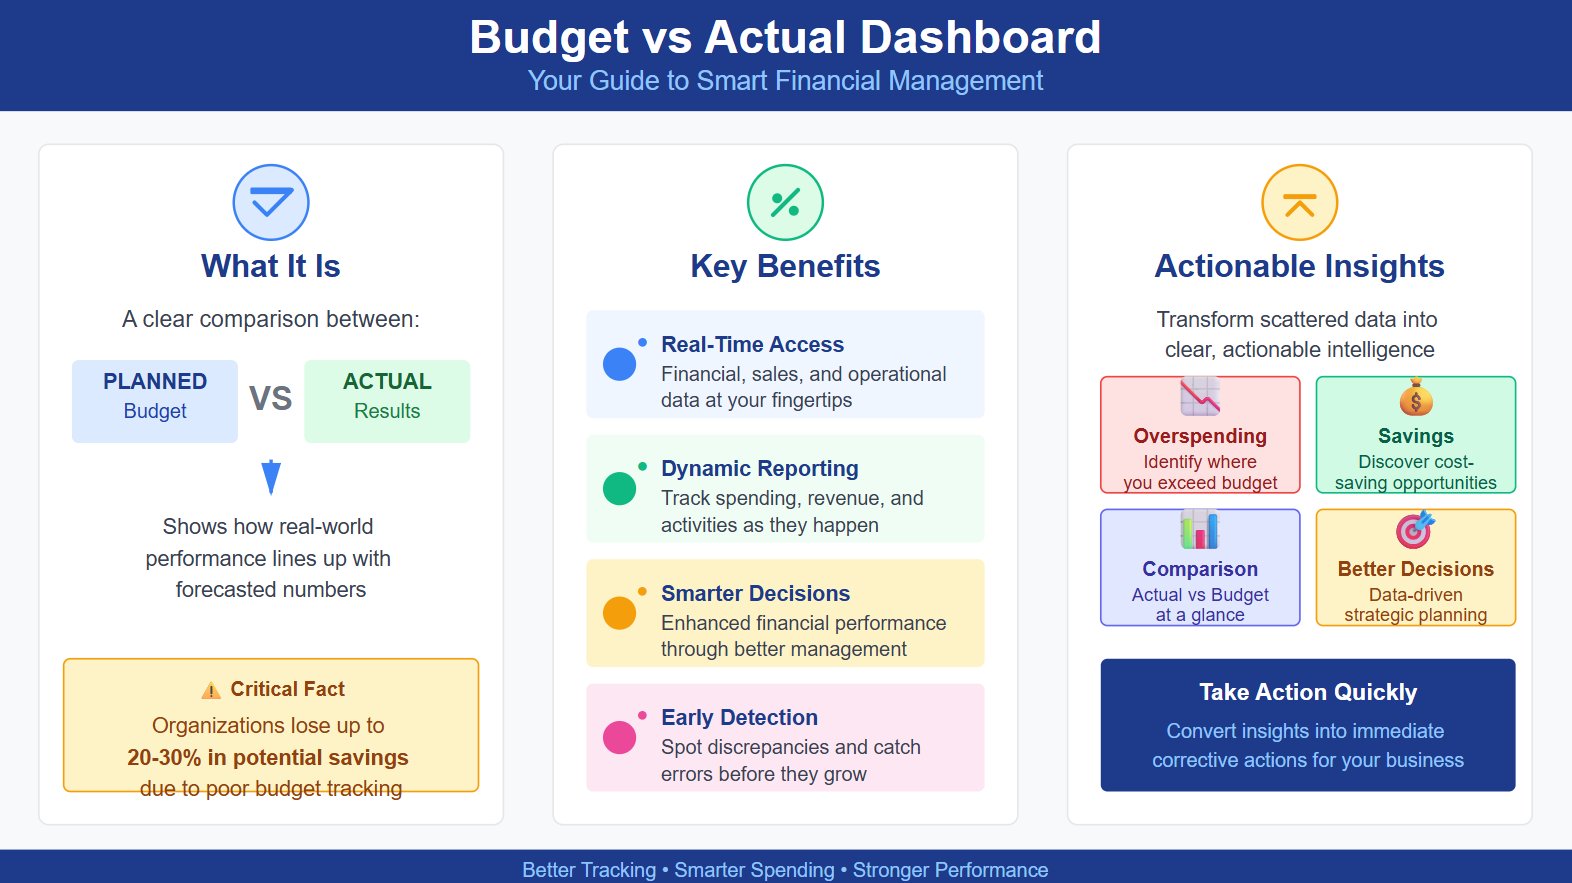
A budget vs actual dashboard gives you a clear comparison between what you planned to spend and what you actually spent. You see how your business performance matches your forecasted numbers. This tool helps you understand where your money goes and how well you stick to your budget.
A budget vs. actual report compares what you planned to happen financially (your budget) and what happened (the actuals). It shows you how your real-world performance lined up with your forecasted numbers.
When you use a budget vs actual dashboard, you gain real-time access to financial, sales, and operational data. You can track spending, revenue, and other business activities as they happen. This dynamic reporting leads to smarter decisions and stronger financial performance.
Provides real-time access to extensive financial, sales, and operational data.
Leads to smarter decisions and enhanced financial performance.
The dashboard also helps you spot discrepancies early. You can catch errors before they become bigger problems. Many organizations lose up to 30% in potential savings because they do not track their budget closely. With a budget vs actual dashboard, you can identify issues and take action quickly.
Evidence Type
Description
Financial Performance Management
Budget vs. actual dashboards compare planned financial targets against actual results, helping identify discrepancies early.
Cost Savings
Organizations lose 20-30% in potential savings due to poor budget tracking, highlighting the importance of effective variance analysis.
Actionable Insights
Modern budget tracking systems convert scattered financial data into insights, allowing for early identification of discrepancies.
You can use the dashboard to improve your analysis. It turns scattered financial data into clear insights. You see where you overspend, where you save, and how your actual results compare to your budget. This helps you make better decisions for your business.
Why Real-Time Visibility Matters
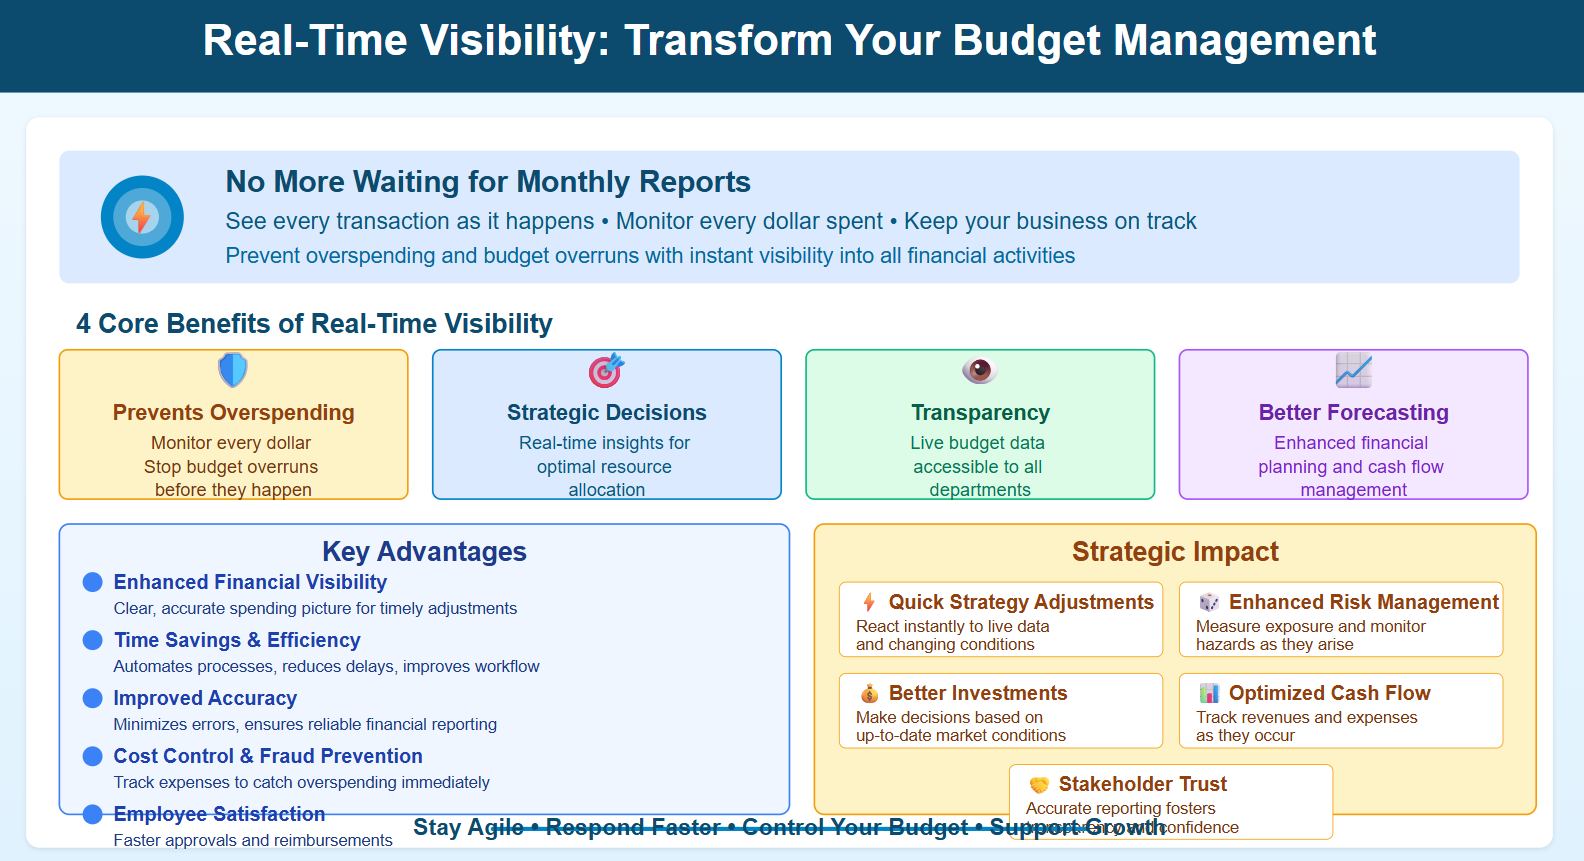
Real-time visibility changes how you manage your budget. You do not have to wait for monthly reports or manual updates. You see every transaction as it happens. This helps you prevent overspending and budget overruns. You monitor every dollar spent and keep your business on track.
Prevents overspending and budget overruns by ensuring every dollar spent is monitored.
Enhances strategic decision-making with real-time insights for resource allocation.
Boosts transparency and accountability by providing live budget data to all departments.
Improves forecasting and financial planning for better cash flow management.
Real-time visibility empowers you to make informed decisions instantly. You optimize cash flow by tracking revenues and expenses as they occur. You reduce manual data entry and reconciliation. You also improve risk management by monitoring financial activities continuously.
Benefit
Description
Enhanced financial visibility
Provides a clear, accurate picture of spending, allowing for timely adjustments and better forecasting.
Time savings and efficiency
Automates manual processes, reducing delays and improving workflow efficiency.
Improved accuracy
Minimizes errors by reducing manual entry, ensuring more reliable financial reporting.
Cost control and fraud prevention
Enables real-time tracking of expenses to catch overspending or fraud immediately.
Employee satisfaction
Simplifies expense management for employees, leading to faster approvals and reimbursements.
Better decision-making
Facilitates informed decisions with access to up-to-date financial data.
Optimized cash flow management
Maintains accurate cash flow forecasts by tracking revenues and expenses as they occur.
Enhanced operational efficiency
Reduces manual data entry and reconciliation, streamlining financial operations.
Greater risk management
Allows for proactive monitoring of financial activities to detect irregularities early.
You can adjust your strategies quickly when you have access to live data. You measure risk exposure and monitor operational hazards as they arise. You make better investment decisions because you see up-to-date market conditions. Accurate financial reporting builds trust among stakeholders.
Real-time data access allows for quick adjustments to strategies based on current information.
It enhances risk management by enabling constant measurement of risk exposure.
Companies can monitor operational hazards as they arise, allowing for fast preventative actions.
Access to live data improves investment decisions by providing up-to-date market conditions.
It ensures accurate financial reporting, fostering transparency and trust among stakeholders.
A budget vs actual dashboard gives your business the tools to stay agile. You respond to changes faster. You keep your budget under control. You support growth and stability with better analysis and real-time financial oversight.
Key Components of Budget vs Actual Analysis
Tracking Revenue and Expenses
You need to track revenue and expenses closely to understand your financial health. A budget vs actual dashboard helps you compare your planned budget with actual results. This process gives you a clear view of how your business performs against your forecasted revenue and spending targets.
Key data points you should monitor include:
Revenue variances
Expense variances
Margin variances
Cash flow variances
Operational variances
These data points are essential for financial data analysis. They help you spot issues early, align your goals, and make informed decisions. When you use a dashboard, you can track operating expenses, expenses as a percentage of revenue, and expense composition. You also see expense changes and untagged expenses, which highlight unexplained charges. Customer acquisition cost is another important metric for profit and revenue analysis.
To make your tracking more effective, follow these steps:
Link cost tracking with project billing for accurate reporting.
Automate budget vs actual reporting to reduce manual errors.
Automated dashboards improve accuracy and cut human error rates by up to 50% compared to manual tracking.
Tracking Method
Accuracy
Human Error Rate
Manual Tracking
Susceptible to errors
Up to 50%
Automated Tracking
Highly accurate
Cuts errors by 20%-50%
Variance Analysis and Insights
Variance analysis is a core part of budget vs actual dashboards. You use it to identify variances between your budget and actual results. This process helps you understand why differences occur and how they affect your profit.
Common techniques for budget variance analysis include:
Technique Type
Description
Percentage Variance Formula
(Actual ÷ Budgeted) – 1
Dollar Variance Formula
(Actual amount – Budgeted amount)
Budget Variance Reports
Compare actual results to budgeted amounts and explain the reasons
Trend Analysis Reports
Analyze historical performance to spot patterns
Cash Flow Reports
Show the movement of cash in and out of your business
You gain valuable insights from variance analysis. You sharpen future budget assumptions, maintain liquidity, and uncover opportunities for profit improvement. You can also share knowledge across teams and make better decisions based on real data. When you identify variances early, you can adjust your strategy and keep your financial performance on track.
Essential Features for Financial Oversight with FineReport
Data Integration and Automation
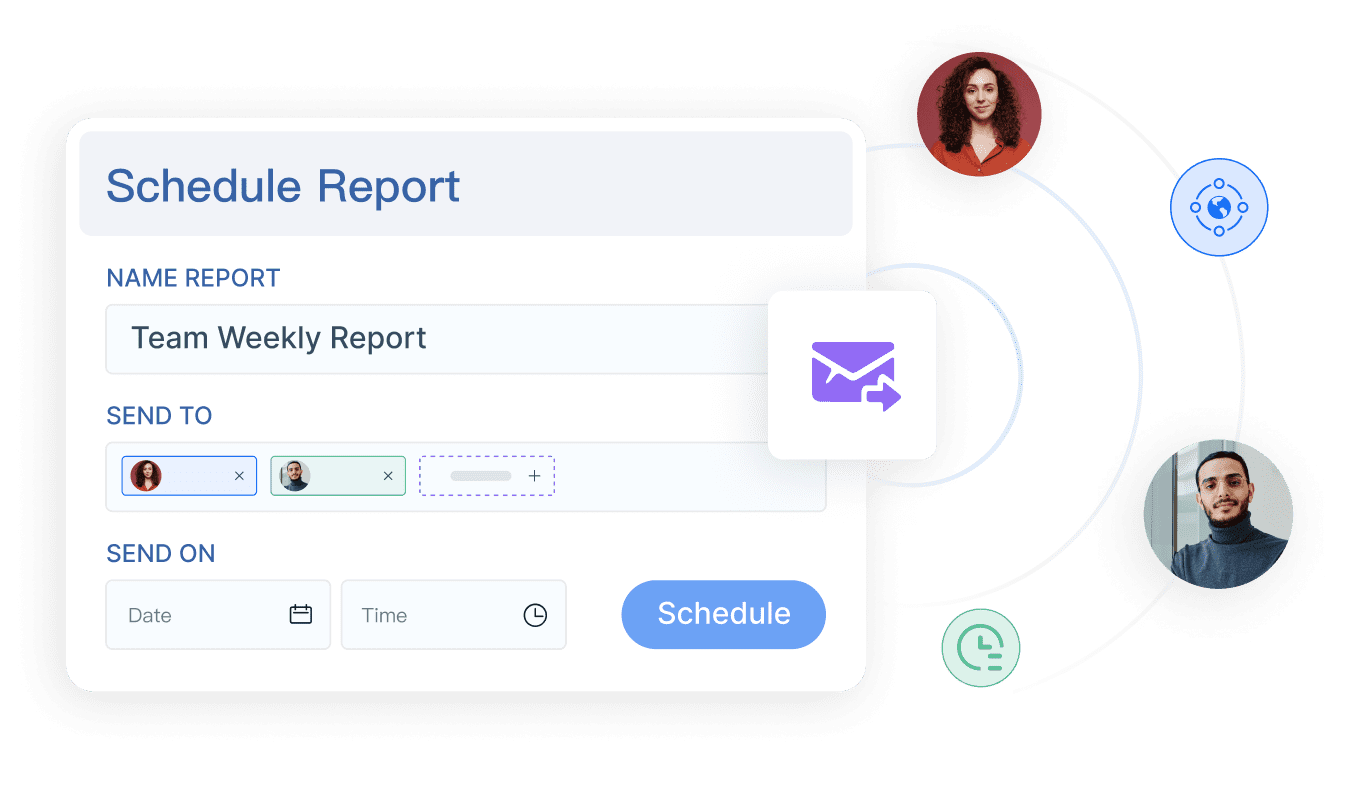
You need a budget vs actual dashboard that brings all your business data together. FineReport connects to many data sources, including ERP, CRM, and spreadsheets. You can automate the flow of budget and actual data, so you always see the latest numbers. This automation reduces manual work and helps you avoid errors. You can schedule reports to run at set times, making sure your team always has up-to-date financial information.
FineReport lets you merge budget, revenue, and expense data from different systems. You can track actual spending against your budget in real time. This helps you spot variance early and take action before small issues become big problems. In manufacturing, companies like BOE use FineReport to unify financial and operational data. This approach improved their business efficiency and reduced costs. In the finance sector, King Yuan Electronics used FineReport to cut report development time and improve decision-making. You can see how these features help you manage your business with confidence.
FineReport simplifies the process of combining data from different sources. You can automate reporting and share results across departments, making financial management smoother and more reliable.
Visualization and Collaboration Tools
You need clear visuals to understand your business performance. FineReport offers dashboards with charts, graphs, and tables that show budget, actual, and variance data side by side. You can quickly see which areas are over or under budget. The dashboard flags top and underperformers, so you know where to focus your attention.
Contribution to Financial Transparency and Control
Data Visualization Tools
Turns raw data into easy-to-read visuals for everyone in your business.
Collaboration & Workflow
Lets your team work together on budget analysis, reducing mistakes.
Integration Capabilities
Pulls data from many systems for a full business view.
Automate for Accuracy
Cuts down on manual errors and saves time.
Improve Decision-Making
Gives leaders real-time data for quick, smart choices.
You can share dashboards with your team, making collaboration easy. FineReport supports user-friendly interfaces, so you do not need special training to use it. You can adjust future budgets, find cost-saving opportunities, and respond quickly to changes in your business. These tools help you keep your financial management aligned with your goals.
Strategies to Optimize Budget Management
Leveraging Dashboards for Better Decisions
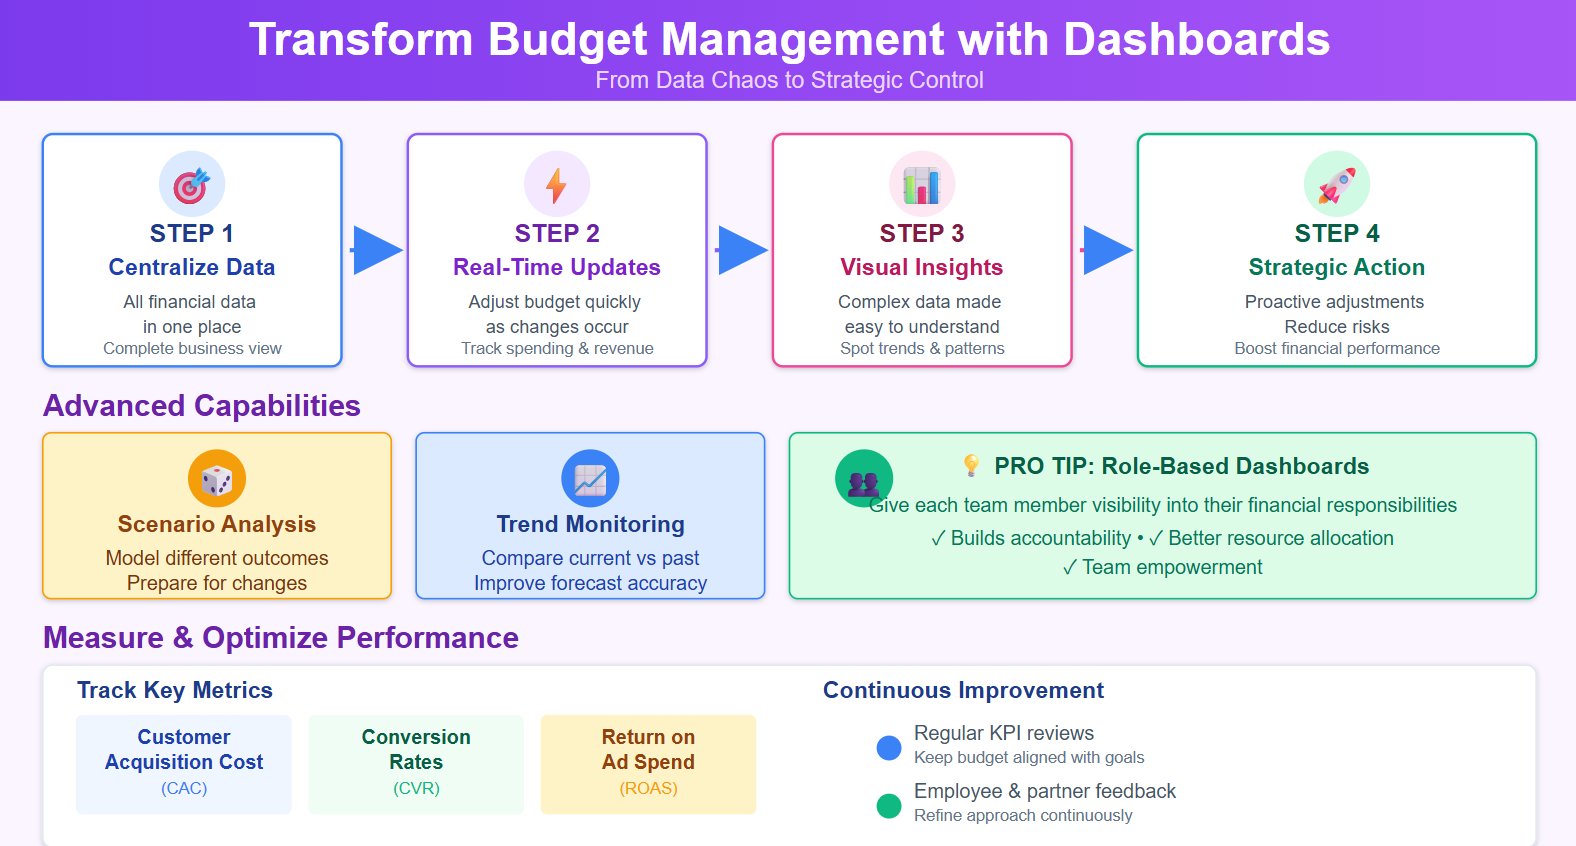
You can use dashboards to transform your approach to budget management. Start by centralizing all your financial data in one place. This gives you a complete view of your business and helps you track every dollar. Real-time updates let you adjust your budget quickly when you see changes in spending or revenue. Visual tools make complex financial information easy to understand, so you can spot trends and patterns that affect profit and performance.
Dashboards support scenario analysis, which means you can model different outcomes and prepare for changes in your business. Trend monitoring helps you compare current results with past data, improving your forecasting accuracy. You can make proactive adjustments to your budget, reducing risks and boosting financial performance.
Tip: Use role-based dashboards to give each team member visibility into their financial responsibilities. This builds accountability and supports better resource allocation.
You can measure the effectiveness of your strategies by tracking key metrics like customer acquisition cost, conversion rates, and return on ad spend. Regular reviews of these KPIs keep your budget aligned with your business goals. Feedback from employees and partners helps you refine your approach and drive continuous improvement.
Organization
Dashboard Type
Key Features
Impact on Decision Quality
IBM
Data Quality Dashboard
Monitors product carbon footprint and suppliers
Enables targeted improvements in supply chain management
Avoiding Common Pitfalls
You can avoid common budget management mistakes by using dashboards to track timing differences, variable costs, and committed spend. Many businesses misinterpret financial data because they do not account for these factors. Dashboards provide real-time visualizations, helping you see where your budget stands at any moment.
Follow these best practices for continuous improvement:
Update your dashboard regularly to reflect current data.
Engage users for feedback on dashboard features and usability.
Integrate all relevant data sources to ensure accuracy.
Start with simple KPIs and expand as your needs grow.
Review dashboard visuals in meetings to keep everyone informed.
You can strengthen your financial performance by making these steps part of your routine. This approach leads to better profit analysis, improved variance tracking, and stronger overall management of your business.
A budget vs actual dashboard gives you a clear view of your business, turning complex data into actionable insights for better financial management. You can quickly spot trends, address gaps, and make data-driven decisions. Automation, integration, and visualization drive sustainable growth by streamlining reporting and enabling real-time strategy adjustments.
Criteria
Description
Features
Automation, expense management, and multi-currency support help you stay ahead.
Pricing
Choose a solution that balances cost and value for your business.
Integrations
Ensure compatibility with your existing tools for seamless operations.
Ready to stop overspending and master your budget control? Click the banner below to start your FREE trial of FineBI and optimize your financial performance today!
Access a wealth of case studies, industry insights, and solution guides to accelerate digital transformation.
FAQ
What is a budget vs actual dashboard?
A budget vs actual dashboard lets you compare your planned budget with your real spending. You see where your money goes and spot differences quickly. This tool helps you manage your finances better.
How does FineReport automate budget tracking?
FineReport connects to your business systems and pulls in real-time data. You do not need to enter numbers by hand. The dashboard updates automatically, so you always see the latest results.
Can I use FineReport with my existing data sources?
Yes! FineReport supports over 100 data sources, including Excel, ERP, and databases. You can easily integrate your current systems and view all your financial data in one place.
What industries benefit most from budget vs actual dashboards?
Manufacturing and finance companies gain the most. They handle large budgets and need real-time tracking. Dashboards help them control costs, improve efficiency, and make smarter decisions.
Is FineReport easy to use for non-technical users?
You do not need coding skills to use FineReport. The drag-and-drop interface makes report building simple. You can create dashboards and share insights with your team quickly.