If you want the best cash flow dashboard templates for 2026, you need solutions that deliver real-time cash flow insights and automate cash flow tracking. Many businesses still rely on fragmented Excel sheets for cash flow reporting, which creates problems such as inaccurate invoices, heavy dependence on manual updates, and poor collaboration.
When you switch to a real-time cash flow dashboard, you gain clear visualization of cash flow metrics and cash flow status. A modern dashboard gives you cash flow summary, cash flow insights, and a kpi dashboard for projecting monthly cash flow. You can manage finance with a financial dashboard that supports cash flow reporting and helps you make better decisions.
All Dashboard in this article were created by FineReport.
A cash flow dashboard is a visual tool that consolidates cash inflows, outflows, and balances into a single view. It helps finance teams and executives answer three questions at a glance:
How much cash do we have right now?
Where is it coming from and going to?
Will we have enough to cover obligations next week, month, or quarter?
Unlike a static cash flow statement, a dashboard updates automatically (when connected to live data sources) and highlights trends, variances, and forecasts rather than just historical totals.
Choosing the right finance dashboard templates can transform how you manage cash flow. You get clear insights, faster reporting, and better decision-making. Here are ten financial dashboard examples that help you track, analyze, and forecast your cash flow with ease.
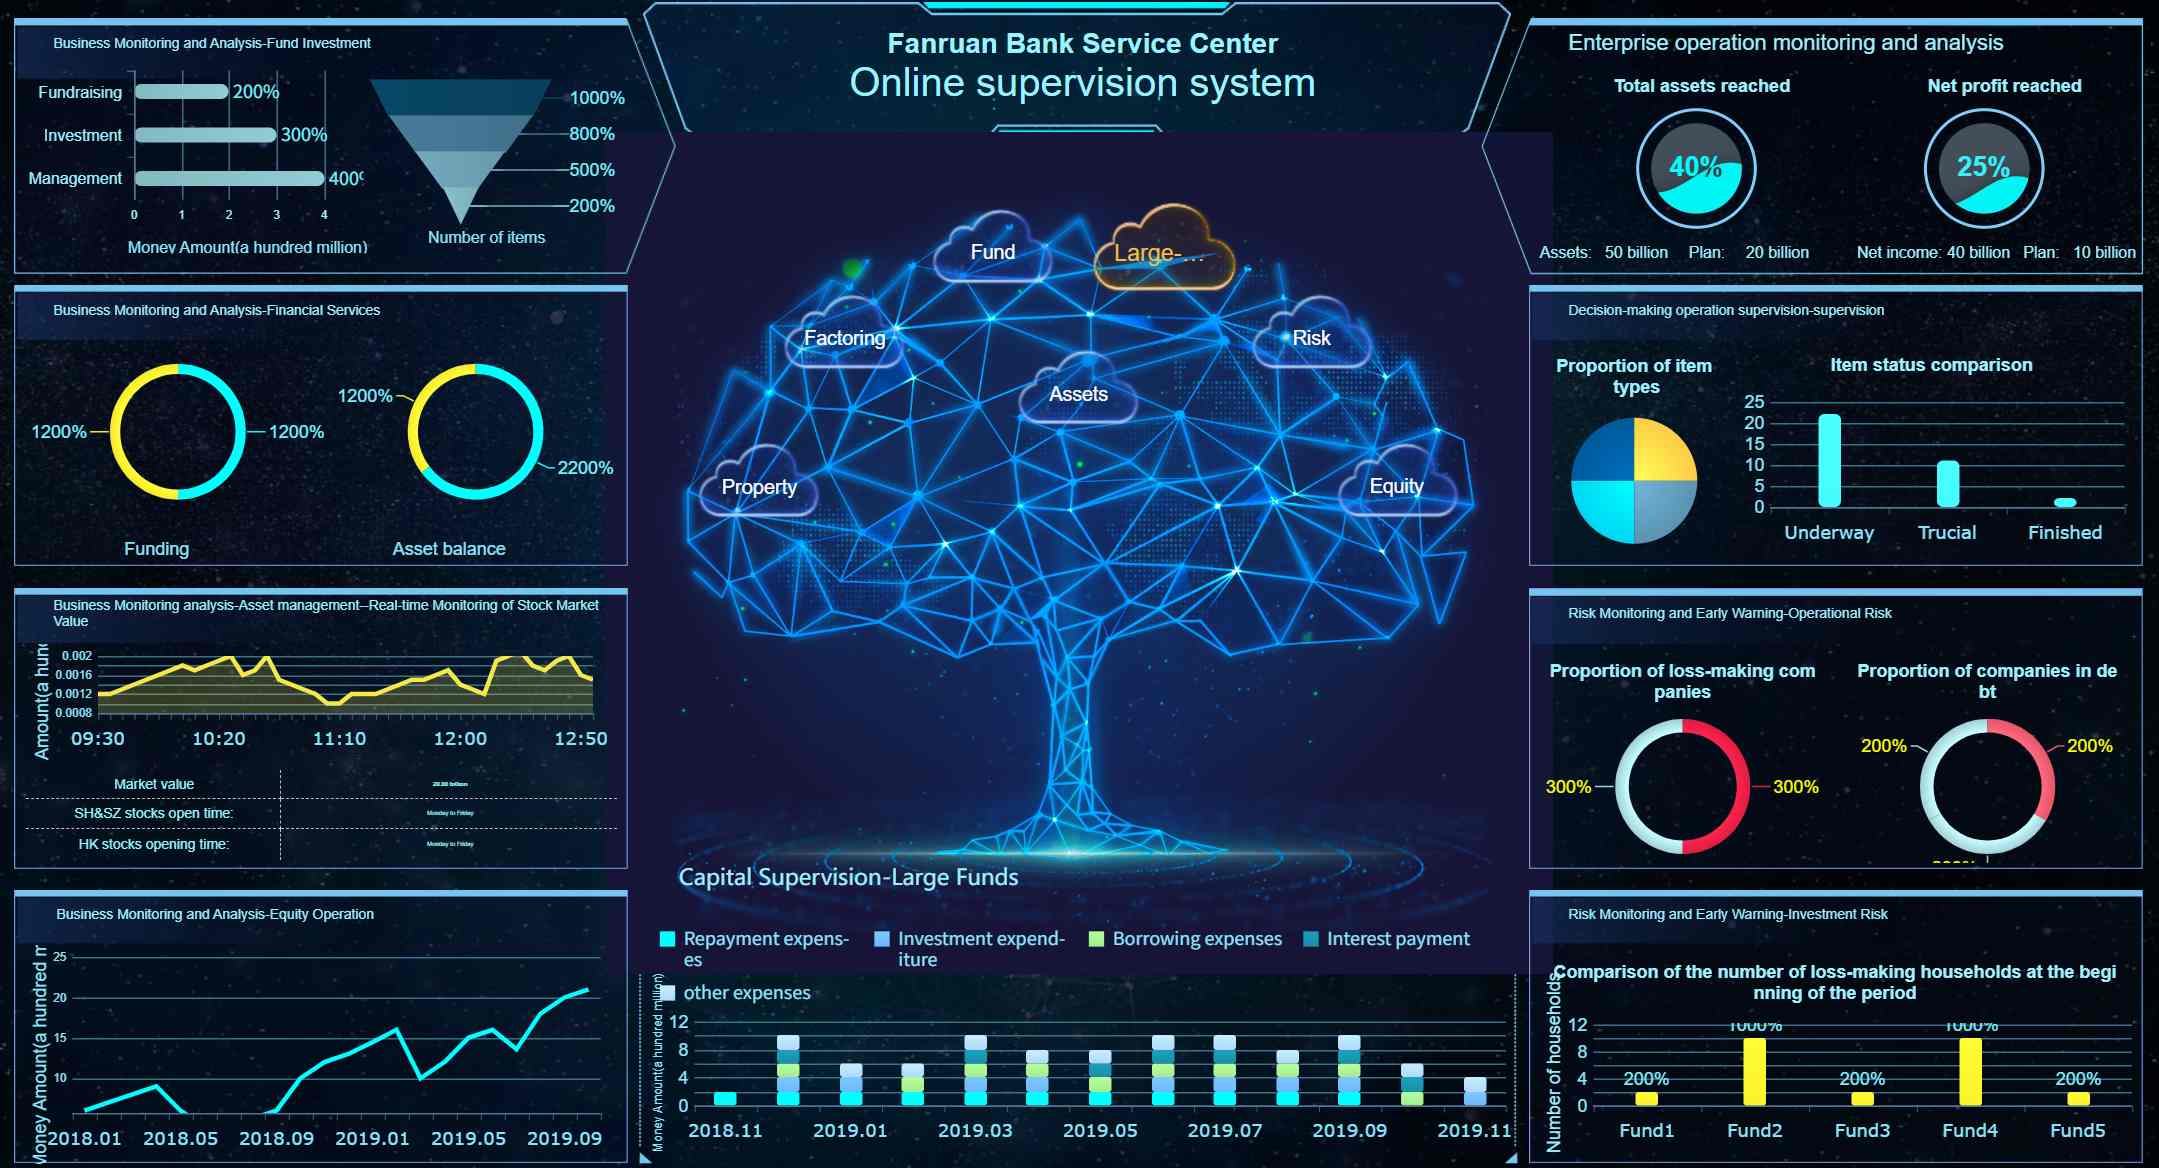
FineReport gives you a real-time cash flow dashboard that centralizes your actual cash position. You see updates from all subsidiaries and bank accounts in one place. You can track both actual and forecasted liquidity, monitor net debt, and analyze variances between actual and forecasted cash. This template is perfect for finance teams who want accurate cash flow reporting and better control over cash flow processes.
Use Case Description
Details
Consolidated actual cash position
Centralized view of cash positions across subsidiaries and bank accounts, updated in real time.
Total actual and forecasted liquidity
Displays both actual and forecasted liquidity for accurate reporting.
Covenants and net debt management
Monitors net debt and covenant metrics.
Variance analysis
Highlights differences between actual and forecasted cash.
Tip: Use FineReport to automate your financial dashboard template and reduce manual updates.
FanRuan offers finance dashboard templates that stand out for zero-code development and real-time processing of massive data. You get robust permission management and access to a rich template market. These templates suit IT professionals, BI engineers, and finance managers who need flexible, secure, and scalable financial dashboards.
Feature
FanRuan Finance Dashboard Template
Other Dashboard Solutions
Zero-code Development
Yes
Varies
Real-time Processing of Massive Data
Yes
Limited
Robust Permission Management System
Yes
Varies
Rich Template Market Resources
Yes
Limited
Note: FanRuan templates help you build a finance dashboard that grows with your business.
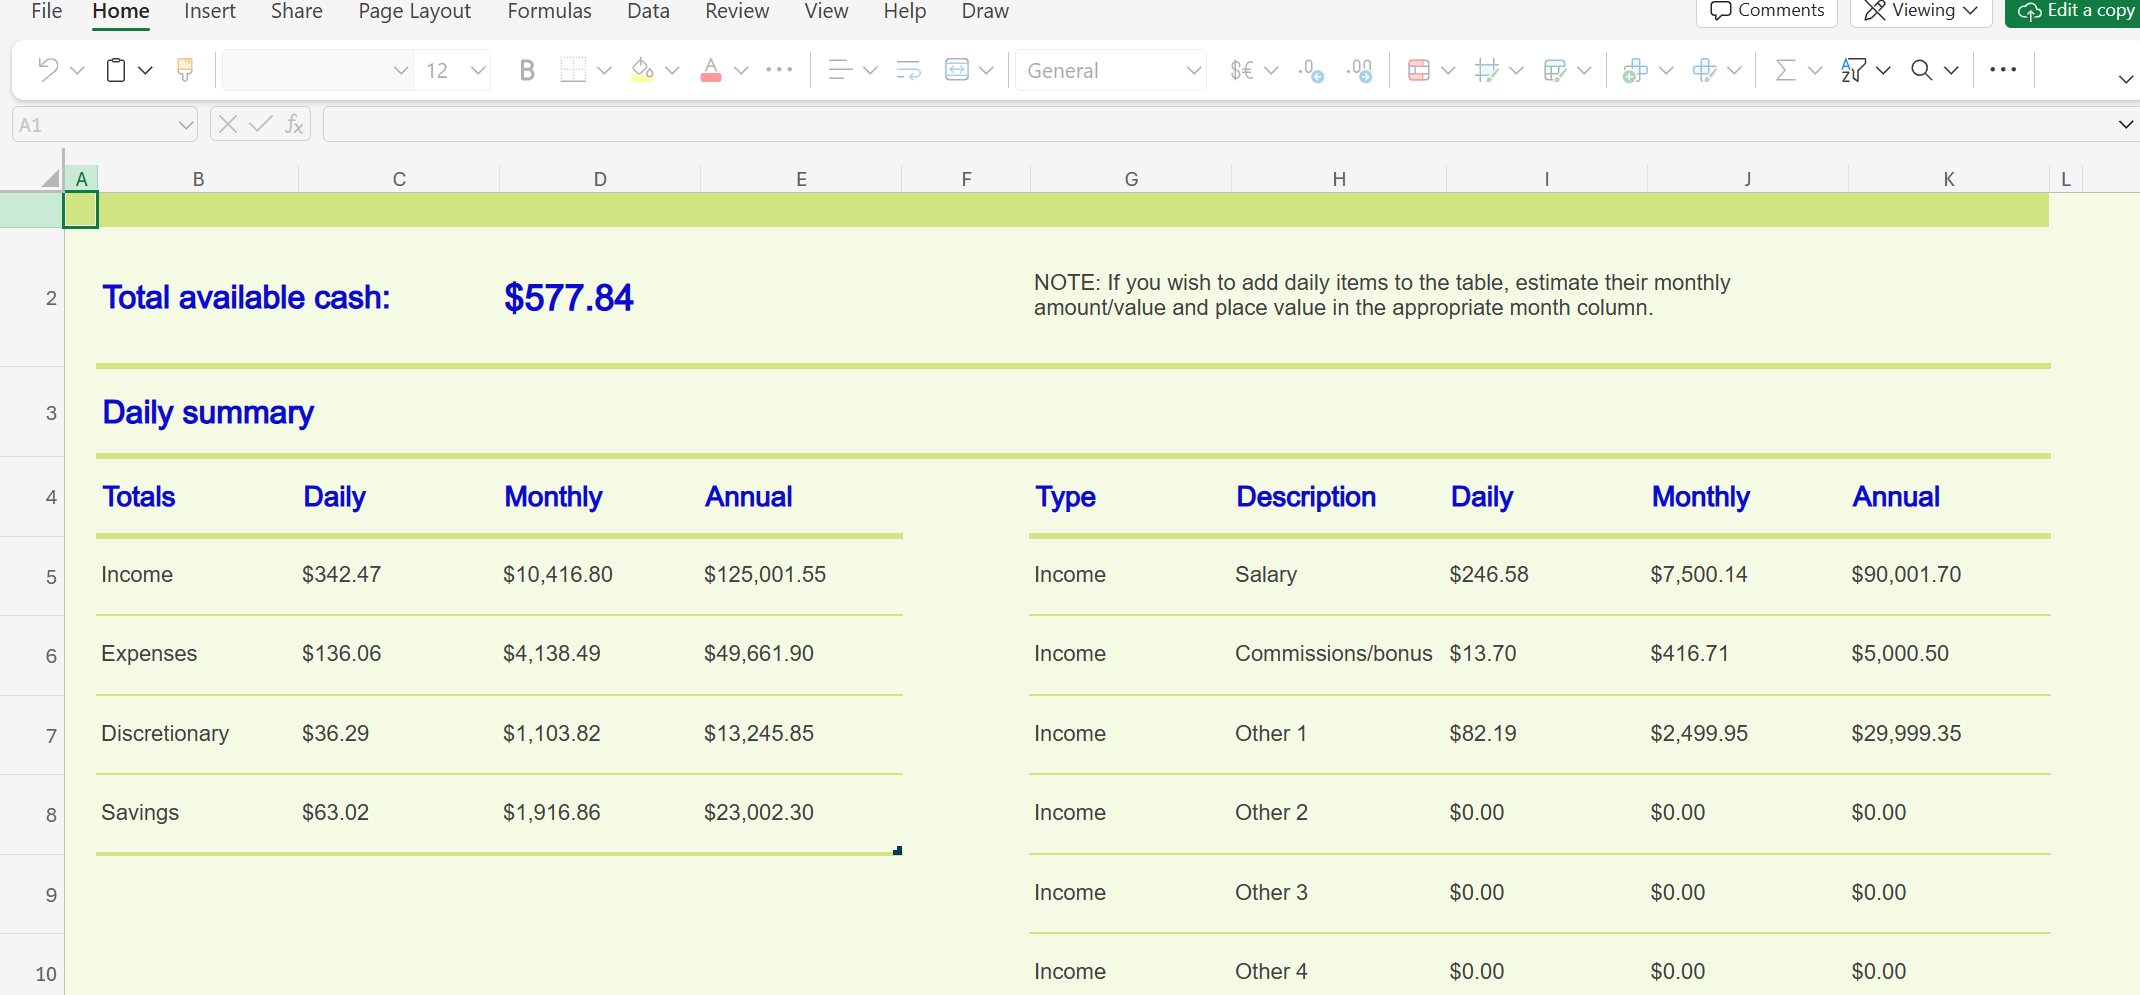
Excel remains a popular choice for finance dashboard templates. You can customize your template to fit your business needs. You get direct visibility into cash movements, but you must update data manually. This template works best for small businesses or teams who want a simple financial dashboard example without automation.
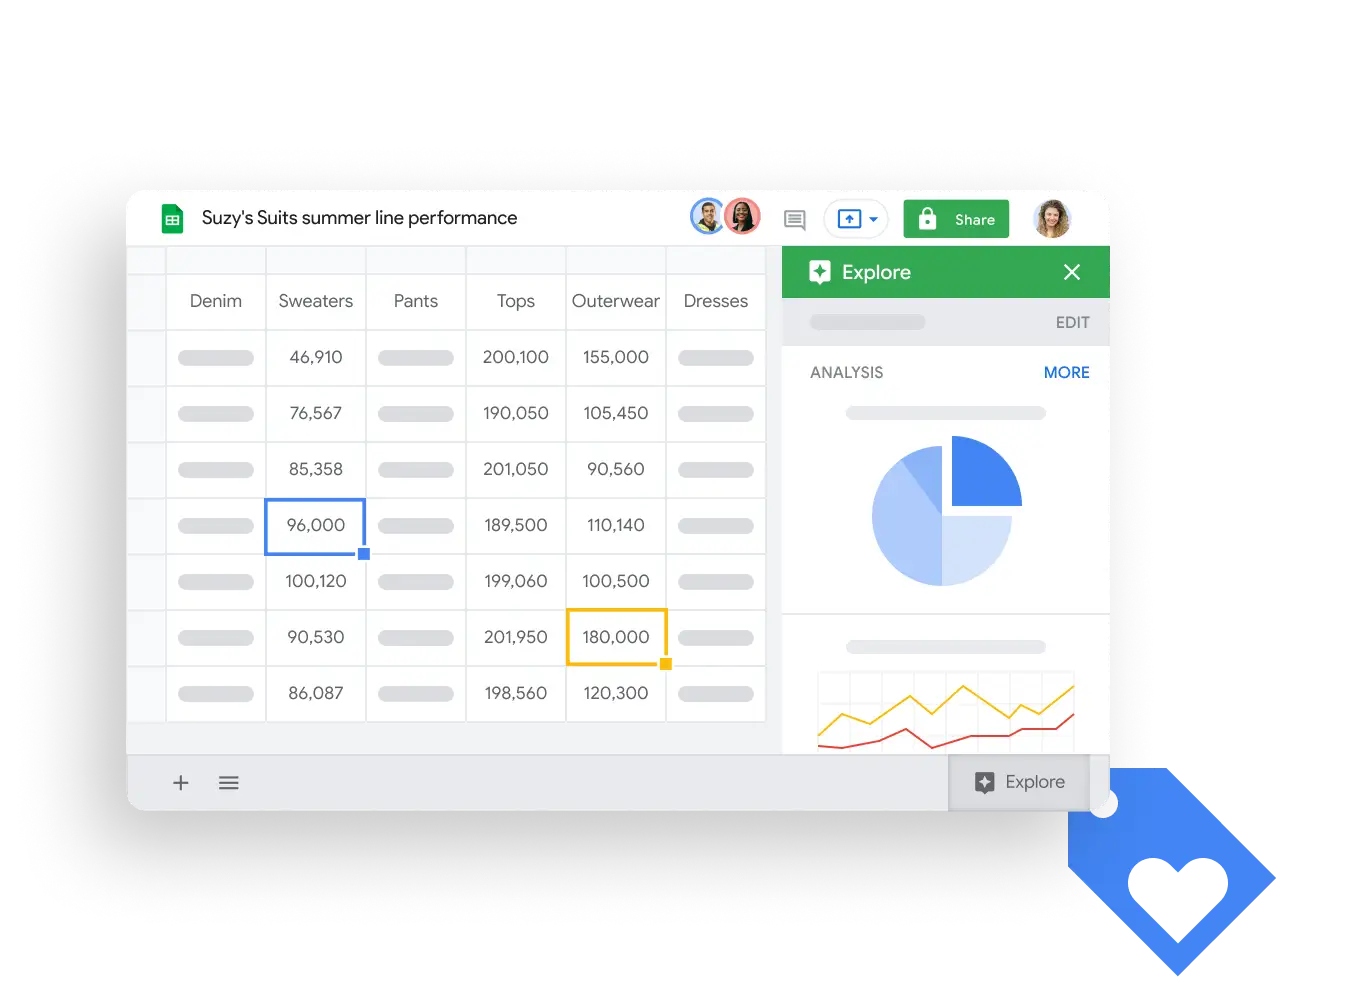
Google Sheets templates give you two-way sync and automatic insights push. You can integrate your cash flow dashboard with other Google tools. This template is ideal for small businesses that need easy collaboration and essential integration.
Feature
Description
Two-way sync
Supports two-way synchronization with Google Sheets.
Automatic insights push
Pushes insights back to Google Sheets for seamless teamwork.
Essential integration
Google Sheets acts as the backbone for small business finance dashboards.
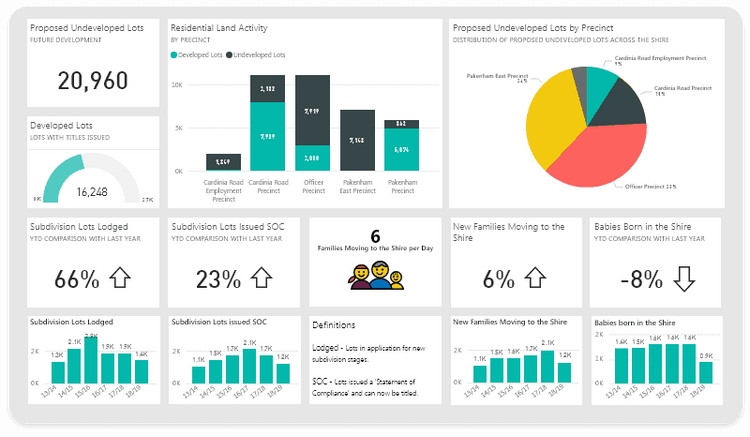
Power BI templates offer advanced analytics for your cash flow dashboard. You can use machine learning for predictive modeling, statistical forecasting, and scenario planning. You also get automated variance analysis and benchmark comparisons. This template suits finance teams who want deep insights and strategic planning.
Feature
Description
Machine Learning Integration
Predictive cash flow modeling and anomaly detection.
Statistical Forecasting
Time series analysis with advanced models.
Scenario Planning
What-if analysis for stress testing and planning.
Correlation Analysis
Finds relationships between cash flow patterns and business drivers.
Variance Analysis
Automated reporting with intelligent insights.
Benchmark Comparisons
Industry benchmarking for performance context.
These finance dashboard templates give you the tools to manage cash flow, track financial performance, and plan for the future. You can choose a financial dashboard template that fits your business size, industry, and reporting needs. With the right dashboard, you gain better visibility, faster insights, and stronger financial health.
Need a cash flow dashboard that updates automatically? Build real-time finance dashboards with FineReport.
What Metrics Should a Cash Flow Dashboard Track?
A well-designed cash flow dashboard goes beyond opening and closing balances. These are the core metrics finance teams should include:
Metric
What It Tells You
Opening cash balance
Starting liquidity at the beginning of the period
Cash inflows
Total money received from operations, financing, and investing
Cash outflows
Total money spent across operations, financing, and investing
Net cash flow
Inflows minus outflows; positive = surplus, negative = deficit
Operating cash flow
Cash generated or consumed by core business activities
Days between paying suppliers and receiving customer cash
Burn rate
Monthly cash consumption rate (critical for startups and growth-stage companies)
Cash runway
Months of operations remaining at current burn rate
Forecasted cash position
Projected future balance based on expected inflows, outflows, and timing
Tracking these metrics together gives a complete picture of liquidity health. For teams also managing budget compliance alongside cash flow, a budget vs actual dashboard complements cash flow monitoring by showing where spending deviates from plan. Similarly, a profit and loss dashboard connects accrual-based profitability to cash-based liquidity.
FineReport for Cash Flow Dashboards
FineReport gives you powerful tools to build a cash flow dashboard that transforms how you manage finance. You see real-time cash flow dashboard updates, automate cash flow reporting, and connect data from every source. You get a financial dashboard template that helps you track, analyze, and forecast your cash position with confidence.
Automated Data Aggregation
You can automate data aggregation with FineReport. The platform collects and updates financial dashboard examples from all your banking, ERP, and accounting systems. You avoid manual entry and reduce errors. Your dashboard always shows the latest numbers, so you make decisions based on facts. Scheduled tasks let you set up automatic report generation, so your team receives financial dashboard examples on time. You save hours every month and keep your finance dashboard accurate.
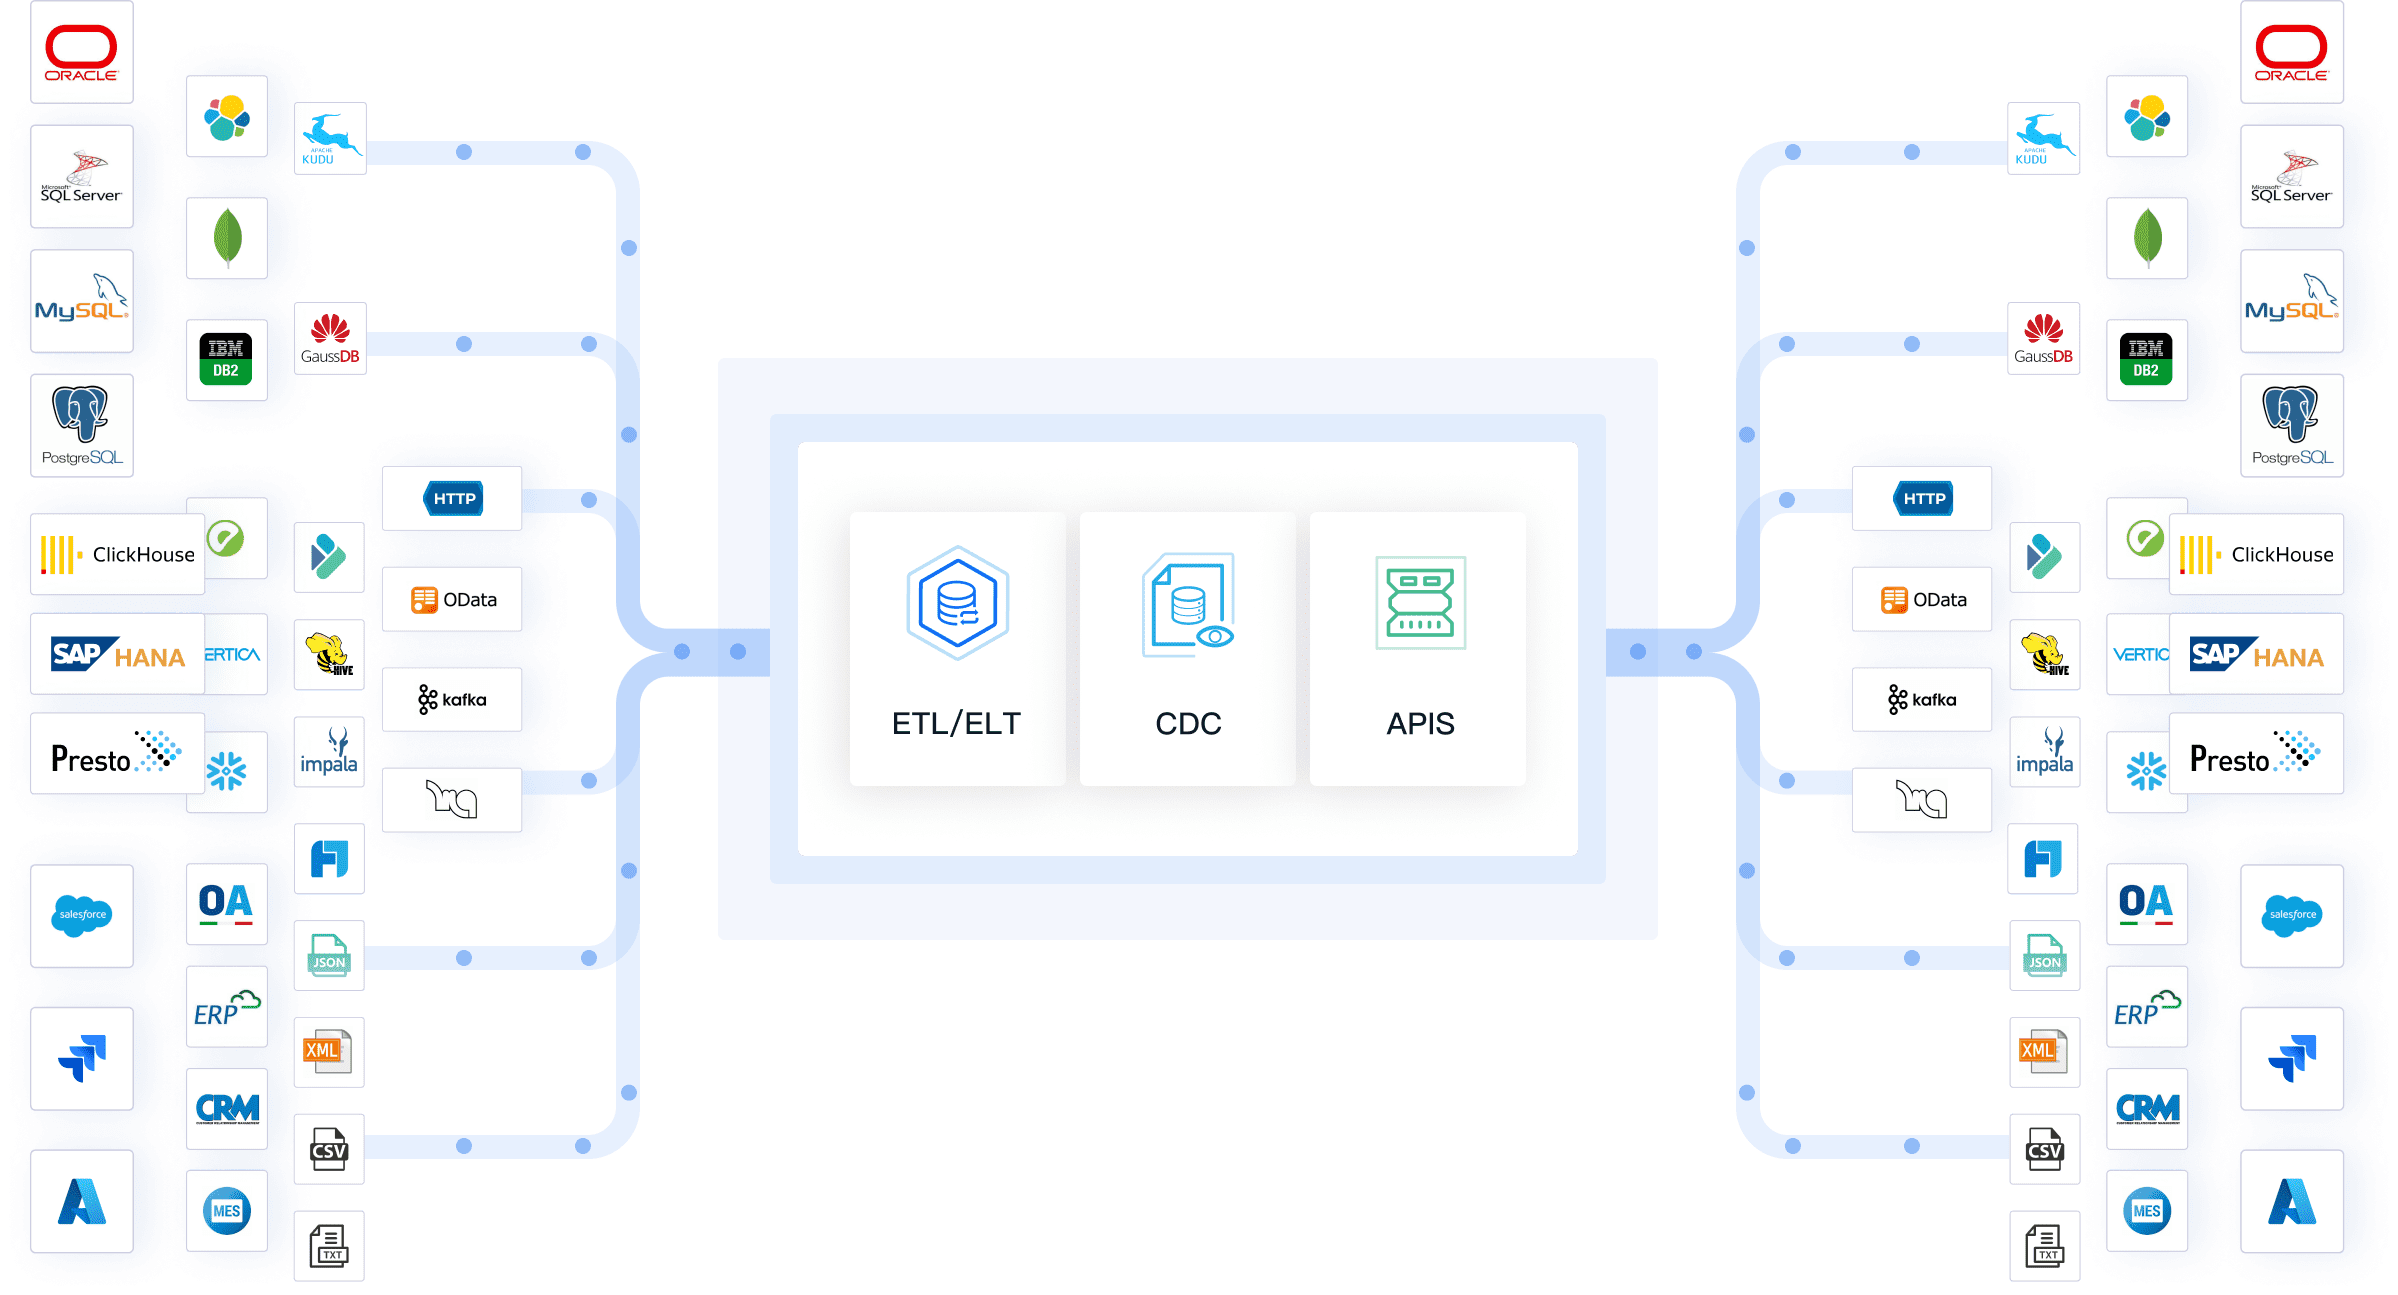
Multi-Source Integration with FineDataLink
FineDataLink makes multi-source integration simple. You connect data from different systems and keep everything consistent. Here’s how FineDataLink improves your financial dashboard examples:
Data integration from multiple sources ensures you see every detail in your cash flow dashboard.
Data consistency means you trust your numbers, even when they come from different places.
Automated data synchronization keeps your financial dashboard examples updated with the latest information.
Seamless data transformation puts your data in the right format for analysis.
You use these features to build templates that combine banking, sales, and expense data. Your financial dashboard examples become more reliable and easier to understand.
Mobile and 3D Dashboard Capabilities
FineReport lets you access your dashboard anywhere. You use mobile-friendly dashboards to check financial dashboard examples on your phone or tablet. Real-time data visualization gives you instant insights, so you respond quickly to changes. You customize reports to fit your needs, making your financial dashboard template clear and relevant.
Feature
Description
Mobile-Friendly Dashboards
Dashboards designed to be accessible and functional on mobile devices, ensuring usability on the go.
Real-Time Data Visualization
Provides up-to-date insights into financial metrics, allowing for timely decision-making.
Customizable Reporting
Users can tailor reports to meet specific needs, enhancing relevance and clarity in financial management.
You also use time period controls and filtering options to focus on specific financial dashboard examples. Save and share capabilities help your team collaborate and review templates together.
FineReport supports financial management, risk management, and budget management. You use financial dashboard examples to monitor cash flow, spot risks, and plan budgets. Your finance dashboard adapts to your business, giving you the tools to grow and succeed.
Cash Flow Dashboard Template vs. Automated Finance Dashboard
Templates and automated dashboards serve different stages of cash flow maturity. A template is the right starting point when your data lives in a single source, one person owns the report, and monthly updates are sufficient. But as transaction volume grows, data sources multiply, or stakeholders demand real-time visibility, manual templates become a bottleneck — not because they lack functionality, but because they depend on human effort that does not scale.
FineReport addresses this gap by automating the entire pipeline from data extraction to dashboard delivery. Instead of copying numbers from bank portals and ERP exports into spreadsheets, FineReport connects directly to your source systems via FineDataLink, refreshes on a schedule you define, and distributes dashboards to stakeholders with role-based permissions.
Factor
Cash flow template
Automated dashboard (e.g. FineReport)
Data refresh
Manual copy-paste each period
Scheduled automatic refresh from connected sources
Data sources
Single spreadsheet or export file
ERP, banking APIs, accounting software, CRM
Update frequency
Monthly or ad hoc
Daily, hourly, or real-time
Access control
File-level sharing; no row-level security
Role-based permissions with drill-down restrictions
Distribution
Email attachments or shared drives
Web portal, mobile app, scheduled email delivery
Audit trail
None; overwritten with each save
Version history and change logging
Scalability
Degrades as data volume and user count grow
Handles millions of rows and hundreds of concurrent users
Setup effort
Minutes to hours
Days (initial configuration and data connection)
Ongoing maintenance
Recurring manual effort each reporting cycle
Near-zero after initial setup
The transition from template to automation is not about replacing Excel — it is about removing the repetitive work that prevents finance teams from focusing on analysis. If your team spends more time assembling the cash flow report than interpreting it, that is the signal to automate.
From Cash Flow Dashboard to AI-Powered Cash Flow Insights with Dora
A cash flow dashboard shows what happened and what is happening now.Dora adds an AI layer on top of trusted finance data, helping finance teams ask natural-language questions, summarize cash flow changes, detect unusual movements, and receive proactive briefings before liquidity risks become urgent.
Practical applications include:
Natural-language Q&A: Ask "Why did operating cash flow drop 18% last month?" and get a structured explanation tied to underlying transactions.
Anomaly detection: Receive alerts when cash outflows spike unexpectedly or when receivables aging exceeds thresholds.
Executive briefings: Auto-generate weekly cash flow summaries for CFO review without manual narrative writing.
Forecast narration: Get plain-language explanations of why forecasted cash position changed between model runs.
Ask Dora in natural language
Dora works on top of existing FineReport dashboards and FineDataLink pipelines, so you do not need to rebuild your data infrastructure to add AI capabilities.
Use a cash flow template when...
Use FineReport when...
Add Dora when..
You update cash flow manually each month
You need scheduled data refresh
You want AI-generated cash flow summaries
One finance person manages the file
Multiple teams need shared dashboards
Executives ask cash flow questions in natural language
Data comes from one spreadsheet
Data comes from ERP, accounting, CRM, and bank data
You need AI to explain unusual inflows or outflows
You only need basic cash flow charts
You need drill-down, permissions, and automated reports
You want proactive alerts on cash runway or liquidity risks
Audience: Solo finance user → template. Cross-functional teams with different access levels → FineReport with role-based permissions. Executive consumers → Dora for natural-language access.
Analytical depth: Historical tracking → template or basic dashboard. Forecasting, scenario modeling, and anomaly detection → Power BI or FineReport + Dora.
There is no universally best option. A startup with one bank account and a part-time bookkeeper does not need an enterprise BI platform. A multinational with 30 subsidiaries and daily liquidity reporting cannot survive on Excel. Match the tool to your current reality, not to aspirational complexity.
Ready to master your company’s liquidity and secure your financial future? Click the banner below to start your FREE trial of FineReport and take control of your cash flow today!
Access a wealth of case studies, industry insights, and solution guides to accelerate digital transformation.
FAQ
What is a cash flow dashboard?
You use a cash flow dashboard to track and visualize your company’s cash inflows and outflows. This tool gives you a clear view of your current cash position and helps you make better decisions.
How does a financial dashboard improve decision-making?
A financial dashboard presents real-time data in easy-to-read charts and graphs. You can quickly spot trends, monitor key metrics, and respond to changes. This helps you make informed choices for your business.
Can I connect my finance software to these dashboards?
Yes, you can connect most dashboards to your finance software. This integration lets you automate data updates and ensures your reports always show the latest numbers.
Who should use a cash flow dashboard?
You should use a cash flow dashboard if you manage business finances. It helps owners, CFOs, and finance teams monitor cash flow, plan budgets, and avoid surprises.
Are these dashboards secure?
Most dashboards offer strong security features. You can set permissions, use password protection, and control who accesses sensitive information.