In today’s data-driven world, professional format report plays a crucial role in decision-making and business success. Choosing the best reporting tools in 2026 can revolutionize how you handle data. Tools likeFineReportempower you to create precise, visually appealing reports while saving valuable time. Businesses using automated reporting software have seen a 50% reduction in time spent on data tasks. Moreover, organizations leveraging real-time analytics often achieve up to a 10% boost in operational efficiency. By adopting tools with advanced features, you can streamline processes, reduce errors, and unlock new insights. Whether for financial analysis or operational reporting, the right format report solutions can elevate your outcomes.
Key Takeaways
Picking the right tool can make handling data much easier.
Automated tools save up to 50% of the time on tasks.
Easy-to-use features, like drag-and-drop, help everyone create reports.
Custom options let you make reports that fit your needs better.
Learning new tool features can boost their usefulness and save time.
Top Tools for Format Report in Malaysia
FineReport: A Comprehensive Reporting Solution
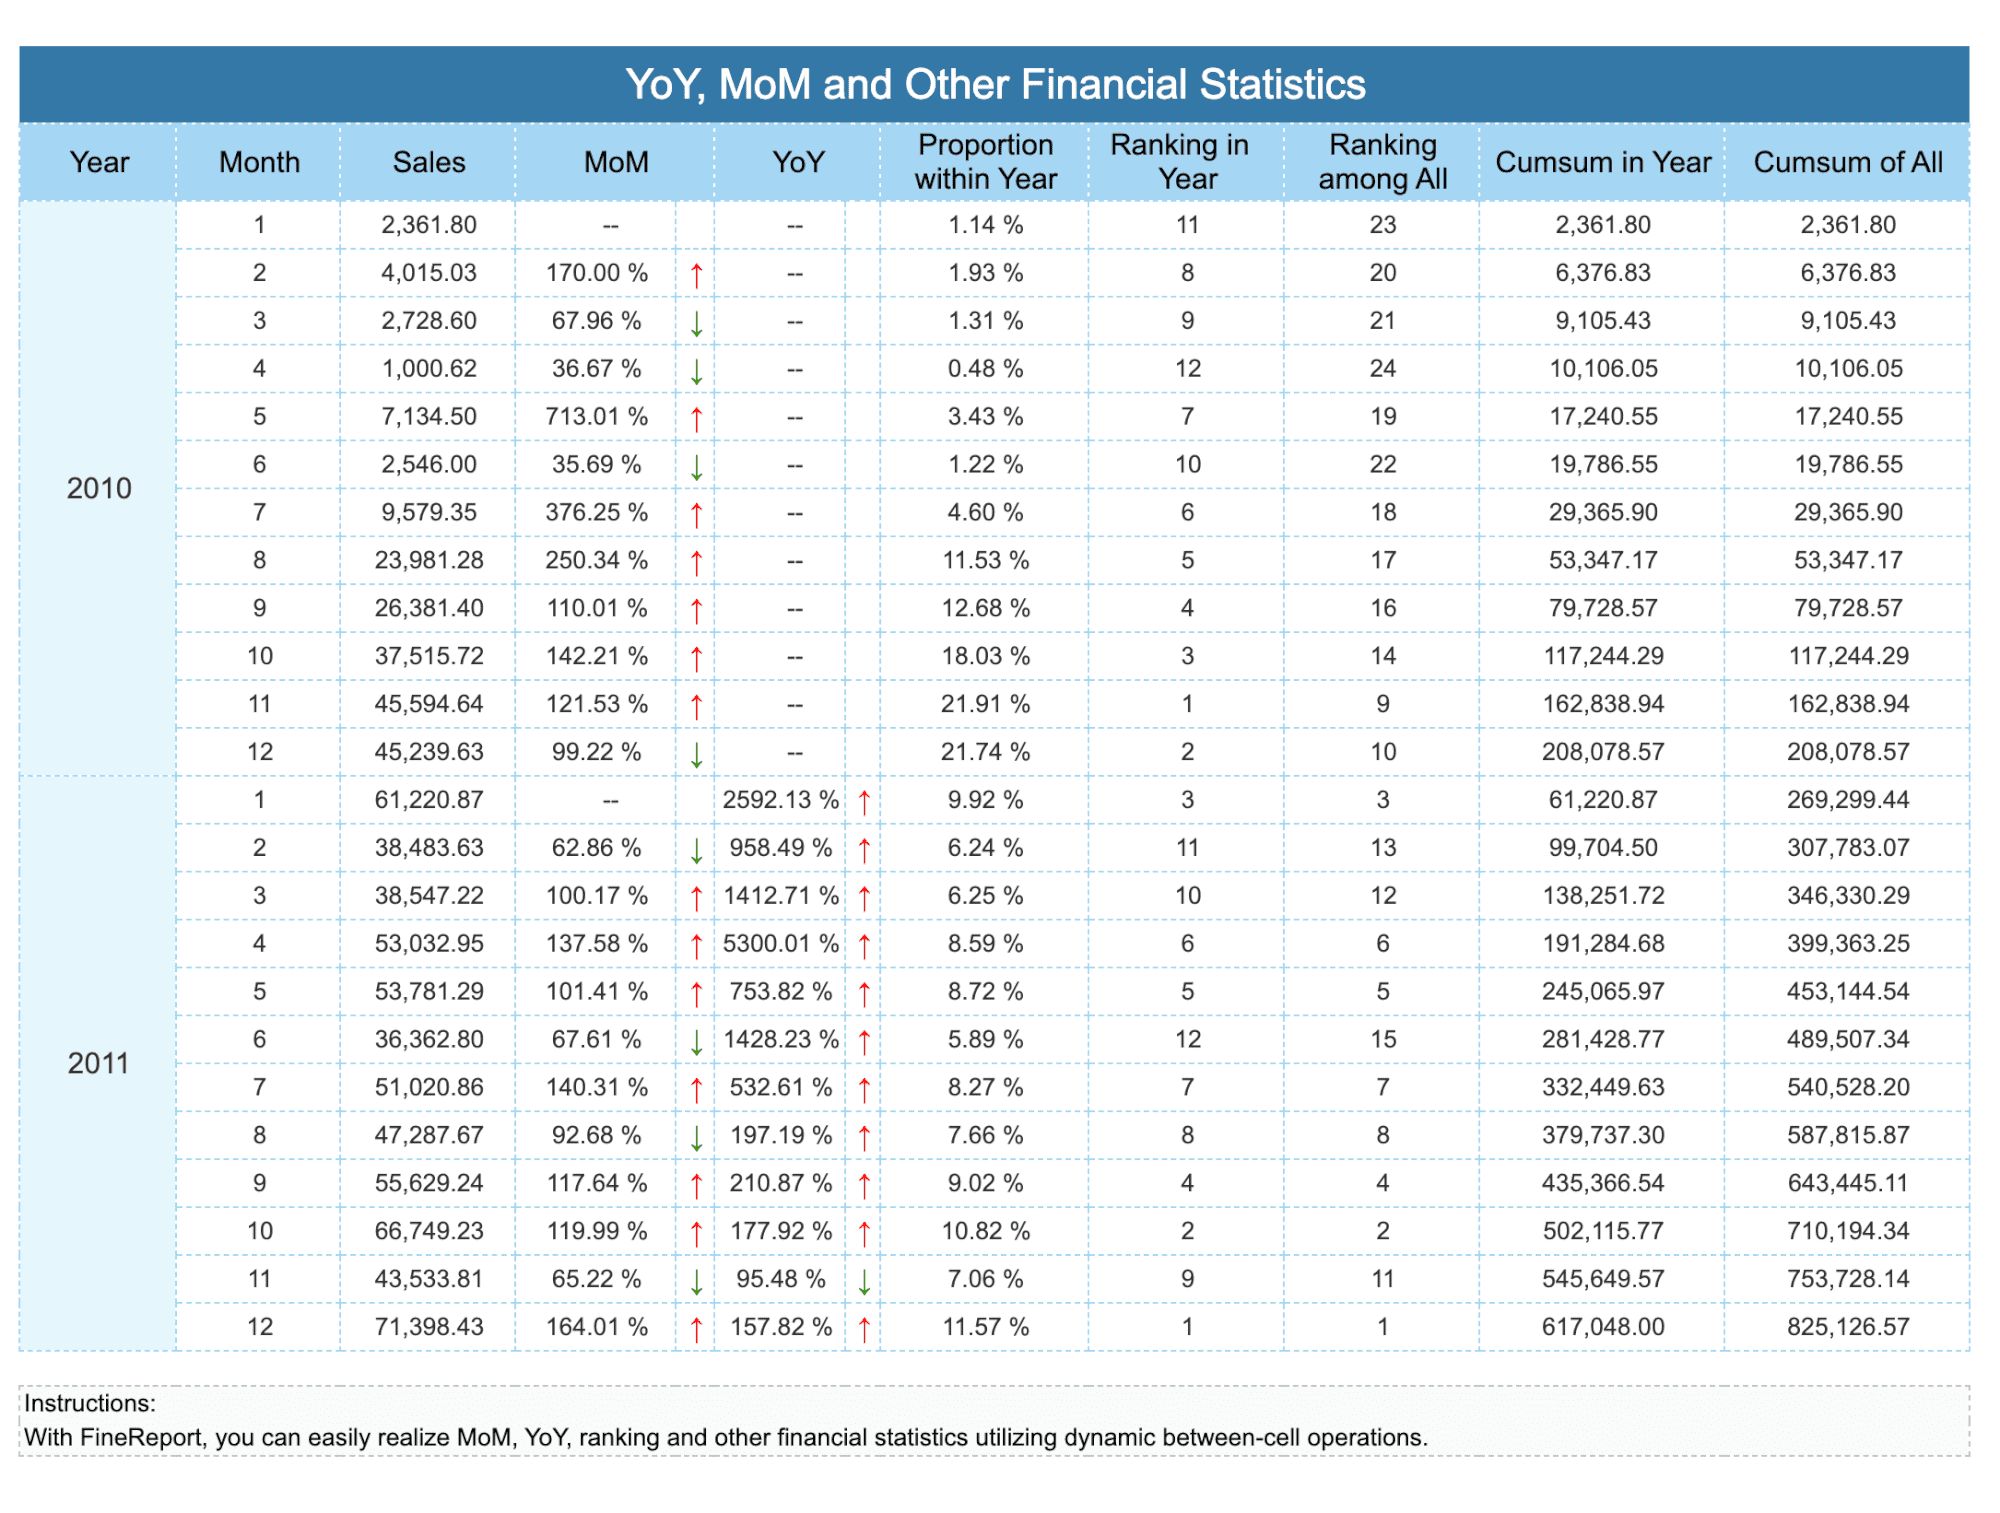
FineReport stands out as one of the best reporting tools in 2026, offering a robust platform for creating pixel-perfect reports and dynamic dashboards. Its user-friendly drag-and-drop interface simplifies report creation, making it accessible even for those without advanced technical skills. You can connect to multiple data sources, integrate real-time data, and generate highly customized reports tailored to your business needs.
Tip: FineReport’s automated reporting feature saves time by scheduling and distributing reports automatically, ensuring stakeholders receive timely updates.
Here’s how FineReport enhances your reporting experience:
Automated Reporting: Streamlines recurring tasks, cutting reporting time by 30%.
Dynamic Visualizations: Offers over 70 chart styles for better data presentation.
FineReport is particularly effective for financial reporting software, where precision and clarity are critical. Its ability to handle large datasets and integrate seamlessly with existing systems makes it a top choice for enterprises aiming to improve efficiency and decision-making.
Tableau: Advanced Data Visualization and Reporting
Tableau is a leader among data visualization tools, transforming raw data into interactive and shareable dashboards. It empowers you to explore data through visual storytelling, making complex information easier to understand. Tableau’s ability to connect to various data sources ensures comprehensive analysis and real-time updates, which are essential for timely decision-making.
Note: Tableau’s 'Explain Data' feature uses machine learning to analyze visualizations, providing insights into trends and anomalies.
Key features of Tableau include:
Interactive Dashboards: Combine multiple visualizations for deeper insights.
AI Integration: Enhances data analysis with predictive modeling and automatic insights.
Advanced Analytics: Supports forecasting and trend analysis for strategic planning.
Tableau’s strength lies in its ability to facilitate data-driven decision-making. Businesses using Tableau report faster responses to trends and operational challenges, avoiding reliance on outdated reports. This makes it an invaluable tool for financial management and operational reporting.
Microsoft Power BI: Versatile Business Intelligence Tool
Microsoft Power BI is a versatile software solution that excels in creating detailed, pixel-perfect reports. Its integration with other Microsoft products makes it a seamless addition to your existing workflows. Power BI supports both cloud-based and on-premises data sources, offering flexibility for businesses of all sizes.
Tip: Use Power BI’s Paginated Reports Builder to design printable reports with advanced formatting options.
Key features of Power BI include:
Paginated Reports: Ideal for creating printable, highly formatted reports.
Reusable Templates: Simplifies report creation with predefined data connections and visualizations.
Cloud Consolidation Software: Enables real-time collaboration and data sharing across teams in Malaysia.
Feature
Description
Paginated Reports
Supports pixel-perfect, printable reports optimized for printing or PDF generation.
Power BI Templates
Enables creation of reusable report templates with predefined data connections and visualizations.
Paginated Reports Builder
A standalone tool for designing pixel-perfect reports with advanced layout and formatting options.
Power BI’s ability to handle complex data analysis and reporting tasks makes it a go-to choice for businesses seeking advanced reporting solutions. Its cloud consolidation software ensures that teams in Malaysia can collaborate effectively, enhancing overall efficiency.
Looker: Cloud-Based Reporting for Real-Time Insights
Looker has emerged as one of the most powerful reporting tools for businesses seeking real-time insights. Its cloud-native platform ensures secure access to near real-time data, making it a top choice for organizations aiming to improve operational efficiency. Looker’s flexibility allows you to host it on multiple cloud platforms, including Google Cloud, AWS, and Azure, ensuring seamless integration with your existing infrastructure.
Tip: Embedding Looker’s interactive dashboards into your existing systems can enhance user engagement and streamline workflows.
Here’s why Looker stands out among the best reporting tools:
Multi-Cloud Flexibility: Host Looker on your preferred cloud platform, whether it’s Google Cloud, AWS, or Azure.
Embedded Analytics: Integrate interactive dashboards directly into your software for a smoother user experience.
Data Connectivity: Connect to over 50 SQL dialects, including Google BigQuery and Snowflake, for hybrid data environments.
Pre-Built Templates: Use Looker Blocks to accelerate the transition from raw data to actionable dashboards.
Embeds dashboards and reports into other software for enhanced usability.
Data Connectivity
Links to multiple data sources, ideal for hybrid environments.
Pre-Built Templates
Offers Looker Blocks to speed up dashboard creation.
Data Governance
Ensures secure and compliant data access with fine-grained controls.
Looker’s ability to connect to diverse data sources and provide real-time insights makes it an excellent choice for financial reporting. By embedding analytics into your workflows, you can reduce the need for separate logins and improve overall efficiency. This cloud consolidation software is ideal for businesses looking to streamline their reporting processes while maintaining flexibility and security.
JasperReports: Open-Source Format Report for Customization
JasperReports is a versatile open-source reporting software that caters to businesses requiring advanced reporting capabilities. Its flexibility allows you to create highly customized reports tailored to your specific needs. JasperReports supports integration with various data sources, making it a reliable tool for financial and operational reporting.
Note: JasperReports is particularly effective for businesses with unique reporting requirements that standard tools cannot meet.
Key features of JasperReports include:
Customizable Templates: Design reports with advanced formatting options to meet your unique business needs.
Integration with Multiple Data Sources: Connect to databases, XML, and other data formats for comprehensive data analysis.
Enables sharing in formats like PDF, Excel, and HTML.
Scalability
Handles large datasets, ideal for expanding businesses.
JasperReports excels in scenarios where customization is critical. For example, financial teams in Malaysia can use it to create detailed reports with specific KPIs, while IT departments can integrate it into existing systems for seamless data analysis. Its open-source nature makes it a cost-effective solution for businesses seeking advanced reporting tools without compromising on flexibility or functionality.
Key Features and Benefits of the Best Format Report Tools in Malaysia
User-Friendly Interfaces for Seamless Report Creation
User-friendly interfaces simplify the process of creating reports, making reporting tools accessible to everyone in your organization. Features like drag-and-drop functionality and intuitive menus reduce the learning curve, allowing you to focus on insights rather than technical complexities.
Tip: Tools with clear visualizations improve data understanding, enabling better decision-making across teams in Malaysia.
These interfaces democratize data access, fostering a data-driven culture within your organization. Simplified tools encourage participation from all team members in Malaysia, ensuring that reporting becomes a collaborative effort.
Advanced Customization Options for Tailored Reports
Customizable reporting tools allow you to design reports that align perfectly with your business needs. Whether you need financial reporting software for precise calculations or dashboards tailored to specific KPIs, advanced customization ensures your reports deliver actionable insights.
Note: Customization features save time by automating repetitive formatting tasks, letting you focus on analysis.
Flexible Templates: Pre-built templates speed up report creation while allowing modifications to suit your requirements.
Dynamic Visualizations: Interactive charts and graphs make data presentation more engaging.
Scalable Solutions: Reporting software adapts to growing data needs, ensuring long-term efficiency.
Customizable reporting tools empower you to create reports that resonate with your audience in Malaysia, whether for financial analysis or operational reviews.
Integration Capabilities with Multiple Data Sources
Modern reporting tools excel in connecting to diverse data sources, enabling comprehensive analysis tools for businesses. Integration capabilities ensure seamless data flow, reducing manual effort and enhancing efficiency.
Tip: Cloud consolidation software simplifies collaboration by centralizing data from multiple systems.
Multi-Source Connectivity: Link databases, spreadsheets, and cloud platforms for unified reporting.
Real-Time Data Access: Monitor performance metrics instantly, ensuring timely responses to challenges.
Cross-Platform Compatibility: Integrate with existing business intelligence tools for smoother workflows.
Integration capabilities transform reporting tools into powerful data analysis platforms. By connecting to multiple sources, you gain a holistic view of your operations, enabling smarter decisions and improved financial outcomes.
Cost-Effectiveness and Scalability for Businesses
Investing in the best reporting tools can save your business money while supporting growth. These tools reduce manual work, which lowers operational costs. Automated features like scheduled reporting and real-time data updates eliminate repetitive tasks. This allows you to focus on analyzing data instead of spending time on formatting or distribution.
Scalability is another key advantage of modern reporting tools. As your business grows, your data needs will expand. Reporting software adapts to handle larger datasets and more complex requirements. For example, FineReport offers scalable solutions that grow with your business. It supports large-scale data integration and advanced analytics, ensuring your reporting processes remain efficient.
Cloud-based reporting tools, such as Looker, provide additional cost savings. You avoid the need for expensive hardware or maintenance. Cloud consolidation software centralizes your data, making it accessible from anywhere. This flexibility supports remote teams and enhances collaboration.
Many tools also offer flexible pricing models. You can choose plans that match your current needs and upgrade as your business grows. This ensures you only pay for what you use, making these tools a cost-effective choice for businesses of all sizes.
Tip: Use reporting tools with pre-built templates to save time and reduce costs. Templates simplify report creation, especially for financial tasks like budgeting or forecasting.
By choosing the right reporting tools, you can improve financial management and streamline operations. These tools not only save money but also prepare your business for future growth.
How to Choose the Right Format Report Tool for Your Needs in Malaysia
Assessing Your Format Report Requirements
Choosing the right reporting tools begins with understanding your report formatting needs. Different business scenarios demand diverse formats, whether for operational dashboards or detailed financial reports. Start by identifying the type of data you need to present. For example, tables work well for structured comparisons, while charts highlight trends effectively.
Criteria
Description
Selection of Formats
Choose between tables, charts, or narratives to enhance readability and comprehension.
Clarity of Presentation
Use simple language and visual aids like graphs to depict trends for better understanding.
Context and Audience
Provide context and commentary to explain data, ensuring clarity and focus on objectives.
Example for Operational Report
Utilize a dashboard format to present key performance indicators (KPIs) effectively.
To refine your approach, set clear goals for your reports. Formulate specific questions to focus on relevant data. Shift from broad data collection to targeted insights that align with your objectives. This strategy ensures your reporting tools deliver actionable results, whether for financial analysis or operational reviews.
Evaluating Budget and Cost Considerations
Budget plays a crucial role in selecting the best reporting tools. Start by assessing the total cost of ownership, including licensing fees, training, and maintenance. Cloud-based software often provides cost-effective solutions, eliminating the need for expensive hardware. For example, cloud accounting software centralizes financial data, reducing operational costs.
Consider scalability when evaluating costs. Tools like FineReport adapt to growing data needs, ensuring long-term efficiency. Flexible pricing models allow you to pay for features you need now and upgrade as your business expands. This approach minimizes waste and maximizes value.
Tip: Opt for software with pre-built templates to save time and reduce costs. Templates simplify report creation, especially for financial performance management tasks like budgeting or forecasting.
Ensuring Compatibility with Existing Workflows
Compatibility ensures reporting tools integrate seamlessly into your current workflows. Check if the software supports your existing systems, such as databases or cloud platforms. Tools with multi-source connectivity simplify data analysis by linking spreadsheets, databases, and cloud-based software.
Real-time data access is another critical factor. Reporting tools that provide instant updates help you monitor financial performance management metrics effectively. For example, cloud-based software like Looker enhances collaboration by centralizing data, making it accessible to remote teams in Malaysia.
Note: Prioritize tools with intuitive interfaces to reduce the learning curve. This ensures your team in Malaysia can adopt the software quickly and focus on financial analysis and decision-making.
Prioritizing Ease of Use and Learning Curve
When choosing a reporting tool, ease of use should be one of your top priorities. A tool with a steep learning curve can slow down adoption and reduce productivity. On the other hand, user-friendly software allows you to focus on analyzing data rather than struggling with the tool itself.
Tip: Look for tools with drag-and-drop functionality and intuitive interfaces. These features make it easier for everyone on your team in Malaysia to create reports, even without technical expertise.
Here are some key aspects to consider:
Interface Design: Tools with clean, well-organized interfaces help you navigate effortlessly. A clutter-free design reduces confusion and speeds up your workflow.
Onboarding Resources: Tutorials, guides, and customer support can significantly shorten the time it takes to learn a new tool.
Pre-Built Templates: Ready-to-use templates save time and eliminate the need to start from scratch.
Collaboration Features: Tools that allow multiple users to work on reports simultaneously improve teamwork and efficiency in Malaysia.
Feature
Benefit
Drag-and-Drop Functionality
Simplifies report creation for all users
Pre-Built Templates
Saves time and ensures consistency
Tutorials and Guides
Reduces the learning curve
Collaboration Tools
Enhances teamwork and productivity
Ease of use doesn’t just benefit beginners. Even experienced users appreciate tools that streamline repetitive tasks. For example, FineReport’s Excel-like interface and automated scheduling features make it accessible to both new and advanced users in Malaysia.
By prioritizing tools with a low learning curve, you empower your team in Malaysia to adopt them quickly. This ensures that your organization can start benefiting from better reporting and data-driven decisions without unnecessary delays.
Comparison of the Best Format Report Tools
Feature-by-Feature Comparison of Top Tools
When selecting reporting tools, understanding their strengths and weaknesses helps you make an informed decision. Here’s a comparison of some top tools in 2026:
Tool Name
Strengths
Weaknesses
SAS Viya
Advanced machine learning, strong data governance, flexible deployment
This table highlights how each tool excels in specific areas in Malaysia. For example, SAS Viya offers robust machine learning capabilities, while Datarails specializes in financial insights. However, consider the weaknesses, such as high costs or limited applications, to ensure the tool aligns with your needs in Malaysia.
Pros and Cons of Each Format Report Tool
Every reporting tool has unique advantages and limitations. Here’s a closer look:
Cons: Requires a steep learning curve for beginners.
Microsoft Power BI:
Pros: Seamless integration with Microsoft products and cloud-based collaboration.
Cons: Limited advanced customization compared to other tools.
Looker:
Pros: Real-time insights and multi-cloud flexibility.
Cons: Higher dependency on cloud infrastructure.
JasperReports:
Pros: Open-source flexibility and extensive customization.
Cons: Requires technical expertise for optimal use.
Understanding these pros and cons ensures you choose a tool that complements your business goals.
Best Use Cases for Different Business Scenarios
Different tools shine in specific scenarios. Here’s how you can match them to your needs:
FineReport: Ideal for enterprises needing precise, pixel-perfect reports for financial analysis or operational reviews.
Tableau: Best for businesses prioritizing data visualization and storytelling, such as marketing or sales teams in Malaysia.
Microsoft Power BI: Perfect for organizations already using Microsoft software, especially for collaborative financial reporting.
Looker: A great choice for companies requiring real-time insights and embedded analytics in hybrid environments.
JasperReports: Suitable for IT teams or developers in Malaysia needing highly customized reports integrated into existing systems.
Selecting the right tool depends on your specific requirements, whether it’s financial reporting, operational dashboards, or advanced data visualization.
Tips for Using Format Report Tools Effectively in Malaysia
Leveraging Pre-Built Templates for Efficiency
Pre-built templates simplify report generation by providing a structured framework for your data. These templates save time and ensure consistency, especially when creating financial reports or project updates. Many reporting tools include templates designed for specific purposes, such as operational dashboards or status reports.
Template Type
Benefits
Reports
Standardizes data presentation, ensuring all necessary elements are included for clarity.
Project Management Templates
Guides teams in Malaysia through planning, execution, and review stages, enhancing organization.
Status Reports
Keeps stakeholders updated with structured information, improving transparency and accountability.
Using templates reduces the effort required to format reports manually. This allows you to focus on analyzing data and making informed decisions. For financial reporting, templates ensure that key metrics are presented clearly, helping stakeholders in Malaysia understand performance trends.
Automating Repetitive Reporting Tasks
Automation transforms how you use reporting tools by handling routine tasks efficiently. Instead of spending hours on manual data entry or scheduling, you can rely on software to complete these tasks automatically. This approach improves productivity and accuracy while reducing costs.
Increased Productivity: Automation allows businesses to accomplish more in less time by handling routine tasks like data entry and scheduling.
Cost Reduction: It leads to substantial savings by minimizing the need for manual labor, allowing funds to be redirected to other critical areas.
Improved Accuracy: Automation reduces human error, ensuring consistency and accuracy in repetitive tasks, which is crucial for effective reporting.
For example, automating the distribution of financial reports ensures stakeholders receive updates on time. This eliminates delays and enhances transparency across your organization in Malaysia.
Staying Updated with New Features and Enhancements
Reporting tools evolve constantly, with new features designed to improve efficiency and functionality. Staying updated with these enhancements ensures you maximize the value of your software in Malaysia. Regular updates often include advanced visualization options, improved data integration, and enhanced security features.
You can subscribe to newsletters or attend webinars hosted by software providers to stay informed. Many tools also offer in-app notifications about updates. By exploring these features, you can discover ways to streamline report generation or enhance financial analysis in Malaysia. For instance, adopting a newly introduced dashboard feature might help you visualize trends more effectively in Malaysia.
Keeping your software updated not only boosts productivity but also ensures compatibility with the latest data sources and technologies.
Selecting the right reporting tools can transform how you handle data in 2025. Tools like FineReport, Tableau, and Power BI offer unique features that cater to diverse business needs. Whether you require financial precision or dynamic dashboards, these tools provide solutions that enhance efficiency and decision-making in Malaysia.
To optimize your format report processes, consider these factors:
Factor
Importance
Select the appropriate format
Choosing formats that enhance data interpretation is crucial, as some data fits better in specific formats.
Consider the organization’s structure
Understanding the organization’s structure aids in selecting a tool that aligns with work styles.
Recognize your target
Knowing the familiarity of report recipients helps in choosing a tool that matches their complexity needs.
Examine your reporting resources
Familiarizing with the tool's functions maximizes the resources available for reporting.
Experiment with these software options to find the best reporting tools for your goals. By doing so, you can streamline workflows, improve accuracy, and unlock new insights for your business.
Click the banner below to try FineReport for free and empower your enterprise to transform data into productivity!
Real-time insights to optimize production, logistics, and decisions.
FAQ
What is the best reporting tool for beginners?
FineReport is ideal for beginners. Its drag-and-drop interface simplifies report creation. You can quickly connect data sources and generate reports without advanced technical skills. The Excel-like design makes it easy to learn and use.
Can reporting tools handle real-time data?
Yes, tools like Looker and FineReport support real-time data integration. You can monitor metrics instantly and make timely decisions. These tools ensure your reports stay updated with the latest information.
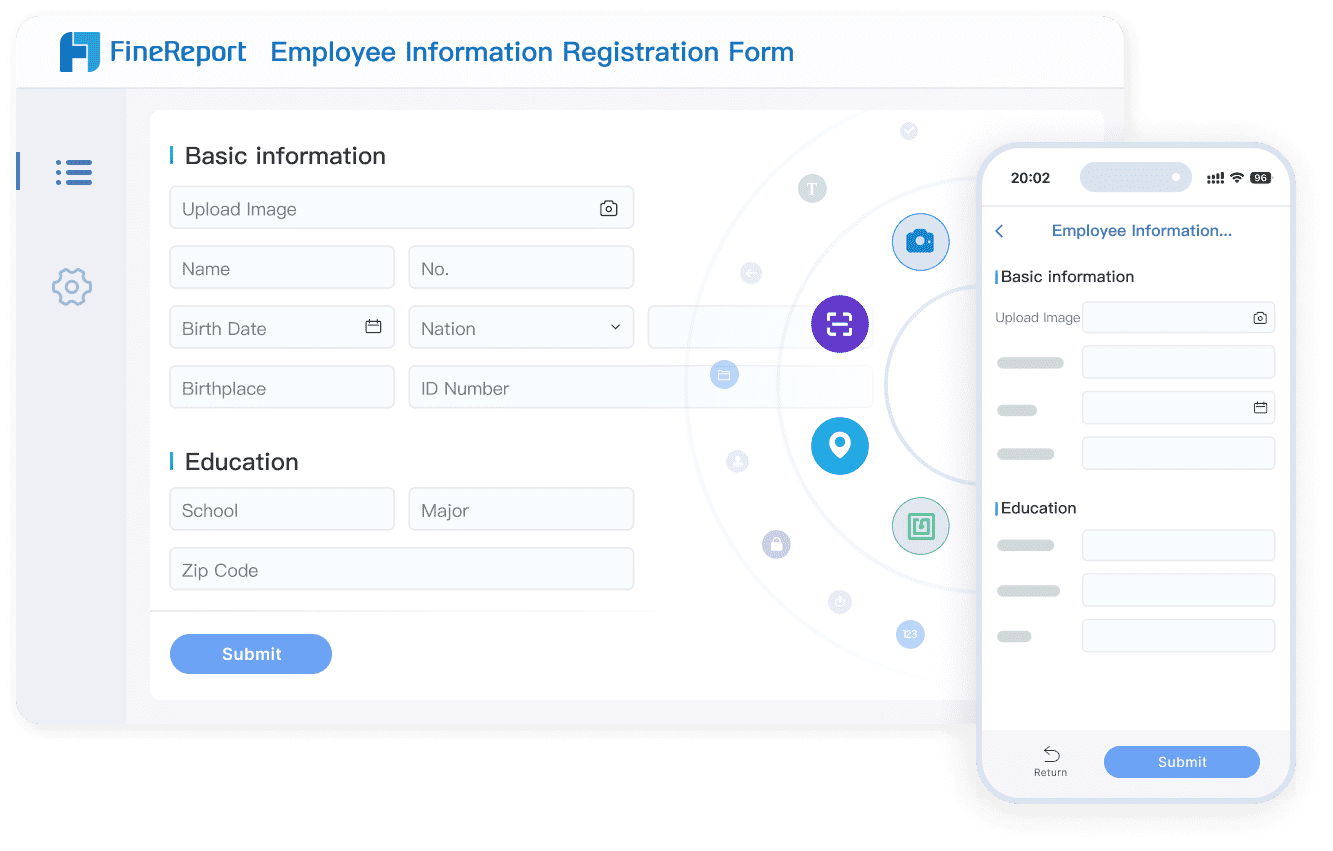
Are reporting tools compatible with mobile devices?
Many tools, including FineReport, offer mobile compatibility. You can access reports and dashboards on iOS or Android devices. This feature lets you track business performance anytime, anywhere.
How do reporting tools improve efficiency?
Automation features like scheduled reporting reduce manual tasks. Tools like FineReport streamline workflows, saving time and minimizing errors. You can focus on analyzing data instead of formatting reports.
Can I customize reports for specific business needs?
Absolutely! Tools like JasperReports and FineReport allow advanced customization. You can tailor reports to match your KPIs, metrics, or branding. This flexibility ensures your reports meet unique requirements.