Research analysis tools help you organize, process, and interpret academic research with efficiency. You use these research analysis tools to manage quantitative data, streamline extraction, enhance discovery, and improve research productivity. These tools for research analysis support academic literature review, research paper writing, and citation management, making them essential for researchers and professionals.
Here are 11 top research tools for academic research and professional work: FineReport, FineBI, NVivo, MAXQDA, ATLAS.ti, Qualtrics, SurveyMonkey, Litmaps, SPSS, Thunderbit, ResearchPal.
Recent studies show that 73.6% of researchers use AI tools for academic writing, literature review tools, and data analysis tools to boost academic writing and research outcomes.
Tool Type
Impact on Research Outcomes
Literature Review Tools
Streamline the process, saving time and enhancing efficiency
Enhance writing quality and organization of information
Criteria for Choosing Tools for Research Analysis
When you selectresearch analysis tools, you need to focus on several essential criteria. These factors help you find the right fit for your academic or professional research needs, whether you use FineReport, FineBI, or other leading solutions.
Data Compatibility
You should check if the research analysis tools support your data types. Some tools handle structured data, while others work with unstructured or large-scale datasets. FineReport and FineBI both offer broad compatibility, connecting to databases, spreadsheets, and cloud sources. Data security and scalability also matter, especially when you manage sensitive or growing datasets.
Usability and Interface
A user-friendly interface makes your research analysis tools more accessible. Look for features like drag-and-drop dashboards, automated reporting, and real-time analytics. Many tools now include AI insights and mobile app testing. The table below highlights common usability features:
Usability Feature
Description
Automated reporting
Streamlines the reporting process
AI insights
Provides automated analysis and recommendations
Live sharing
Enables real-time collaboration
Analytics dashboard
Centralizes insights for easy review
Collaboration Features
Effective research analysis tools support teamwork. You want options for sharing dashboards, co-authoring reports, and managing permissions. FineReport and FineBI allow you to collaborate across departments, making it easier for professionals to work together. Many top tools offer shared workspaces, scheduled reports, and workflow sharing.
Integration with other platforms is vital. Research analysis tools should connect with databases, APIs, and third-party applications. FineReport and FineBI provide extensive integration options, supporting both traditional and cloud environments. Leading tools offer pre-built connectors, real-time data management, and support for custom extensions.
Pricing and Accessibility
You need to consider your budget and access needs. Some research analysis tools offer free plans or trials, while others require subscriptions. Evaluate the cost against features like scalability, user limits, and support. Accessibility features, such as mobile compatibility and role-based permissions, ensure everyone on your team can use the tool effectively.
By focusing on these criteria, you can choose research analysis tools that align with your workflow and help you achieve better research outcomes.
Overview of Top Tools for Research Analysis
When you explore tools for research analysis, you discover a wide range of solutions designed to streamline your workflow, enhance data interpretation, and support collaboration. Each tool offers unique features that cater to different research needs, whether you work in academia or a professional setting. Below, you will find an overview of themost effective research analysis toolsavailable today.
FineReport stands out among advanced research analysis tools for its flexibility and robust capabilities. You can create pixel-perfect reports, interactive dashboards, and dynamic visualizations with ease. The intuitive drag-and-drop interface allows you to design complex reports without coding. FineReport connects to multiple data sources, including databases, spreadsheets, and cloud platforms, making it a versatile choice for research analysis tools.
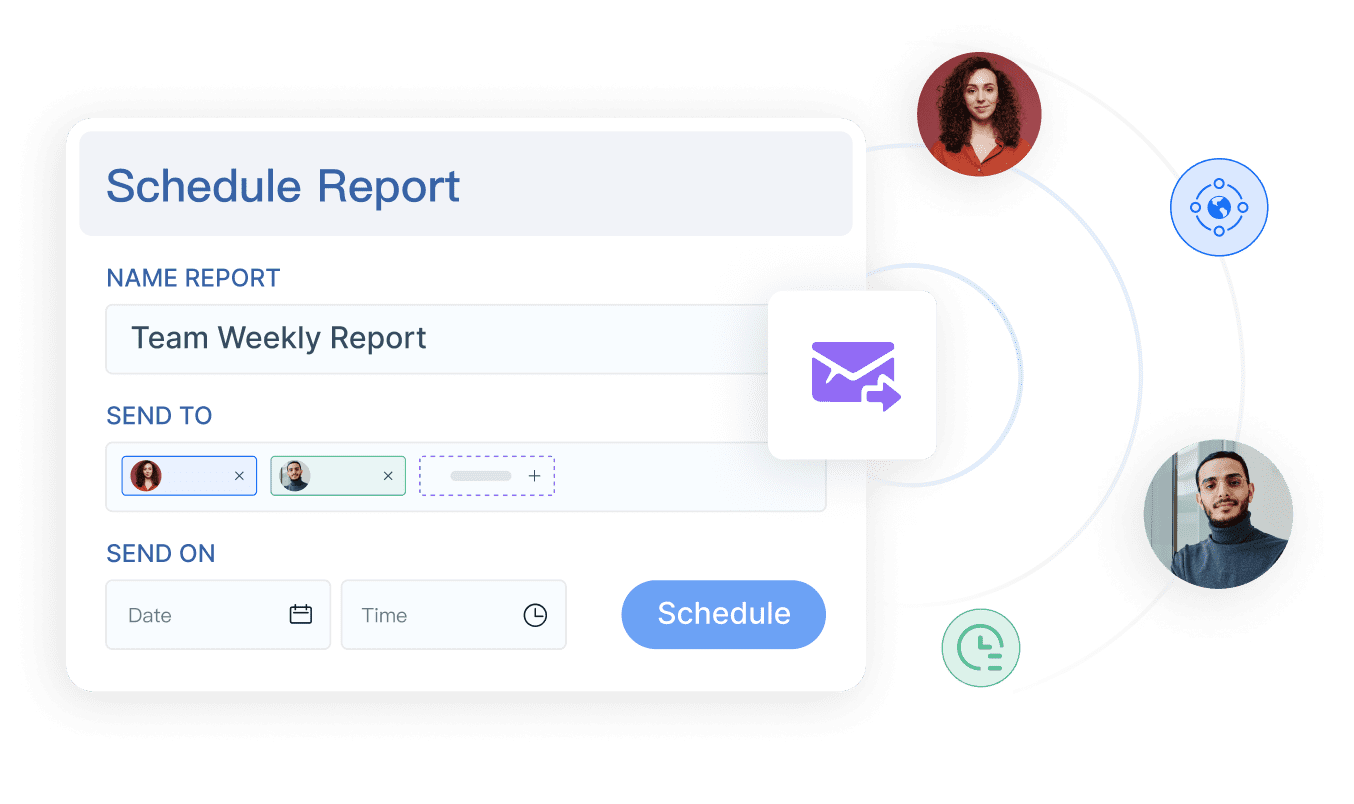
You benefit from features such as automated report generation, scheduled distribution, and mobile BI access. FineReport’s decision-making platform centralizes your reports and dashboards, supporting strategic planning and operational management. The platform’s permission controls ensure data security and integrity across your organization.
FineReport’s unique features set it apart from other research analysis tools:
Creates interactive and informative visual data representations.
Decision-making Platform
Supports strategic decision-making processes.
Mobile BI
Provides business intelligence capabilities on mobile devices.
Visual Chart
Offers advanced data visualization options for better insights.
Data Collection
Efficiently gathers and integrates data.
Deployment & Integration
Seamlessly integrates with other systems and deployment options.
FineReport empowers you to manage large datasets, automate reporting, and collaborate across teams. You can use it for academic research, business intelligence, and operational analysis.
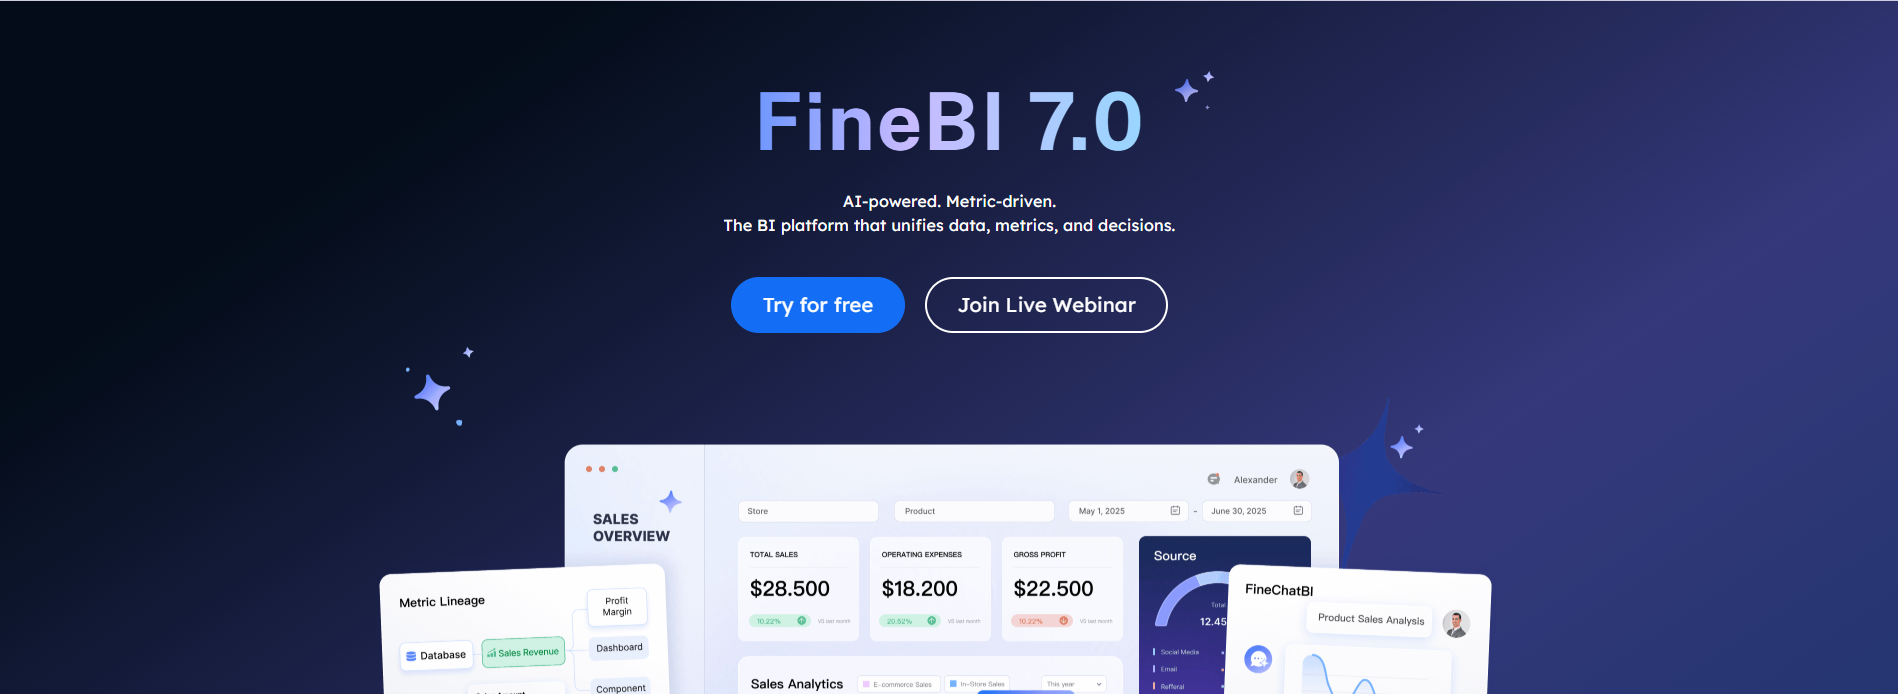
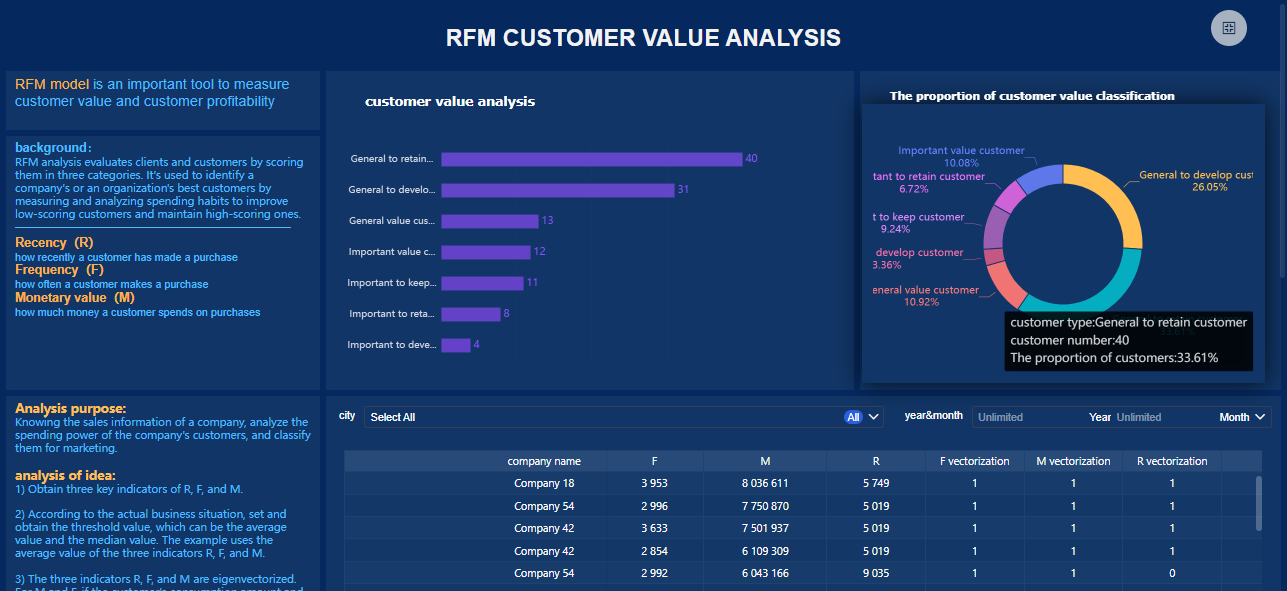
FineBI is another leader amongadvanced research analysis tools. You use FineBI to connect, prepare, analyze, and visualize data from diverse sources. The platform’s self-service analytics enable you to create interactive dashboards and reports without technical expertise. FineBI’s modular architecture adapts to any research scenario, from ad-hoc reporting to enterprise-wide decision intelligence.
You can take advantage of features such as real-time data processing, intuitive drag-and-drop dashboard creation, and advanced visualization components. FineBI supports secure data sharing, role-based permissions, and mobile access, making it ideal for collaborative research environments.
FineBI’s core features for research analysis tools include:
Feature
Benefit
Data Visualization
Converts data into visual forms like tables, charts, and maps.
Intuitive Interface
Enables report creation without complex technical expertise.
Real-time Processing
Ensures decisions are based on the latest data.
Custom Dashboards
Allows for tailored dashboards to meet specific research needs.
Advanced Visualization
Enhances analytical experience with filter components and linkage features.
FineBI’s user-friendly design lets you quickly generate actionable reports. The platform’s real-time processing ensures you always work with the most current data, which is essential for effective analysis and decision-making.
Intuitive drag-and-drop interface for quick report creation.
No need for complex technical skills.
Real-time data processing for up-to-date decision-making.
Highly customizable dashboards for specific research applications.
FineBI's Rich Built-in Charts For Data Visualization
NVivo is a top choice among advanced research analysis tools for qualitative data analysis. You use NVivo to organize, code, and analyze text, audio, video, and image data. The software provides a structured approach to qualitative research, ensuring rigorous analysis and efficient workflow management.
NVivo stores all your data in one place, making it easy to access and back up information. You can work with different types of qualitative data and perform sub-group analysis to compare participant groups. NVivo helps you save time during analysis and write-up phases, increasing your productivity.
NVivo’s primary use cases in academic research include:
Providing an organized and structured approach to qualitative data analysis.
Storing all information in one place for easy access and backup.
Enabling effective work with various qualitative data formats.
Facilitating sub-group analysis for comparisons.
Enhancing efficiency during analysis and write-up.
NVivo supports collaboration and ensures your research findings are reliable and well-documented.
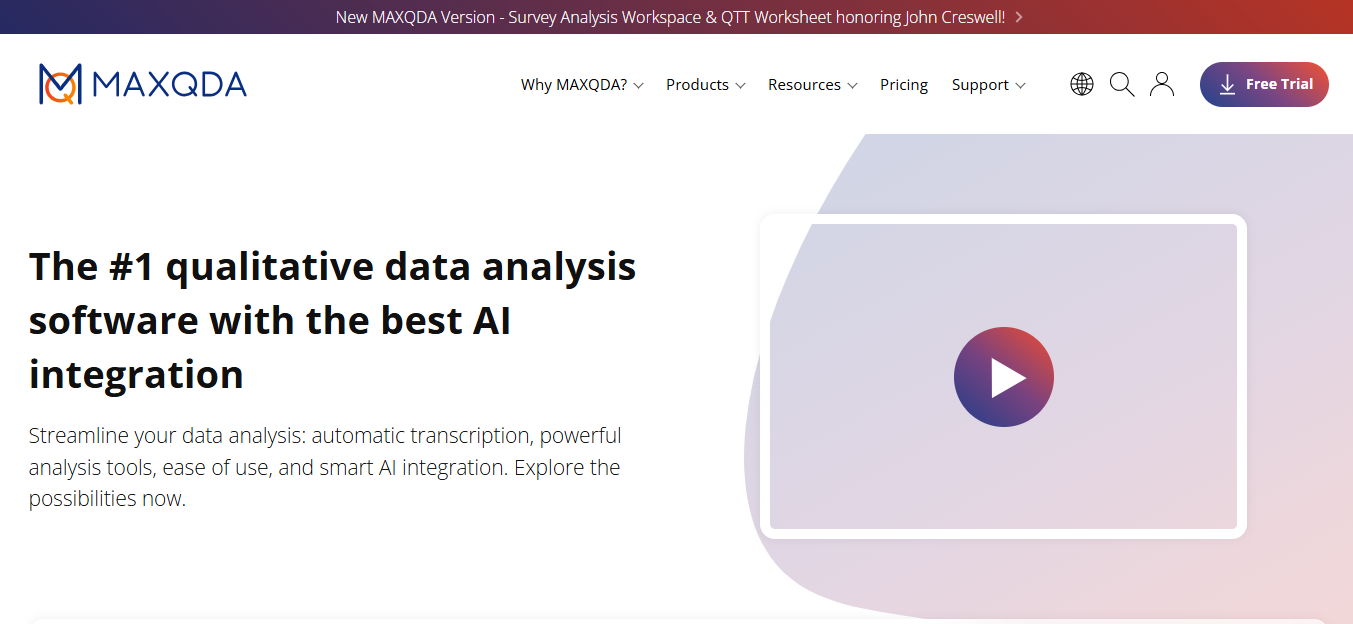
MAXQDA is another essential tool among advanced research analysis tools for qualitative research. You use MAXQDA to import, code, and analyze unstructured data, including text, images, and multimedia files. The intuitive interface simplifies the analysis process, allowing you to organize data into meaningful insights.
MAXQDA supports thematic, content, and discourse analysis, ensuring consistency in coding and categorizing data. You can collaborate with other researchers and generate visual reports to present your findings effectively.
MAXQDA provides an intuitive interface that simplifies analysis.
It offers robust features for structured and efficient qualitative data analysis.
The software supports various types of analysis, including thematic, content, and discourse analysis.
MAXQDA allows for the organization of unstructured data into meaningful insights.
It ensures consistency in coding and categorizing data, enhancing the reliability of findings.
You can perform the following tasks with MAXQDA:
Import and explore data using drag-and-drop.
Search data with local and text search functionalities.
Code data by assigning descriptive labels to segments.
Analyze data by activating documents and retrieving coded segments.
Create visualizations to demonstrate data connections and findings.
MAXQDA structures unstructured data, enhances collaboration, and generates visual reports for effective communication.
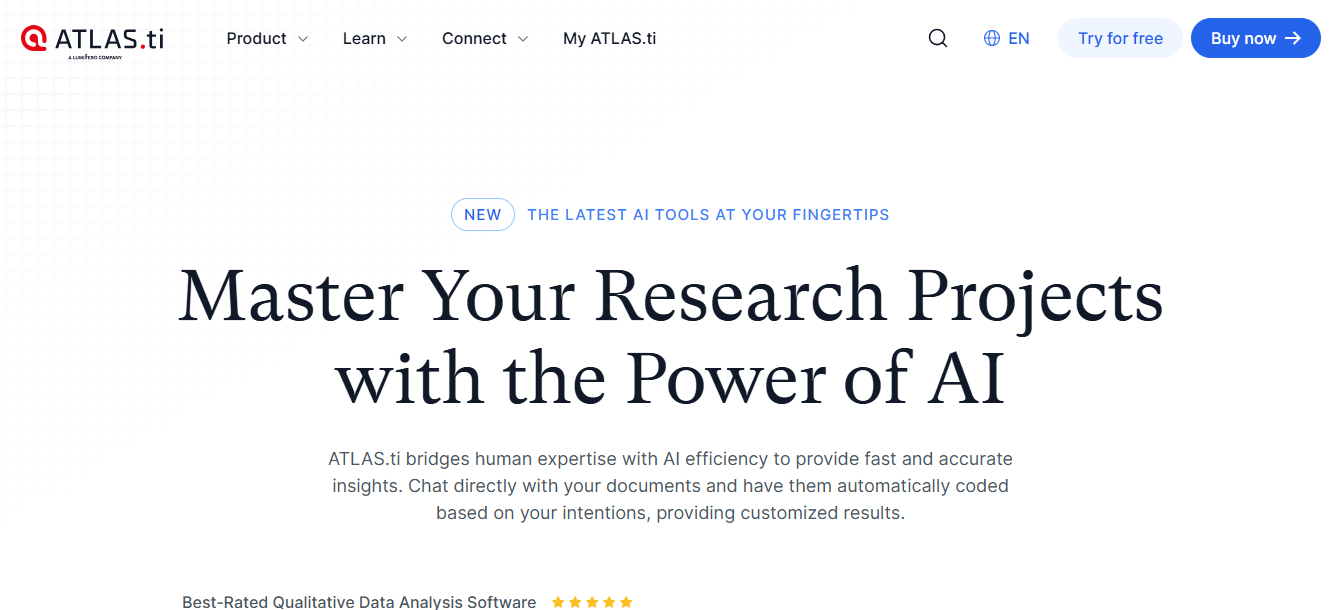
ATLAS.ti ranks high among advanced research analysis tools for qualitative and mixed-methods research. You use ATLAS.ti to analyze text, PDFs, multimedia files, and more. The platform offers robust analysis capabilities, offline access, and real-time collaboration features.
ATLAS.ti’s AI-powered analysis accelerates productivity by reducing manual tasks. You can create compelling visualizations and reports to communicate your research effectively. The intuitive user interface ensures a seamless experience across all platforms.
Advantage
Description
Robust analysis capabilities
Work with all data types – from text and PDFs to multimedia files.
Offline access
Analyze your data without the need for internet connectivity.
Real-time collaboration
Work simultaneously with team members on the same project.
AI-powered analysis
Utilize AI features like Conversational AI and AI Code Suggestions.
Intuitive user interface
Enjoy a seamless and user-friendly experience across all platforms.
Strong support for users
Benefit from live support from a team of experts to assist you.
Accelerate productivity with AI by reducing manual tasks.
Create compelling visualizations and reports.
Use advanced tools to reveal patterns and connections.
ATLAS.ti helps you uncover patterns, collaborate with your team, and present your findings with clarity.
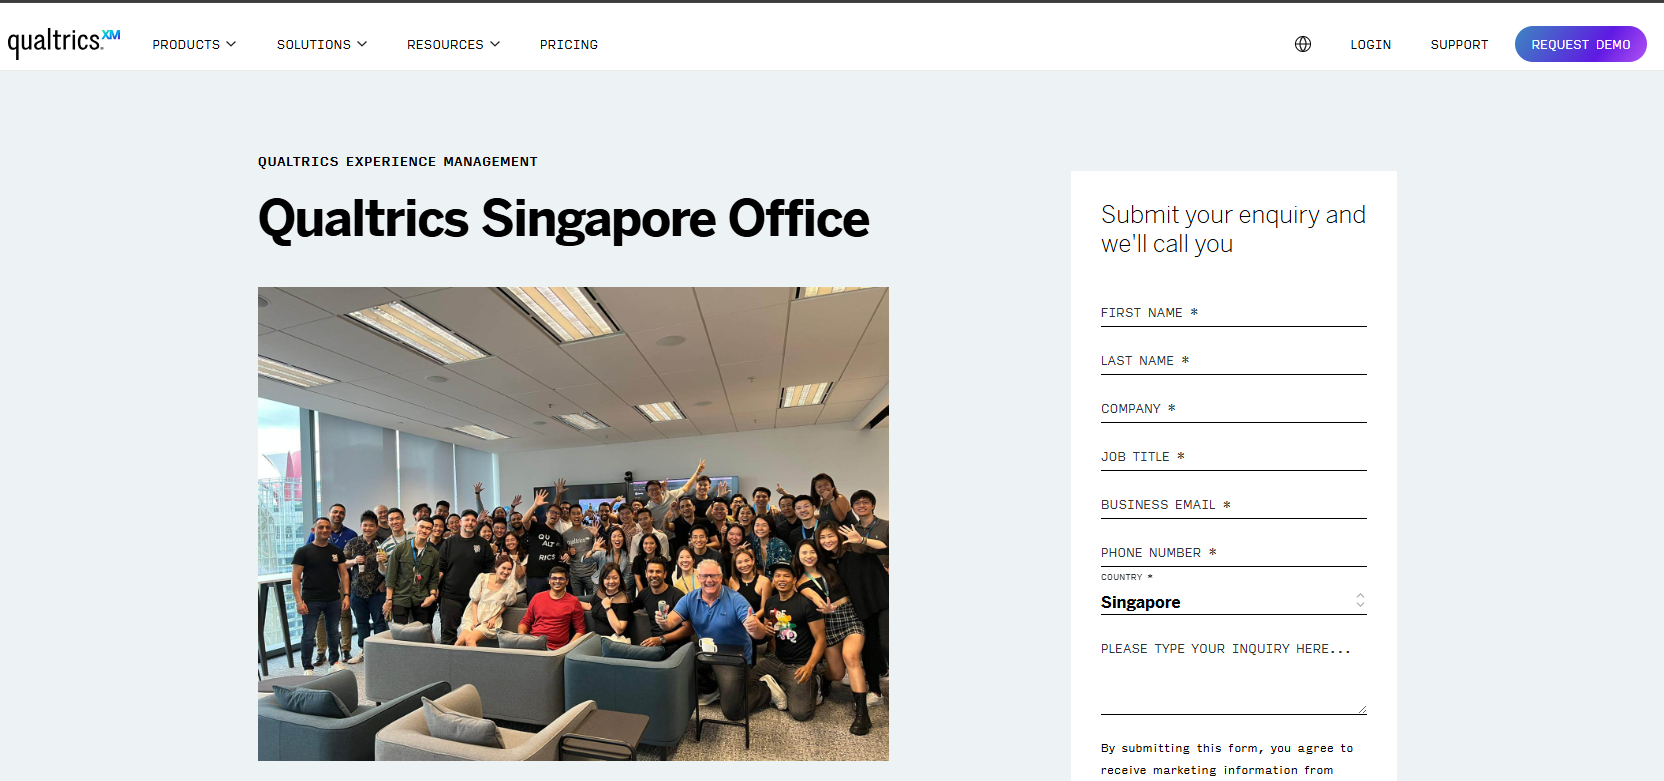
Qualtrics is a leading platform among research analysis tools for survey-based research. You use Qualtrics to design surveys, implement logic for respondent pathways, and visualize data through comprehensive reports. The platform supports best practices in question design, ensuring valid data collection.
Qualtrics facilitates collaboration among researchers, allowing you to work together throughout the survey process. The platform’s advanced features help you collect, analyze, and interpret survey data efficiently.
Functionality
Description
Survey Creation
Tools for designing surveys with various question types.
Logic Implementation
Implements logic for respondent pathways.
Data Visualization
Generates reports to visualize data effectively.
Best Practices
Supports best practices in question design for valid data collection.
Collaboration
Facilitates collaboration among researchers in the survey process.
Qualtrics streamlines survey creation, data analysis, and collaboration, making it a preferred choice for academic and professional research.
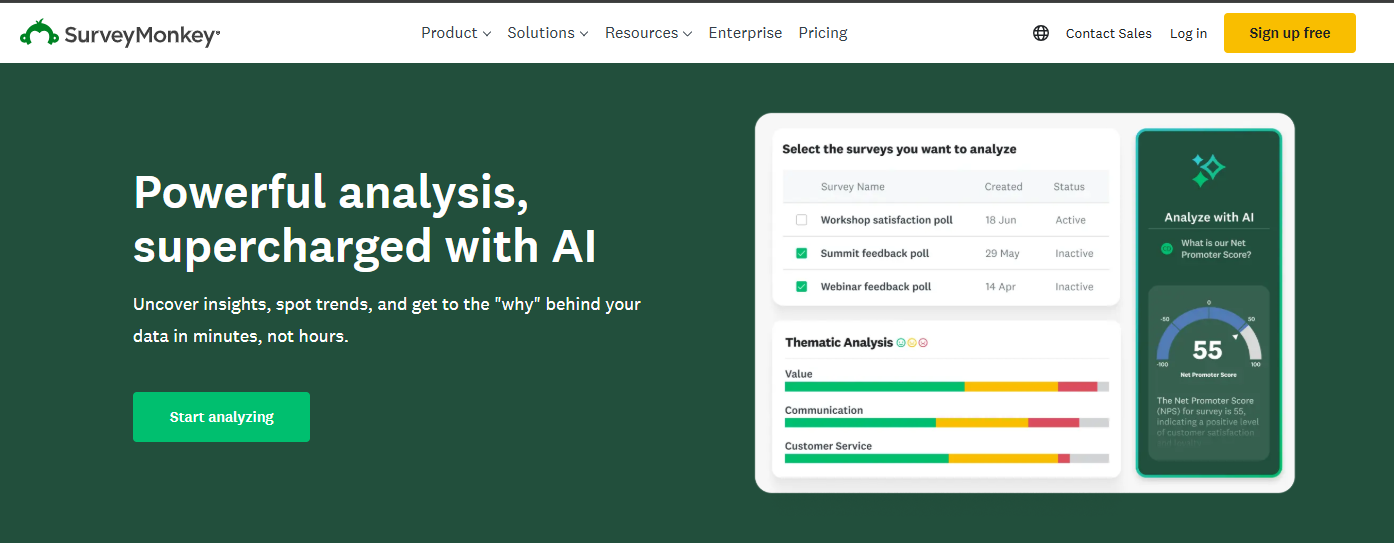
SurveyMonkey is one of the most popular research analysis tools for data collection and survey management. You use SurveyMonkey to create, distribute, and analyze surveys with ease. The user-friendly interface makes survey creation accessible for all users, while customization options allow you to tailor surveys to your specific needs.
SurveyMonkey provides robust reporting capabilities, integration with other platforms, and multiple question types for comprehensive data collection. You can distribute surveys via email, web links, and social media, increasing your reach and response rates.
Feature
Description
User-friendly interface
Easy to navigate, making survey creation accessible for all users.
Customization options
Tailor surveys to specific needs, enhancing engagement.
Robust reporting capabilities
Detailed analysis and reporting tools for effective data interpretation.
Integration with other tools
Connects with various platforms for seamless data management and sharing.
Multiple question types
Supports close-ended, open-ended, and descriptive questions.
Survey distribution methods
Send surveys via email, web links, social media, and more.
Real-time analysis
Results available as respondents complete surveys.
Customer support
24/7 assistance available for users.
SurveyMonkey’s real-time analysis and customer support ensure you can collect and interpret data efficiently.
Recent surveys show that SurveyMonkey, SurveyKing, and Alchemer are among the most widely used research analysis tools in academic and professional settings.
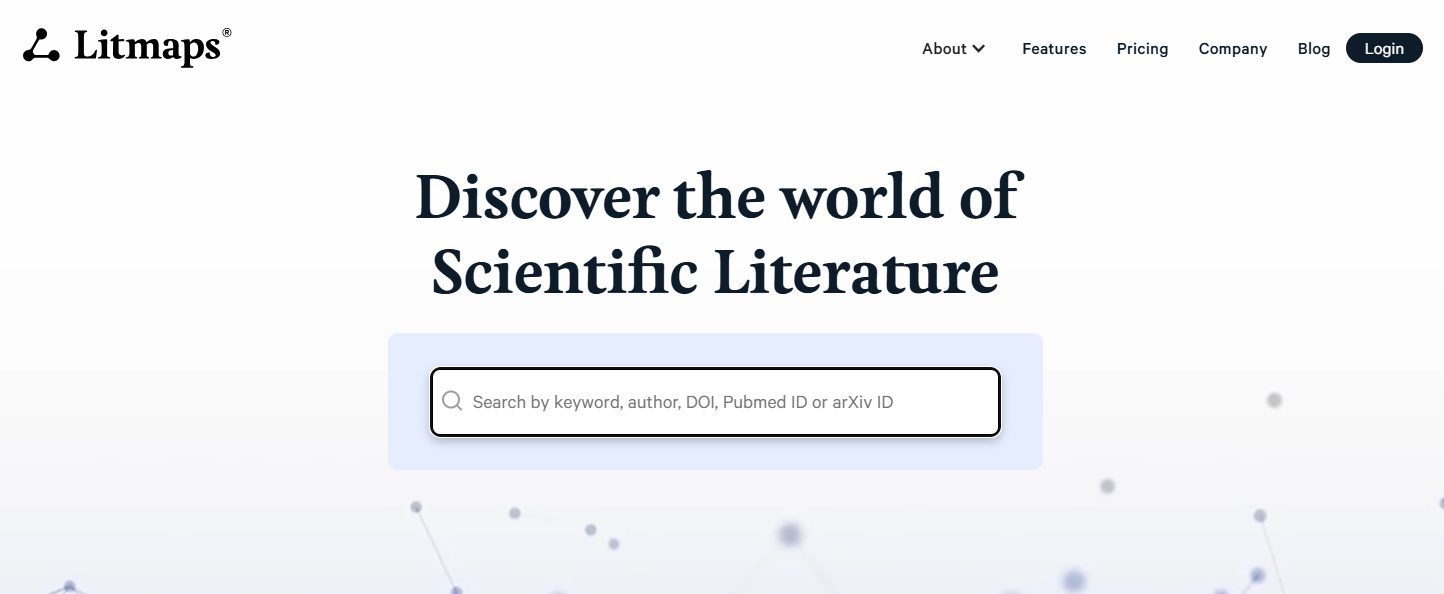
Litmaps is a specialized tool among advanced research analysis tools for mapping and visualizing academic literature. You use Litmaps to visualize connections between articles through citation and reference mapping. The platform’s Litmap feature helps you identify gaps in research and organize literature effectively.
Litmaps enables you to prioritize readings and understand the landscape of your field. You can use it to track the development of research topics, discover influential works, and plan your literature review strategy.
Litmaps assists you in visualizing connections between articles, identifying gaps, and organizing literature for efficient research.
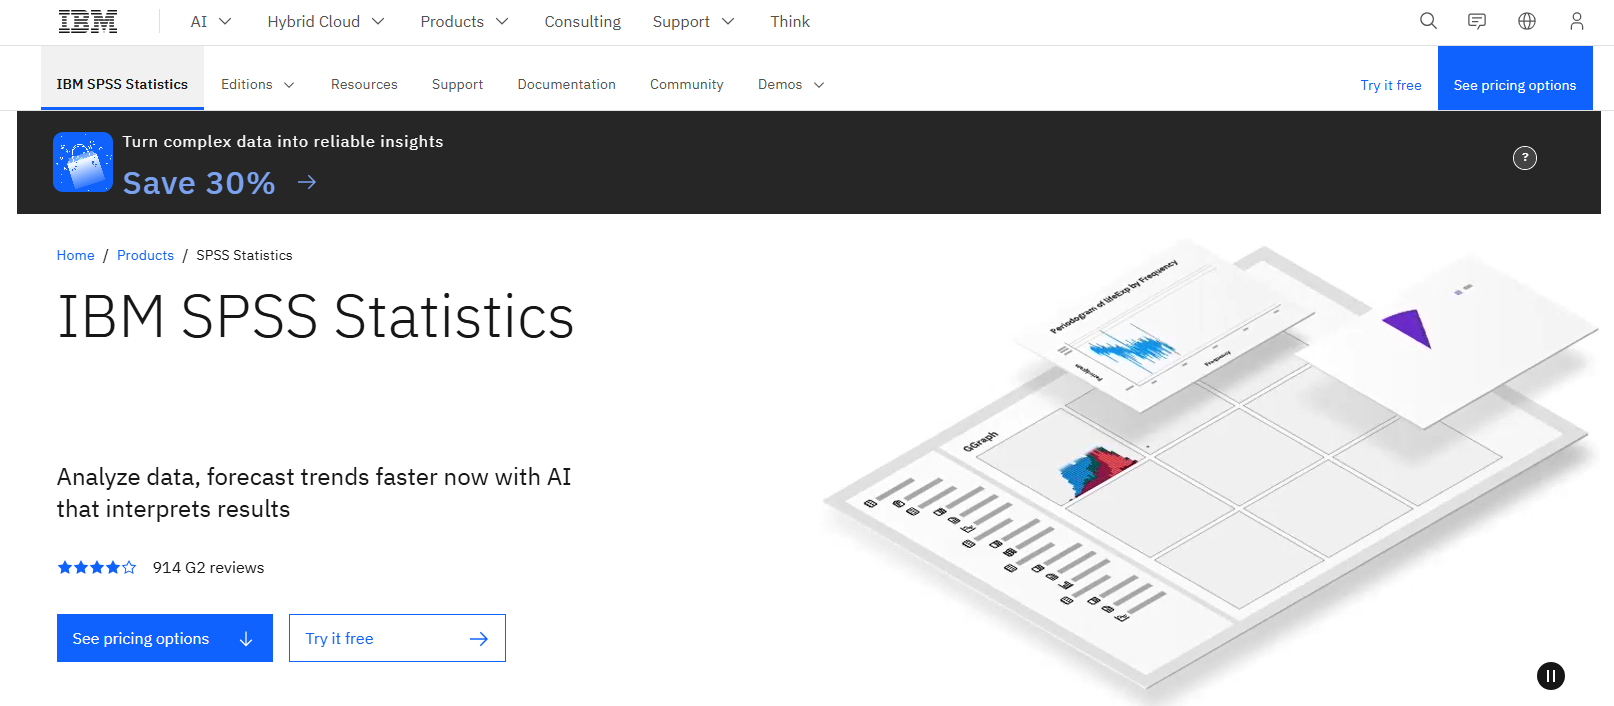
SPSS is a powerful statistical software among advanced research analysis tools for quantitative research. You use SPSS to analyze large datasets, conduct regression and correlation analyses, and perform inferential statistics such as t-tests and ANOVA. The platform offers graphical representations of findings and built-in validation options to ensure accuracy.
Statistical Analysis Type
Description
Descriptive Statistics
Mean, standard deviation, frequencies
Inferential Analysis
t-tests, ANOVA, chi-square, etc.
Regression
Correlation and regression modeling
Reliability Analysis
Cronbach’s Alpha
Data Cleaning and Preparation
Essential for accurate analysis
Analyze large datasets with ease.
Conduct regression, correlation, ANOVA, and more.
Generate graphical representations of findings.
Ensure accuracy through built-in validation options.
SPSS supports comprehensive data analysis, making it a staple in academic and professional research.
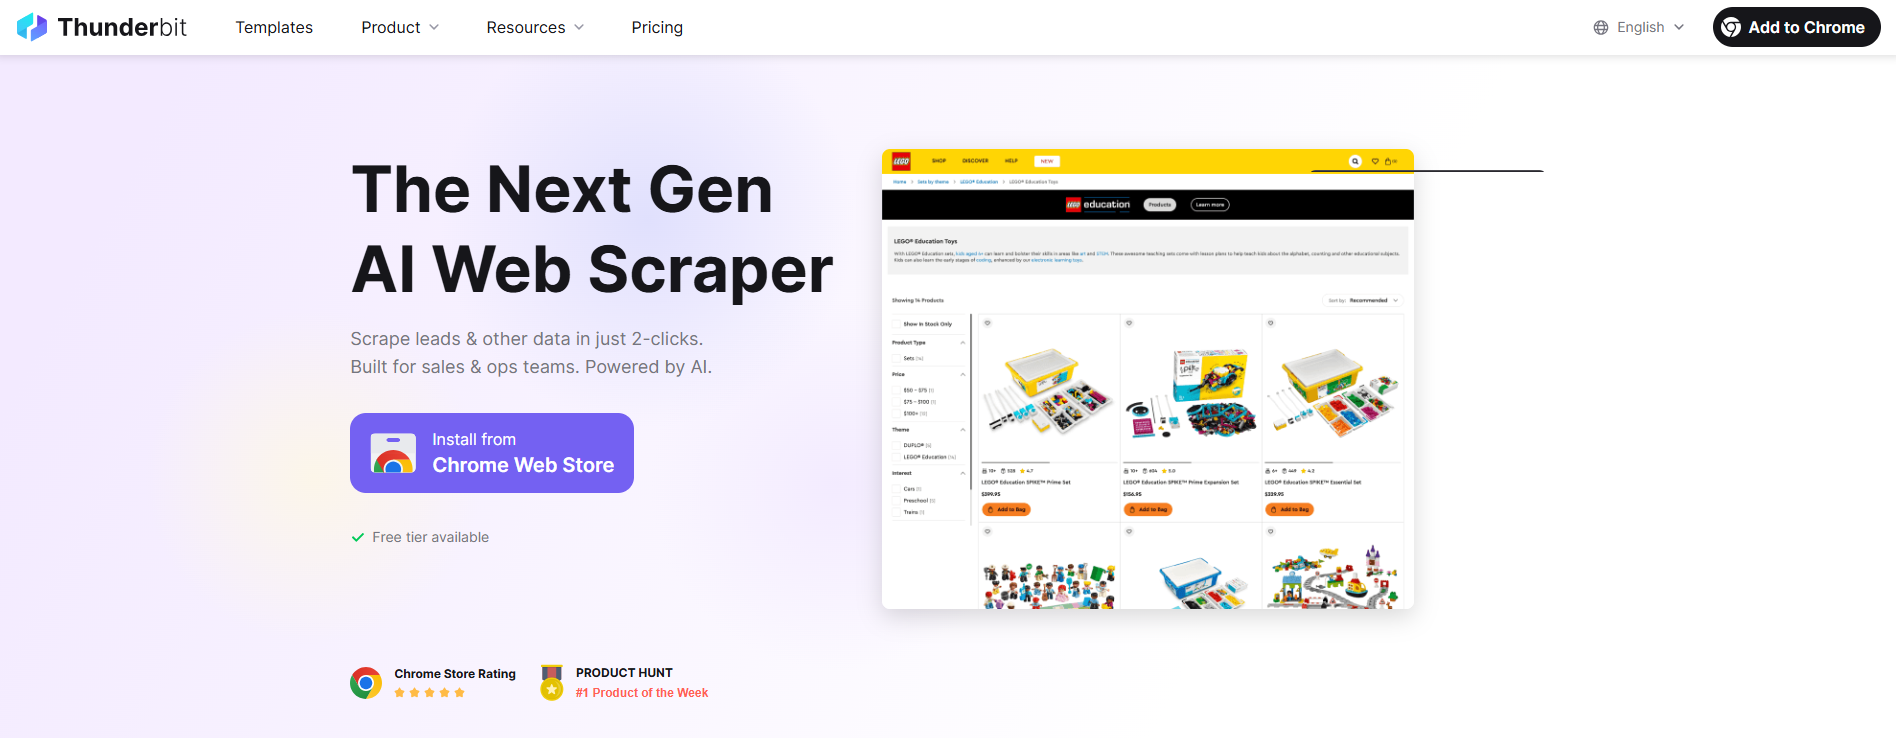
Thunderbit is an innovative platform among advanced research analysis tools for data extraction and automation. You use Thunderbit to scrape data from websites, PDFs, images, and more. The AI-powered column suggestion feature recommends data columns for extraction based on webpage analysis.
Thunderbit supports natural language queries, allowing you to specify data extraction requests in plain English. The platform offers pre-built templates for popular websites and flexible export options to tools like Excel, Google Sheets, and Notion.
Feature
Description
AI-Powered Column Suggestion
Recommends data columns for extraction based on webpage analysis.
Natural Language Queries
Specify data extraction requests using plain English terms.
Multi-Format Support
Scrape data from HTML, PDFs, images, and more.
Subpage Scraping
Automate navigation and data extraction from multiple pages.
Pre-built Templates
One-click data extraction templates for popular websites.
Flexible Export Options
Export scraped data to Excel, Google Sheets, and Notion.
Thunderbit streamlines data extraction and integration, enhancing your research analysis workflow.
ResearchPal is a comprehensive platform among advanced research analysis tools for literature review and document management. You use ResearchPal to automate literature reviews, summarize research papers, and interact with PDFs for quick information extraction.
ResearchPal organizes your papers and citations, streamlining project management. The paraphraser feature refines your writing to meet academic standards, improving clarity and style.
Feature
Description
Literature Reviews
Automates the process, saving time and enhancing efficiency.
Paper Insights
Provides quick summaries and key elements from research papers.
Chat with PDF
Allows users to interact with PDFs, extracting specific information quickly.
Research Library Management
Organizes papers and citations, streamlining project management.
Paraphraser
Refines writing to meet academic standards, improving clarity and style.
Enhances productivity through automation.
Saves time in literature discovery and analysis.
Simplifies document navigation and organization.
Provides tailored insights for specific research needs.
ResearchPal helps you manage your research library, automate reviews, and improve your writing for academic success.
You have now explored the most effective research analysis tools available for academics and professionals. Each tool offers unique strengths, whether you need to analyze qualitative data, conduct surveys, visualize literature, or automate reporting. By choosing the right research analysis tools, you can enhance your workflow, improve data interpretation, and achieve better research outcomes.
When you evaluate research analysis tools, you want to focus on features that help you achieve actionable insights and improve your research paper writing. The most effective research tools offer user-friendly interfaces, advanced analytics, and seamless integration with other platforms. You can see the most commonly cited features in the table below:
Key Feature
Description
User-friendly interfaces
Tools that are easy to navigate and use, enhancing user experience.
Features that allow for complex data analysis and insights generation.
Integration with other tools
Ability to connect and work with other software, improving workflow.
Support for qualitative and quantitative data
Capability to handle different types of data analysis.
Facilitate collaboration
Tools that enable teamwork and sharing of insights among users.
Streamline workflows
Features that help in organizing and managing research processes efficiently.
Best Use Cases
You can use research analysis tools for a variety of research methodology needs. For qualitative data, NVivo helps you analyze transcripts and code feedback. Quirkos lets you identify keywords in text documents and visualize insights. Qualtrics provides experience management tools for predictive insights. Dovetail consolidates qualitative data analysis with transcription and collaboration. Thematic uses ai tools for literature review to categorize customer sentiments. These tools support systematic review and academic writing, making them valuable for research paper writing and data interpretation.
Pros and Cons
You benefit from research analysis tools that deliver actionable insights and streamline research paper writing. FineReport and FineBIstand out for their ability to automate reporting and support both qualitative data and quantitative analysis. NVivo and MAXQDA excel in handling qualitative data and systematic review. SurveyMonkey and Qualtrics offer strong survey capabilities and ai tools for research paper writing. Litmaps and Thunderbit provide advanced data interpretation and visualization. ResearchPal enhances research paper writing and supports ai tools for literature review. Each tool helps you organize your workflow and improve data interpretation.
You find a range of pricing options for research analysis tools. FineReportand FineBI offer flexible plans for enterprise users. NVivo and MAXQDA provide academic licenses and professional packages. SurveyMonkey and Qualtrics have subscription models for individuals and teams. Litmaps, Thunderbit, and ResearchPal offer free trials and tiered pricing. You can choose a tool that fits your budget and supports your research methodology, systematic review, and research paper writing needs. Many platforms include ai tools for research paper writing and data interpretation features to maximize value.
Comparison Table of Tools for Research Analysis
You need tocompare research analysis tools before making a decision. Each tool offers unique strengths in features, usability, pricing, and integration. The table below helps you see how these tools for research analysis stack up against each other.
Tool
Features
Usability
Pricing
Integration
FineReport
Pixel-perfect reports, dashboards, mobile BI
Drag-and-drop, intuitive design
Flexible plans
Connects to databases, cloud, APIs
FineBI
Self-service analytics, real-time dashboards
Zero-code, user-friendly
Enterprise plans
60+ connectors, API, big data
NVivo
Qualitative analysis, transcription, coding
Organizes vast data, easy access
Academic licenses
Project management, data import
MAXQDA
Thematic coding, visual reports, collaboration
Simple interface, fast learning
Tiered packages
Imports text, images, multimedia
ATLAS.ti
AI-powered analysis, mixed methods
Seamless experience, offline mode
Subscription
Text, PDF, multimedia integration
Qualtrics
Survey design, logic, reporting
Guided setup, collaborative
Subscription
Integrates with CRM, APIs
SurveyMonkey
Survey creation, reporting, distribution
User-friendly, customizable
Tiered plans
Email, web, social media, platforms
Litmaps
Citation mapping, literature visualization
Visual, easy to navigate
Free/trial plans
Academic databases, export options
SPSS
Statistical analysis, data cleaning
Clear insights, robust analytics
Academic/commercial
Traditional academic integration
Thunderbit
Data extraction, AI column suggestion
Natural language queries
Free/trial plans
Excel, Google Sheets, Notion
ResearchPal
Literature review, PDF chat, paraphrasing
Automated, organized library
Tiered plans
Citation managers, PDF integration
You can use this table to identify which research analysis tools best fit your workflow. FineReportand FineBIstand out for their integration capabilities and user-friendly design. NVivo and MAXQDA excel in qualitative data management. SurveyMonkey and Qualtrics make survey creation simple. SPSS remains a staple for statistical analysis. Litmaps and Thunderbit offer specialized solutions for literature mapping and data extraction. ResearchPal helps you automate literature reviews and document management.
When you compare these tools, focus on the features that matter most for your research. Usability and integration often determine how quickly you can start analyzing data. Pricing varies, so consider your budget and the scale of your project. Integration options let you connect with other platforms, making your workflow smoother.
Choosing the right research analysis tools ensures you work efficiently and achieve reliable results.
Selecting the Right Tools for Research Analysis
Workflow Alignment
You need to matchresearch analysis tools to your research workflow for the best results. Start by identifying your research goals and the type of data you plan to analyze. FineReportand FineBIhelp you align your workflow by supporting both structured and unstructured data. You can connect to databases, spreadsheets, and cloud sources, making these research tools flexible for academic research and professional projects.
Tip: Review your available resources, including budget and technical expertise, before choosing a tool.
Here is a table to help you match research analysis tools to specific research workflows:
Research Need
Recommended Tool
Key Feature
Systematic Reviews
Scite
Detailed citation context
Cross-disciplinary
Elicit
Insights across fields
Quick Literature Reviews
Research Rabbit
Interactive visual maps
Comprehensive Sourcing
Sourcely
Advanced filtering
You should assess the suitability of each tool against your specific needs and constraints. Seek feedback from experienced users and consider integration with your existing systems.
FineBI's Rich Built-in Charts For Data Visualization
When you choose research analysis tools, consider whether your work is academic research or professional analysis. Academic writing often requires tools that support literature review, citation management, and qualitative analysis. Professional use may focus on business intelligence, operational dashboards, and real-time analytics.
Factors to consider include:
Research goals
Type of data being analyzed
Methodologies employed
Ethical considerations
Scope of the study
Sample size
User-friendliness
Safety and security
Need for triangulation
Theoretical framework
FineReport and FineBI serve both academic research and professional environments. You can use FineReportfor structured reporting and FineBIfor self-service analytics, ensuring your research workflow remains efficient.
You should always conduct a trial or pilot test before committing to a research analysis tool. Most platforms offer free trials or demo versions. During your evaluation, check usability, integration options, and compatibility with your existing workflow. FineReportand FineBIprovide flexible deployment and integration, making them easy to test in different environments.
Tip: Explore user reviews and recommendations to gain insights into real-world performance.
Follow these steps for effective evaluation:
Identify your research goals.
Understand your data needs.
Evaluate available resources.
Explore tool options relevant to your field.
Assess suitability and constraints.
Seek recommendations.
Conduct trials or pilot tests.
Consider integration and compatibility.
By following these guidelines, you can select research analysis tools that align with your workflow and support your academic research or professional projects.
AI Tools for Research Analysis
AI tools for research have transformed how you approach data analysis and literature review. These research analysis tools now offer advanced automation, machine learning, and natural language processing. You can process large datasets, generate insights, and organize knowledge faster than ever.
FineBI and AI Capabilities
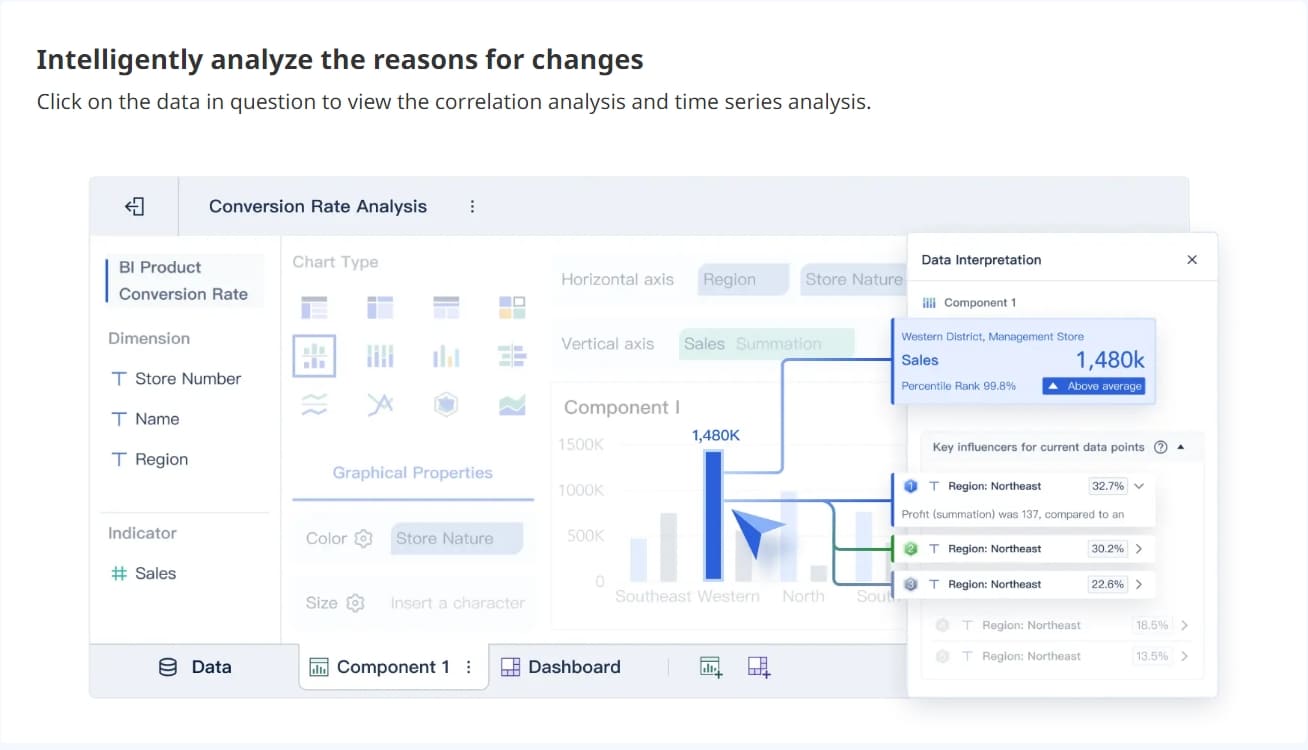
FineBIstands out among ai tools for research. You can use its AI-powered research features to model data, visualize trends, and create self-service datasets. The platform guides you through new analysis paths, making your workflow more efficient. FineBI’s intuitive interface lets you filter, sort, and explore data without technical barriers. The table below highlights key AI-driven features in FineBI:
Feature
Description
Data Modeling
Simplifies exploration by modeling relationships in your data warehouse.
Visual Data Analysis
Helps you quickly spot data issues using visual tools.
Self-Service Datasets
Lets you process data with easy filtering and sorting.
New Analysis Paths
Guides you through dashboards for deeper engagement and analysis.
You benefit from real-time insights andstreamlined workflows. FineBI’s ai-powered research tools help you identify patterns and forecast outcomes.
Thunderbit and Litmaps are leading ai tools for research. Thunderbit uses AI to automate data extraction from websites, PDFs, and images. You can specify queries in plain English and receive suggested columns for extraction. Litmaps excels at ai literature review. It visualizes connections between academic papers, helping you organize and prioritize readings. Both platforms use ai-powered research to process information quickly and reduce manual effort.
Thunderbit automates data scraping and supports natural language queries.
Litmaps maps citations and references, making ai literature review more efficient.
These ai tools for research help you discover trends and gaps in literature.
Scispace and Scite
Scispace and Scite offer advanced ai tools for research analysis. Scispace uses machine learning to summarize papers and organize knowledge. You can search literature and extract key insights automatically. Scite supports ai literature review by analyzing citation contexts and generating hypotheses. These ai-powered research platforms help you process large datasets and identify patterns.
Scispace summarizes research papers and organizes findings.
Scite analyzes citation networks and supports hypothesis generation.
Both tools automate literature review and enhance research analysis tools.
AI tools for research now play a vital role in academic and professional settings. You can use ai literature review platforms to search, summarize, and organize knowledge. These ai-powered research solutions process data faster, reduce mistakes, and help you generate new ideas. By integrating ai tools for research into your workflow, you improve productivity and gain deeper insights.
You gain a real advantage when you choose the right tools for research analysis. FineReportand FineBIhelp you organize data, improve research paper writing, and support academic writing. These solutions let professionals streamline research paper writing and boost productivity. Try different options to see which fits your research paper writing needs best. Stay updated with new research analysis technologies to keep your research paper writing effective and relevant.
Continue Reading About Tools for Research Analysis
Access a wealth of case studies, industry insights, and solution guides to accelerate digital transformation.
FAQ
What are research analysis tools?
Research analysis tools help you collect, organize, and interpret data for academic or professional projects. You use these tools to improve efficiency, accuracy, and collaboration in your research workflow.
How do research analysis tools support collaboration?
Research analysis tools let you share dashboards, co-author reports, and manage permissions. You work with team members in real time, making it easier to review findings and make decisions together.
Can you use research analysis tools for both qualitative and quantitative data?
You can use research analysis tools for both qualitative and quantitative data. Many platforms support coding, statistical analysis, and visualization, so you analyze interviews, surveys, and large datasets.
What features should you look for in research analysis tools?
You should look for user-friendly interfaces, integration options, data security, and advanced analytics. These features help you streamline your workflow and get reliable results from research analysis tools.
Are research analysis tools suitable for students?
Students benefit from research analysis tools because they simplify data management and analysis. You can use these tools for projects, assignments, and thesis work, gaining valuable skills for future research.