You want to work smarter, not harder, right? When you use dashboard excel templates, you save hours and cut down on mistakes. Just look at these results:
| User | Benefit |
|---|---|
| Sophie Dupont | Planning time dropped from 3 days to 4 hours |
| Emma Moretti | Monthly reporting now takes only 15 minutes |
| Isla Petrova | Budget tracking became effortless |
| Mateo Hernandez | On-time delivery rate jumped from 74% to 92% |
You get professional results in less time. If you want even more powerful dashboards, check out FanRuan and FineReport for advanced reporting tools.
Best Free Dashboard Excel Templates for 2026
You want to make your work easier and your results more impressive. The right dashboard excel template can help you do just that. Let’s walk through the best free dashboard templates for 2026, each designed to save you time and boost your productivity.
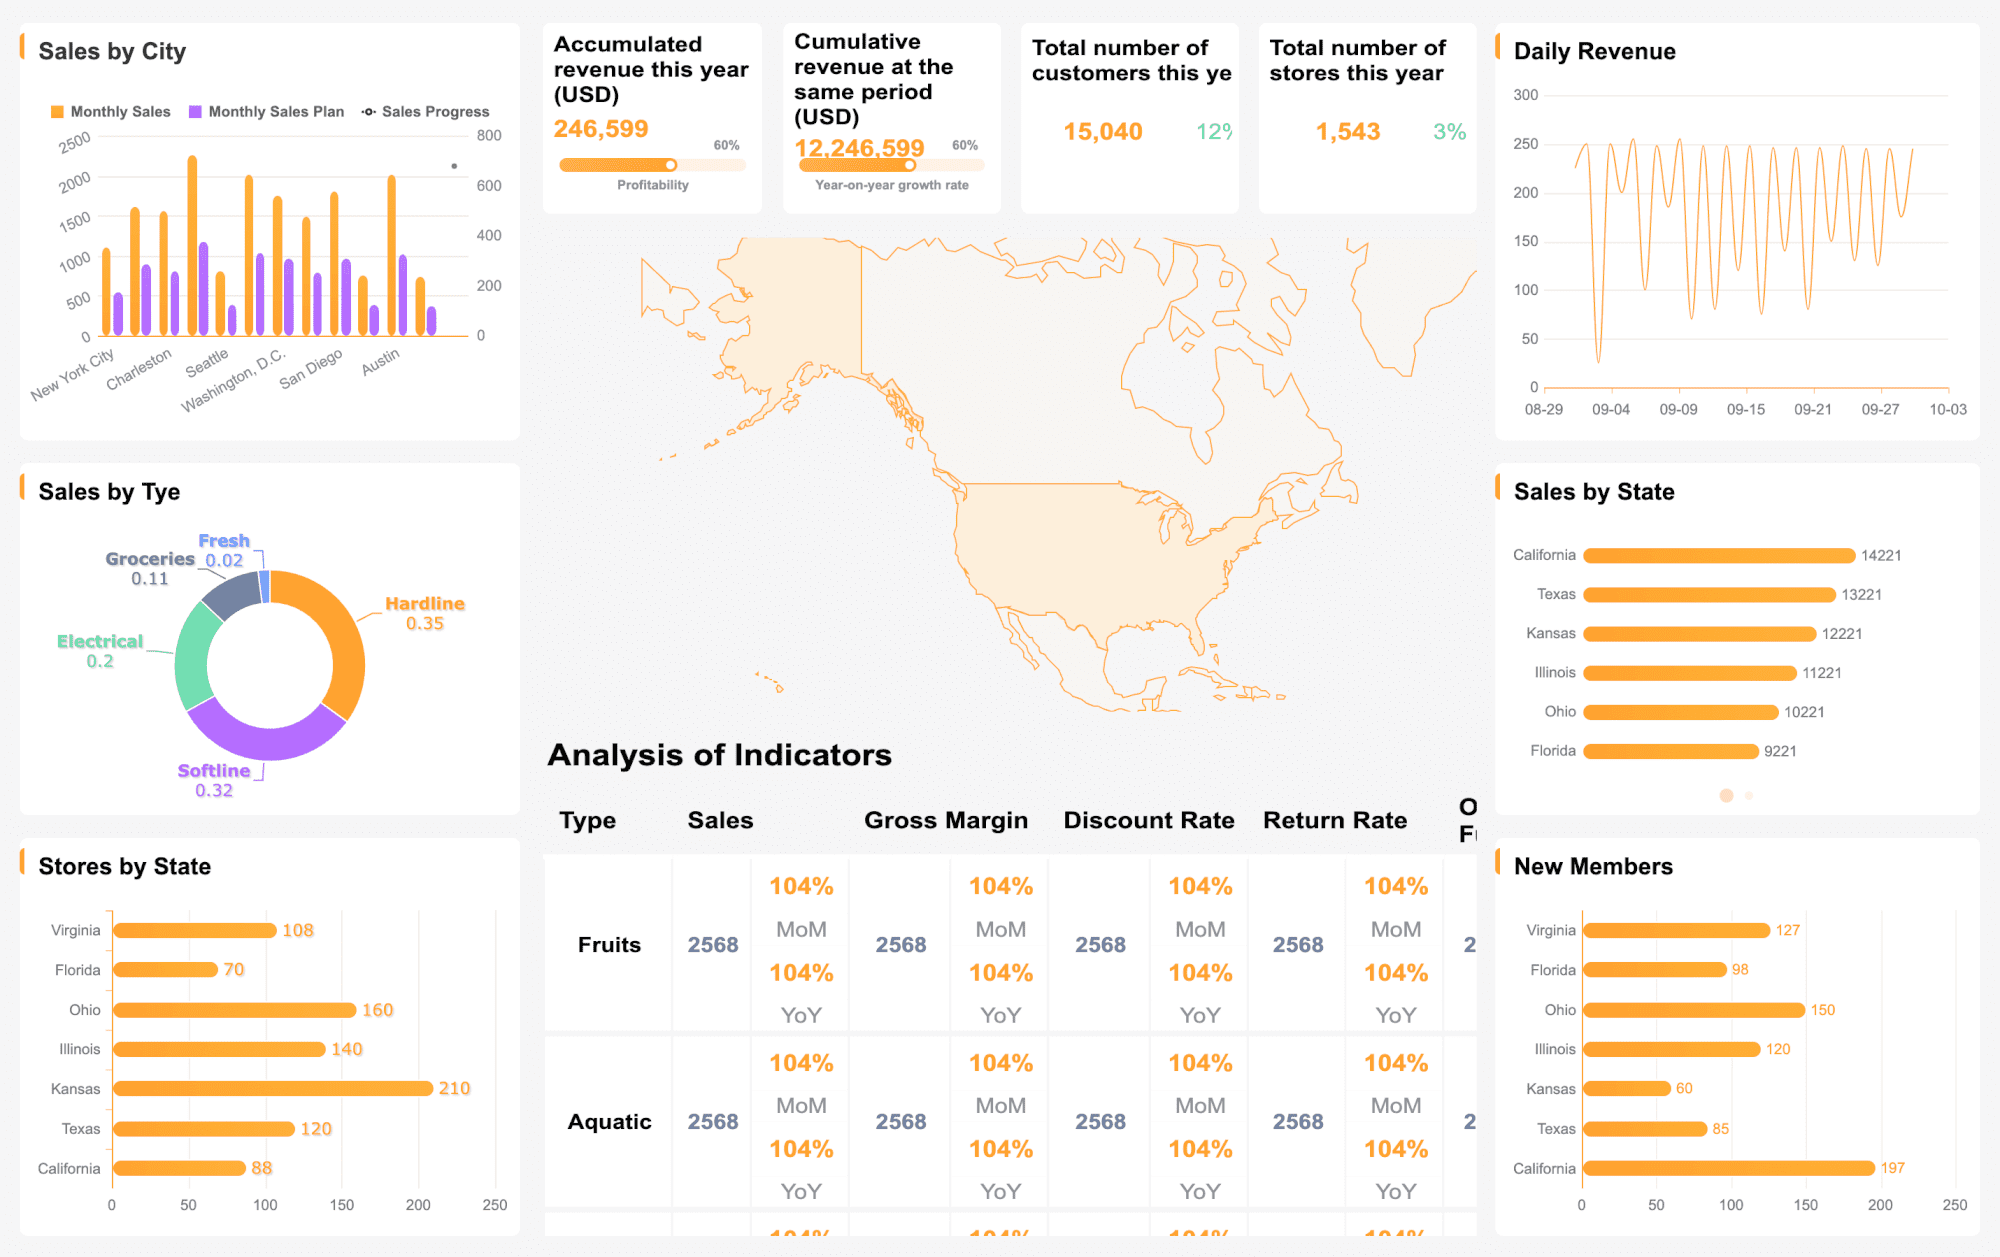
Sales Performance Dashboard Excel
You need a clear view of your sales numbers. This free dashboard template brings all your key sales metrics together in one place. You can track revenue, conversion rates, and team performance. The dashboard excel template is highly customizable, so you can adjust it to fit your business. You get real-time visibility into sales performance, pattern tracking, and easier collaboration with your team.
| Feature/Benefit | Sales Performance Dashboard Excel Template |
|---|---|
| Visualizes key sales metrics | Yes |
| Real-time visibility | Yes (with data input) |
| Customizable | Highly customizable |
| Data insights | Yes |
| Pattern tracking | Yes |
| Easier collaboration | Yes |
Tip: If you need advanced analytics or want to connect multiple data sources, try FineReport by FanRuan. It offers enterprise-level dashboard excel solutions.
Monthly Sales Overview Template
You want to see how your sales are doing month by month. This free dashboard template tracks average revenue per unit, sales pipeline velocity, cost of goods sold, gross profit margin, revenue per employee, EBIT, and working capital. These metrics help you spot trends, find bottlenecks, and measure productivity.
| Metric | Description |
|---|---|
| Average Revenue per Unit | Measures product profitability. |
| Sales Pipeline Velocity | Identifies bottlenecks. |
| Cost of Goods Sold (COGS) | Evaluates profitability. |
| Gross Profit Margin | Shows overall profitability. |
| Revenue per Employee | Measures productivity. |
| EBIT | Evaluates operating performance. |
| Working Capital | Aids in liquidity evaluation. |
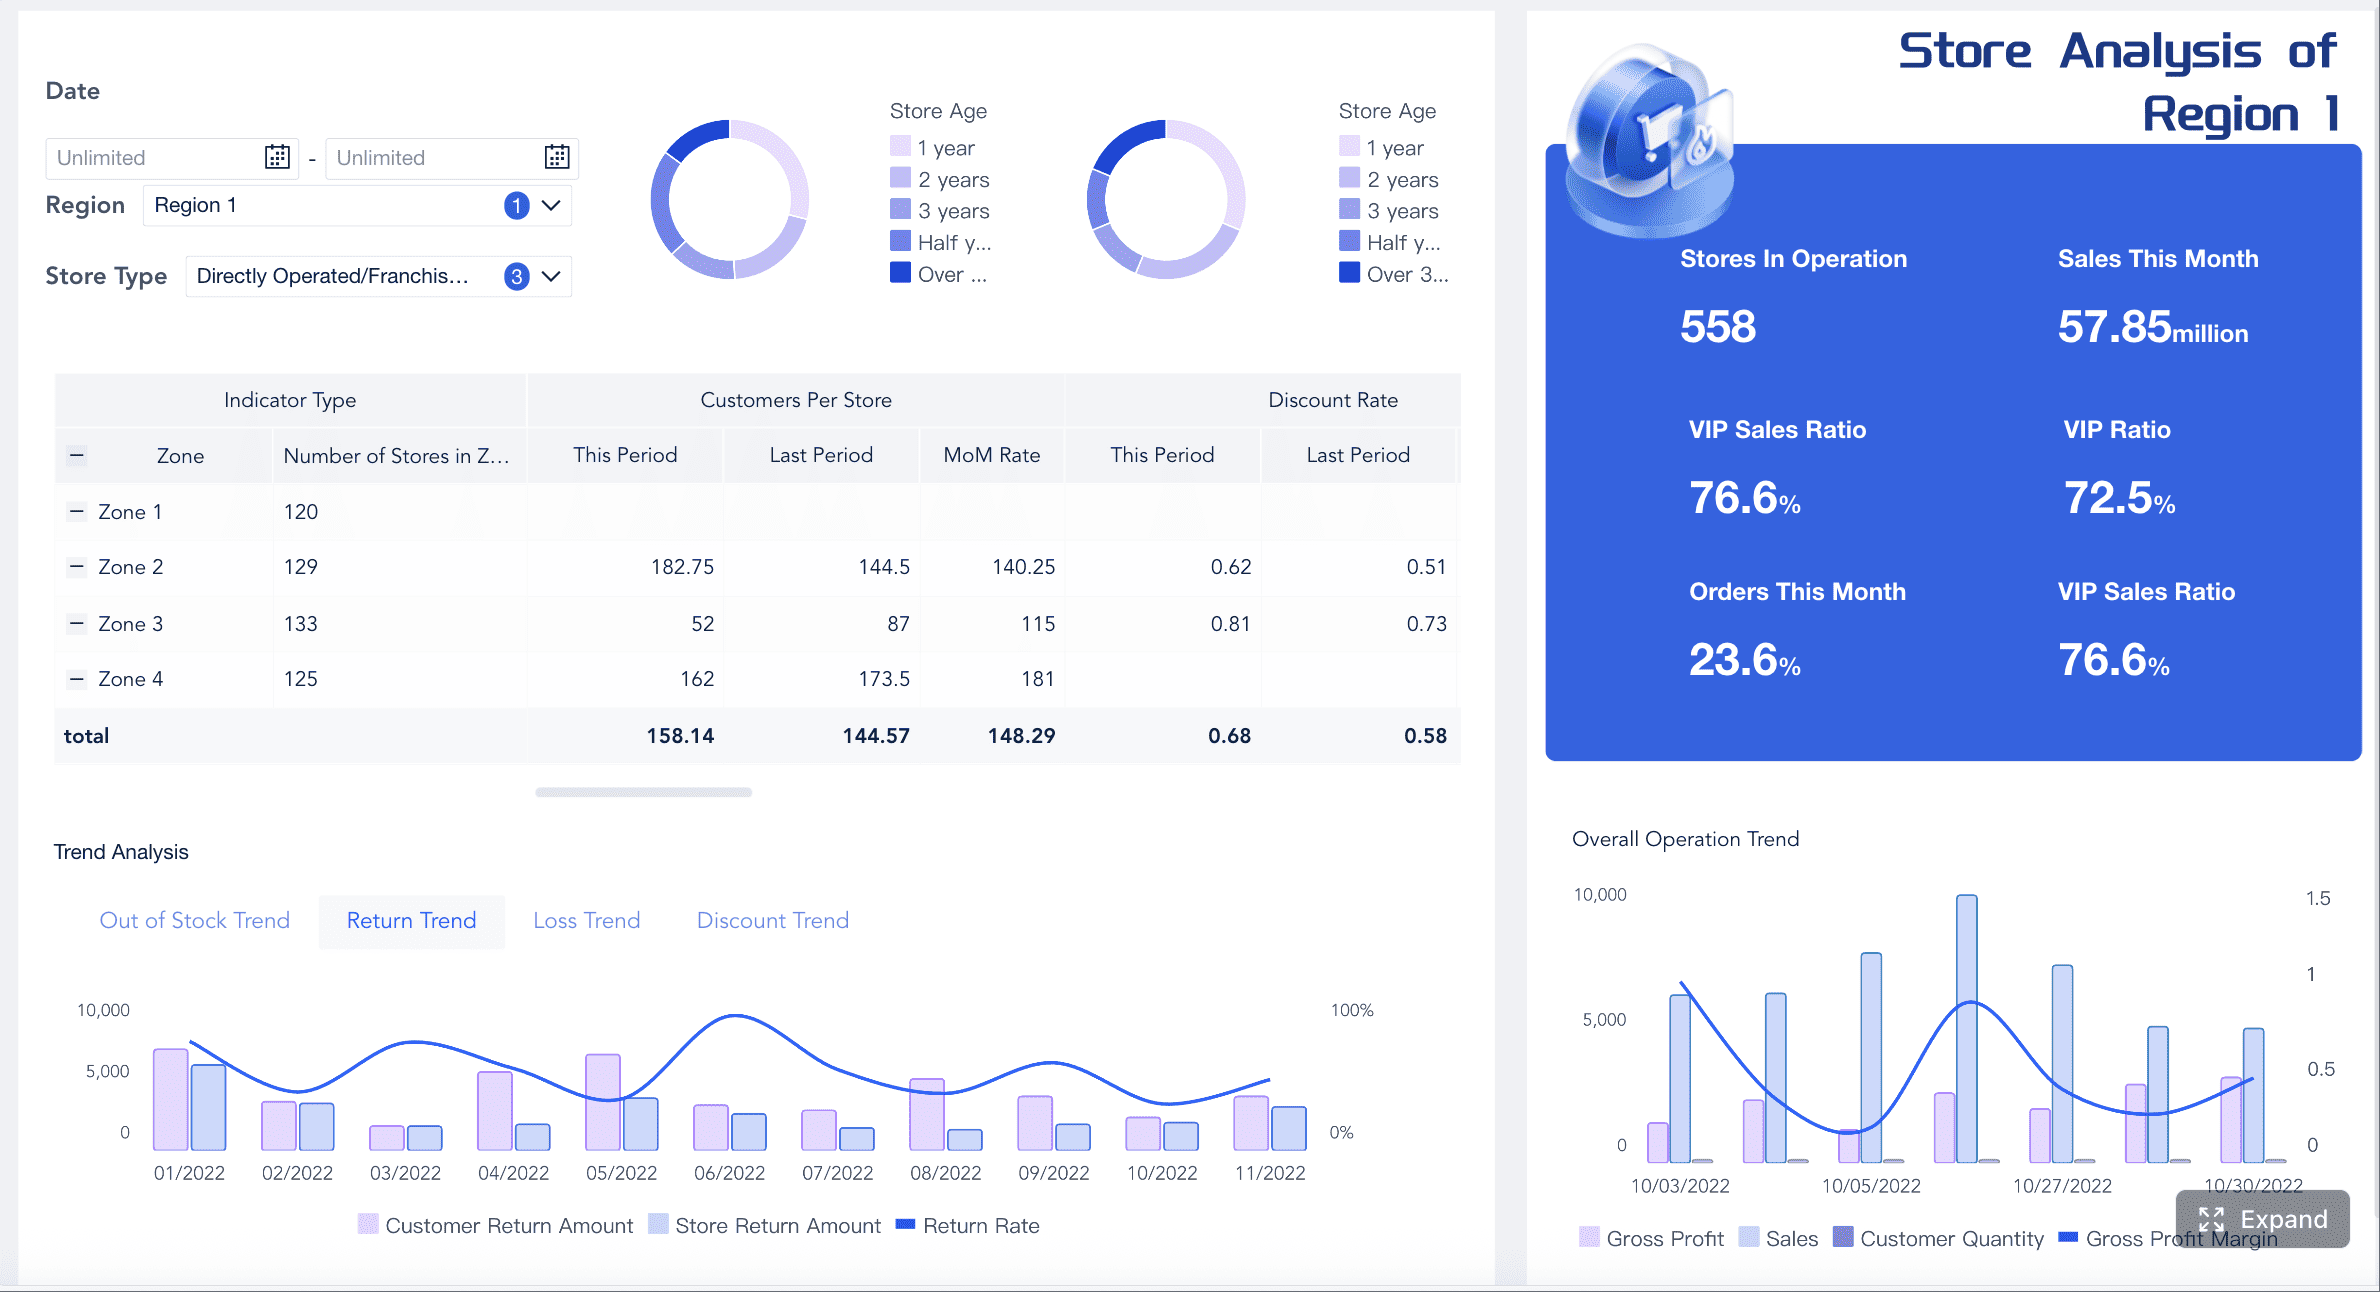
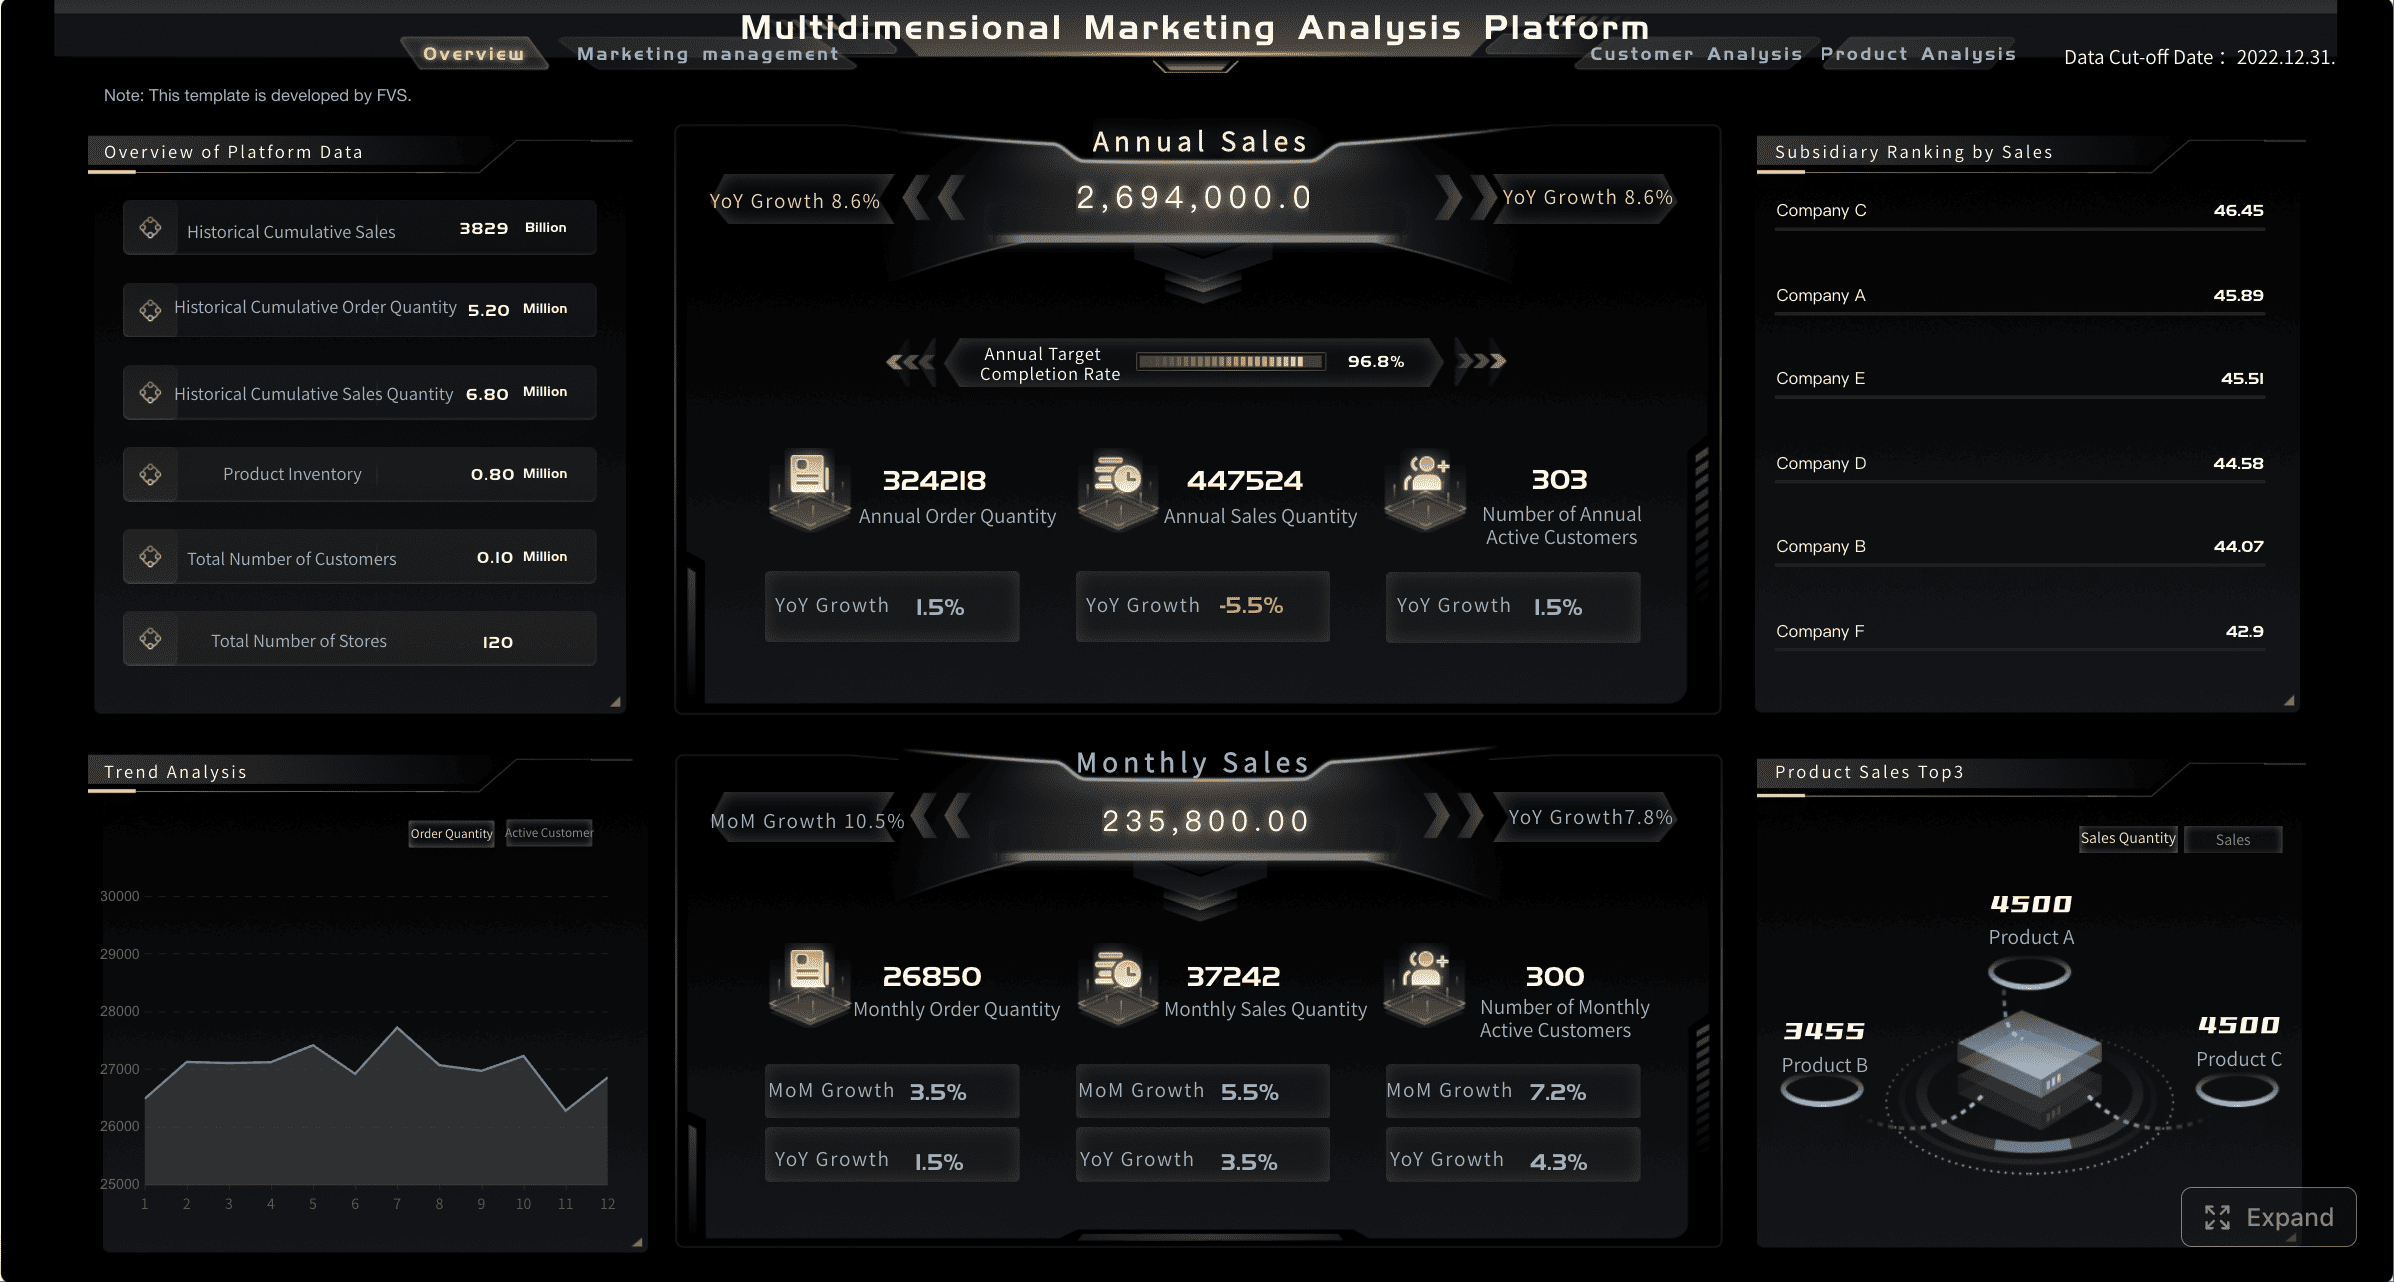
Regional Sales Analysis Dashboard
You want to understand sales performance in different regions. This dashboard excel template gives you data-driven visibility at both macro and micro levels. You can make faster, evidence-based decisions and reduce reporting time. Predictive analytics help you forecast revenue and adjust strategies. The dashboard tracks historical sales trends and seasonal fluctuations, consolidates data into a single view, and helps you make data-backed changes for sustainable growth.
- Data-driven visibility into regional sales.
- Faster, evidence-based decisions.
- Predictive analytics for revenue forecasts.
- Tracks seasonal fluctuations and historical trends.
- Consolidates data for deeper analysis.
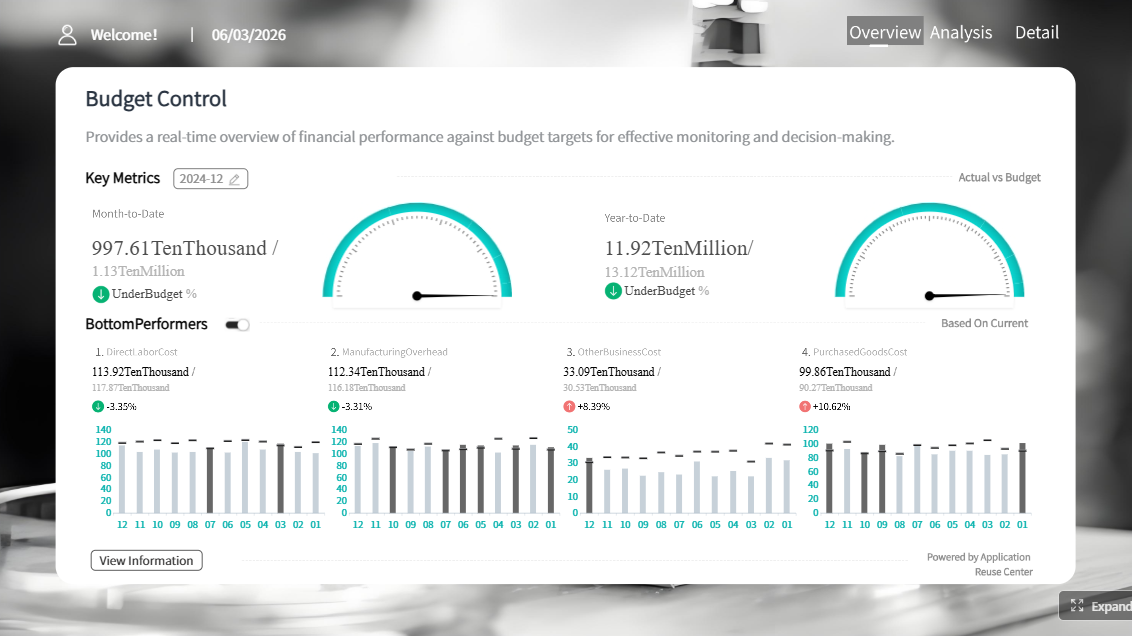
Budget vs Actual Excel Dashboard
You want to compare your planned budget with actual spending. This free dashboard template makes it easy. You get automated calculations, visual indicators, and a clean layout. The dashboard excel template lets you customize categories and workflows. You can spot trends and identify areas needing attention.
| Feature | Benefit |
|---|---|
| Budget vs Actual Tracking | Automated calculations and clear reporting. |
| Automated & Error-Free | Built-in formulas and intelligent formatting. |
| Customizable Template | Modify categories and layouts. |
| Professional Design | Clean, intuitive layout. |
| Visual Indicators | Advanced color-coding for quick insights. |
| Multiple Analysis Views | Detailed tracking and executive summaries. |
Profit & Loss Statement Dashboard Excel
You want to track your business’s financial health. This free dashboard template helps you monitor revenue, expenses, and net income. Automated calculations make it easy to get accurate results. The dashboard excel template aids in making informed decisions based on profitability analysis.
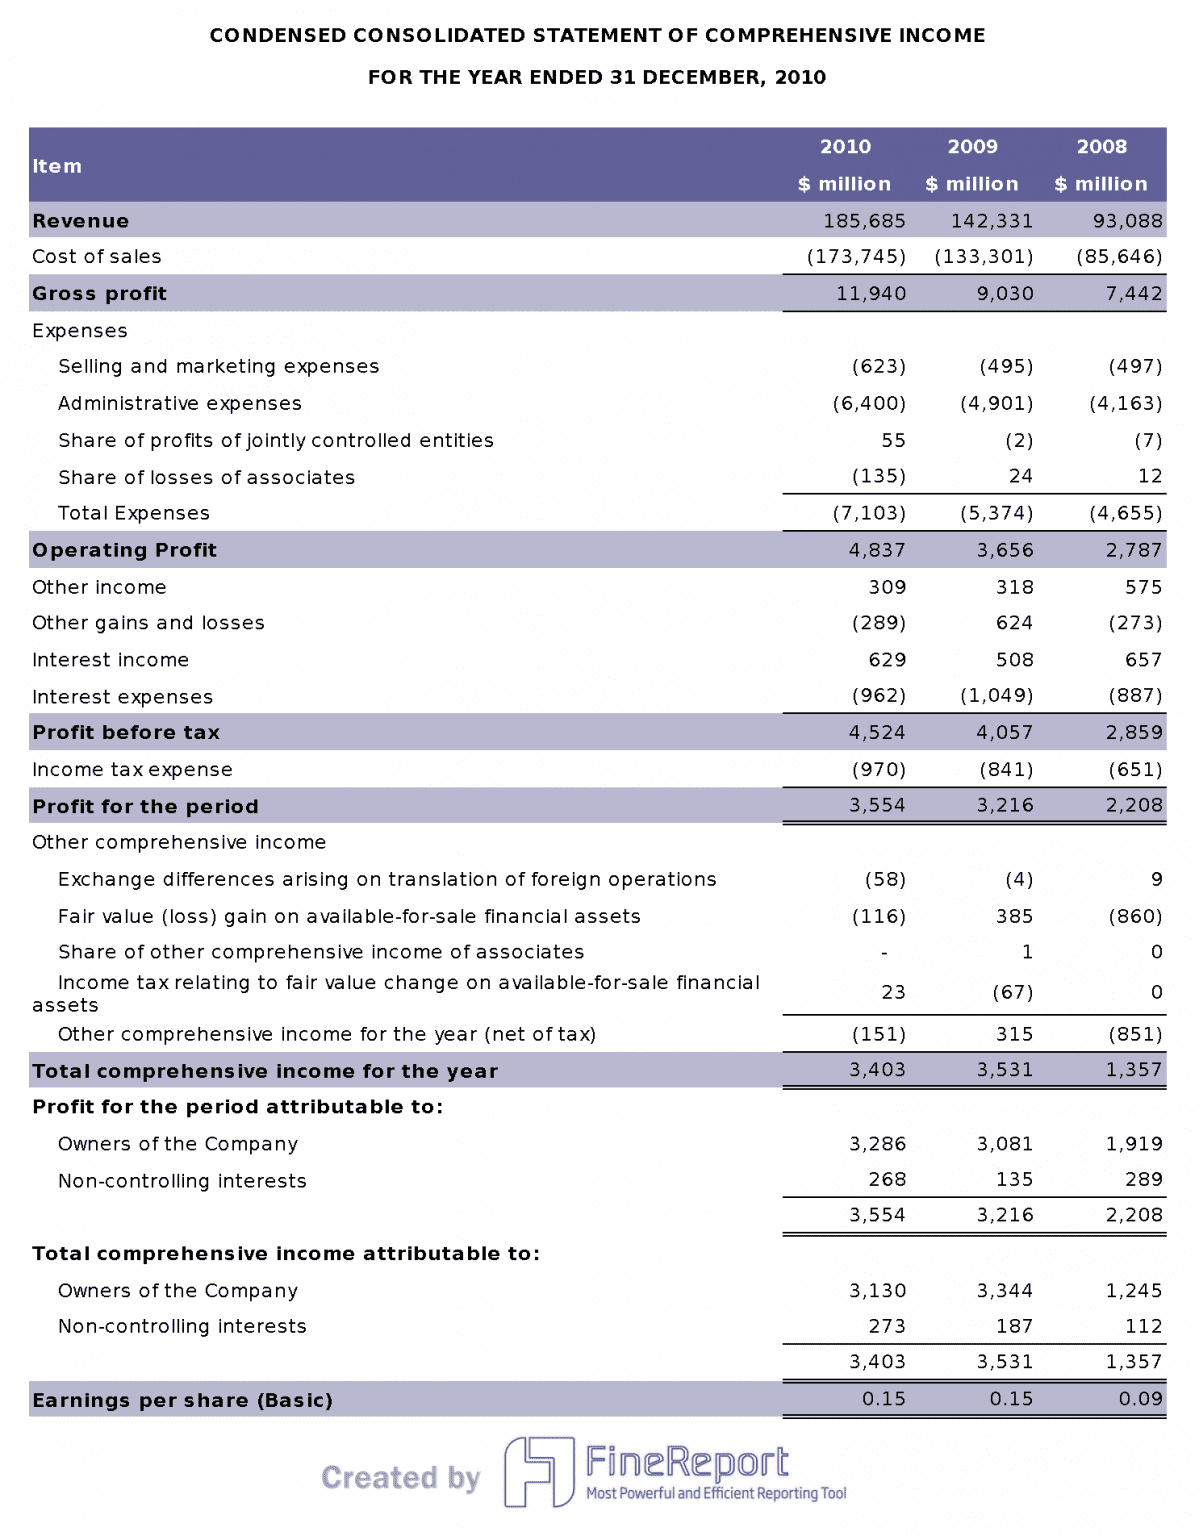
| Feature | Description |
|---|---|
| Financial Tracking | Tracks performance over a period. |
| Revenue Breakdown | Clear breakdown of revenue, expenses, and net income. |
| Automated Calculations | Sums up crucial components for accuracy. |
| Decision-Making Aid | Helps you make better decisions. |
Cash Flow Management Dashboard
You want to manage your cash flow with confidence. This free dashboard template gives you a detailed breakdown of inflows and outflows year by year. You can quickly spot spending patterns and see how financial changes affect your goals. The dashboard excel template helps you find opportunities for savings and better management.
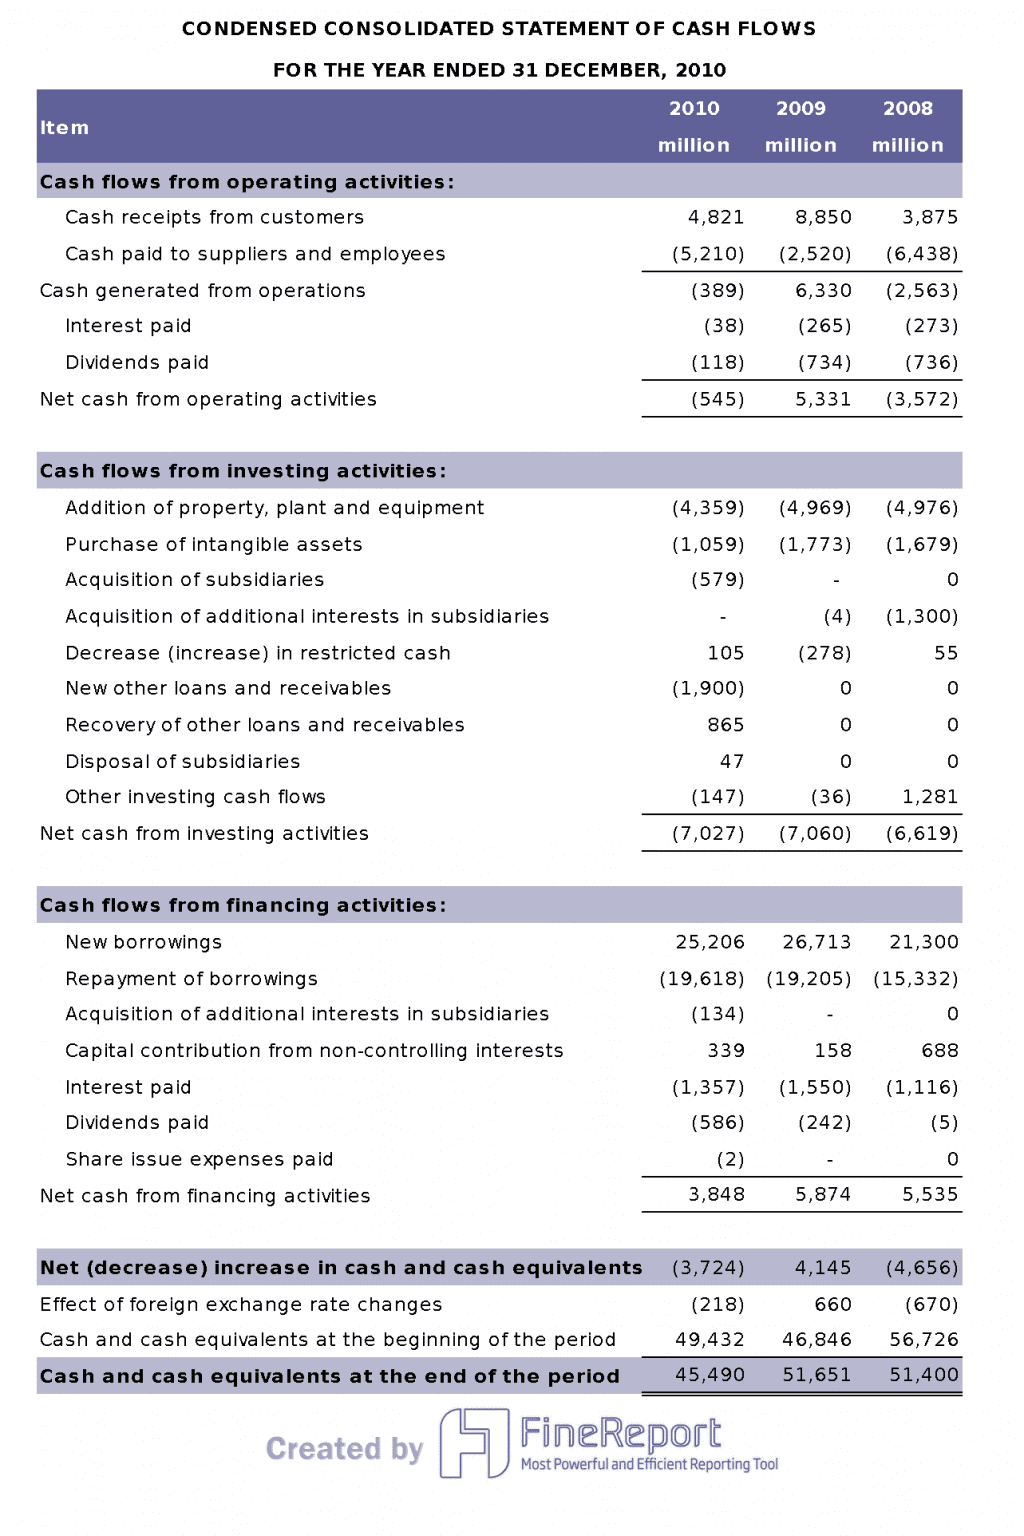
- Year-by-year breakdown of cash flow.
- Quick identification of spending patterns.
- Understand impact on long-term goals.
- Find opportunities for savings.
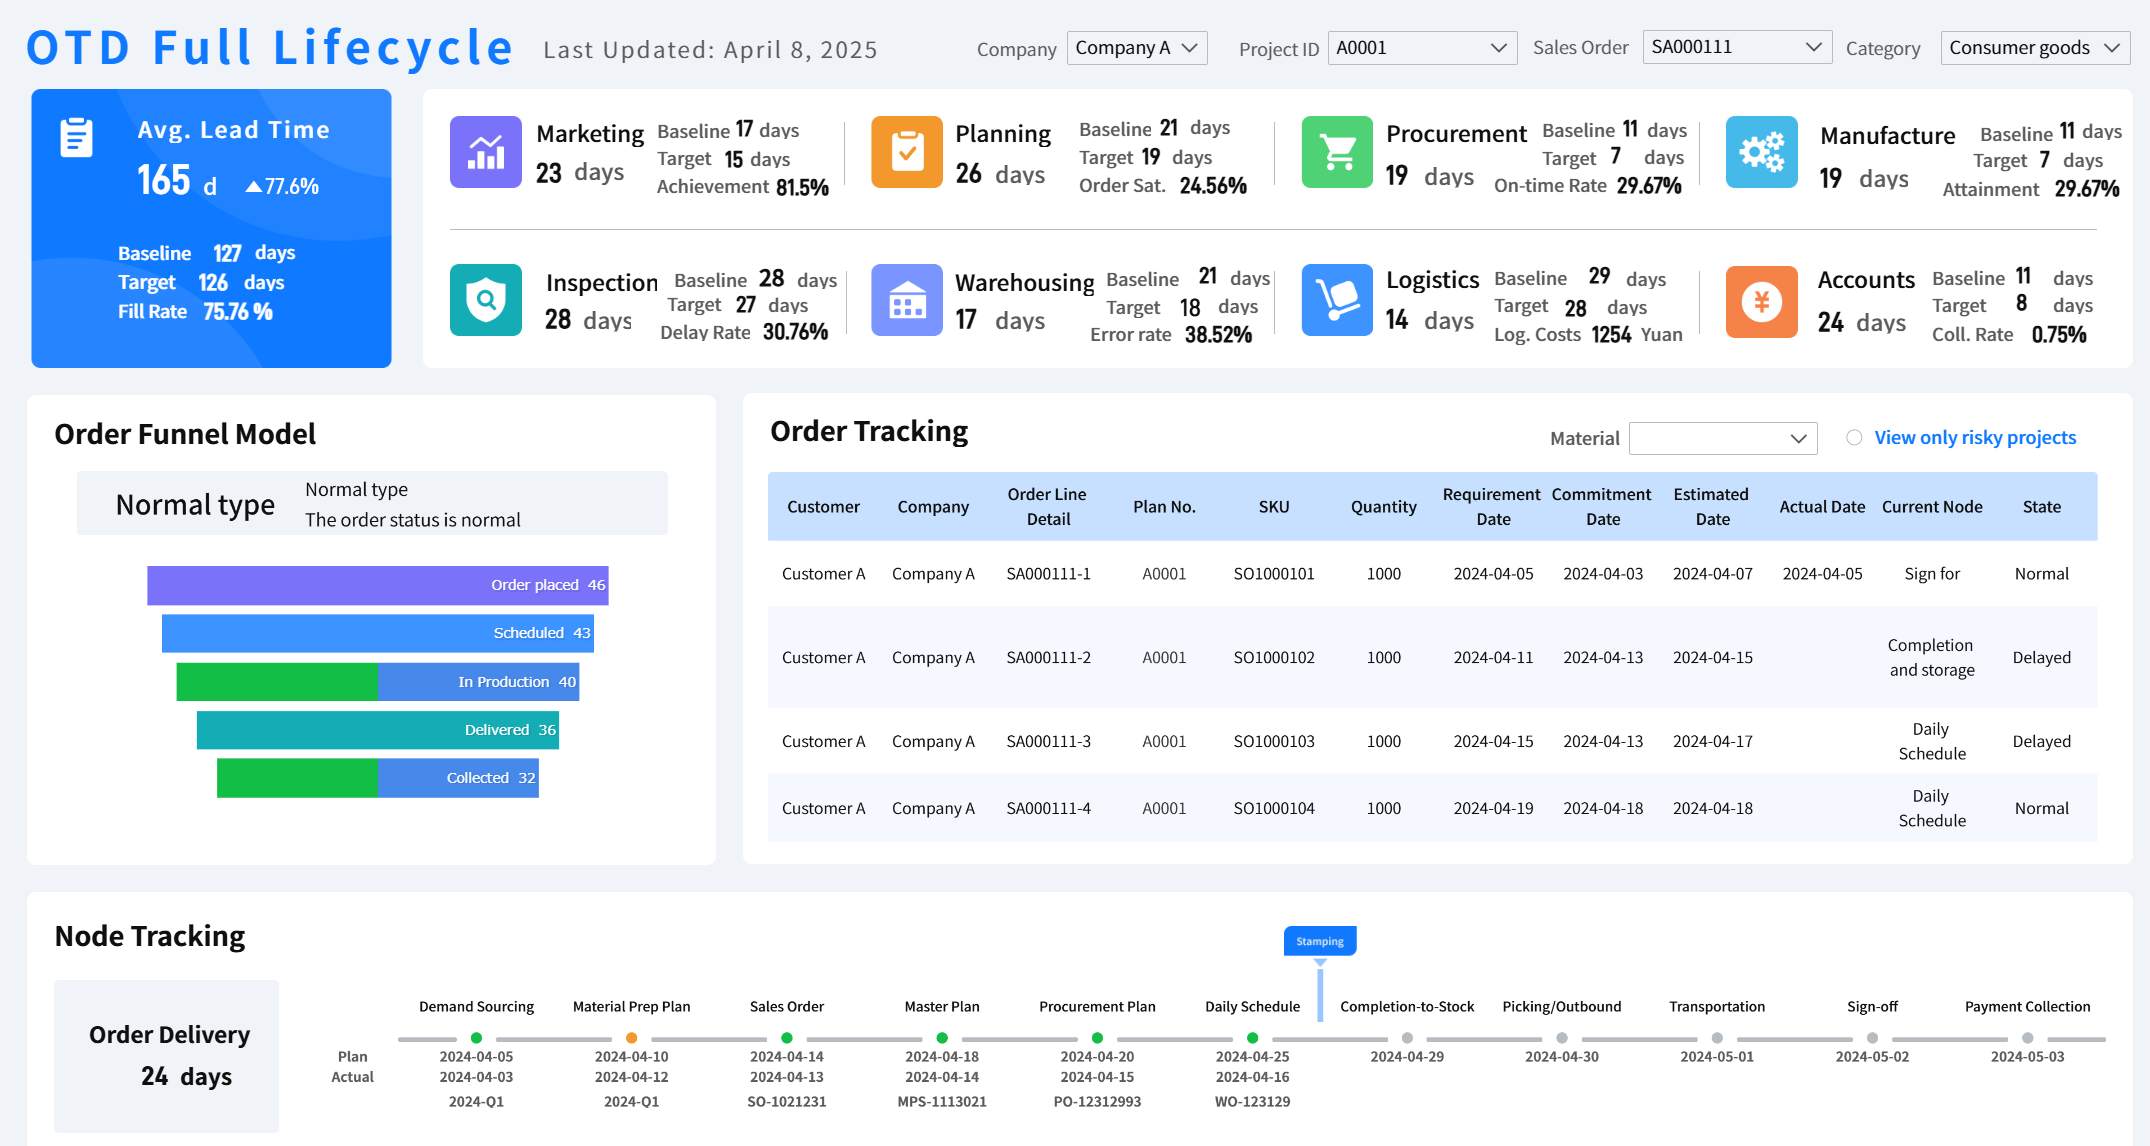
Project Timeline Tracker Template
You want to keep your projects on track. This free dashboard template helps you organize tasks, dates, dependencies, and progress. You get better schedule control, stronger risk management, and enhanced communication. The dashboard excel template lets you start projects faster and compare statuses easily.
| Advantage | Description |
|---|---|
| Better schedule control | Organize tasks, dates, dependencies, and progress. |
| Stronger risk management | Identify and monitor risks throughout the project lifecycle. |
| Enhanced communication | Improve consistency and reduce confusion. |
| Faster project startup | Set up documentation quickly and efficiently. |
Note: The 2026 templates offer real-time project health snapshots, instant progress indicators, and improved workload management. You can see if your team is on schedule or at risk.
Task Progress Dashboard Excel
You want to see how your team is doing. This free dashboard template shows task completion status, overdue tasks, and workload distribution. You can track if your team is on schedule or needs help. The dashboard excel template reveals task priority and complexity for smarter planning.
- Instant progress indicators.
- Overdue and status tracking.
- Workload management features.
- Insights into task priority and complexity.
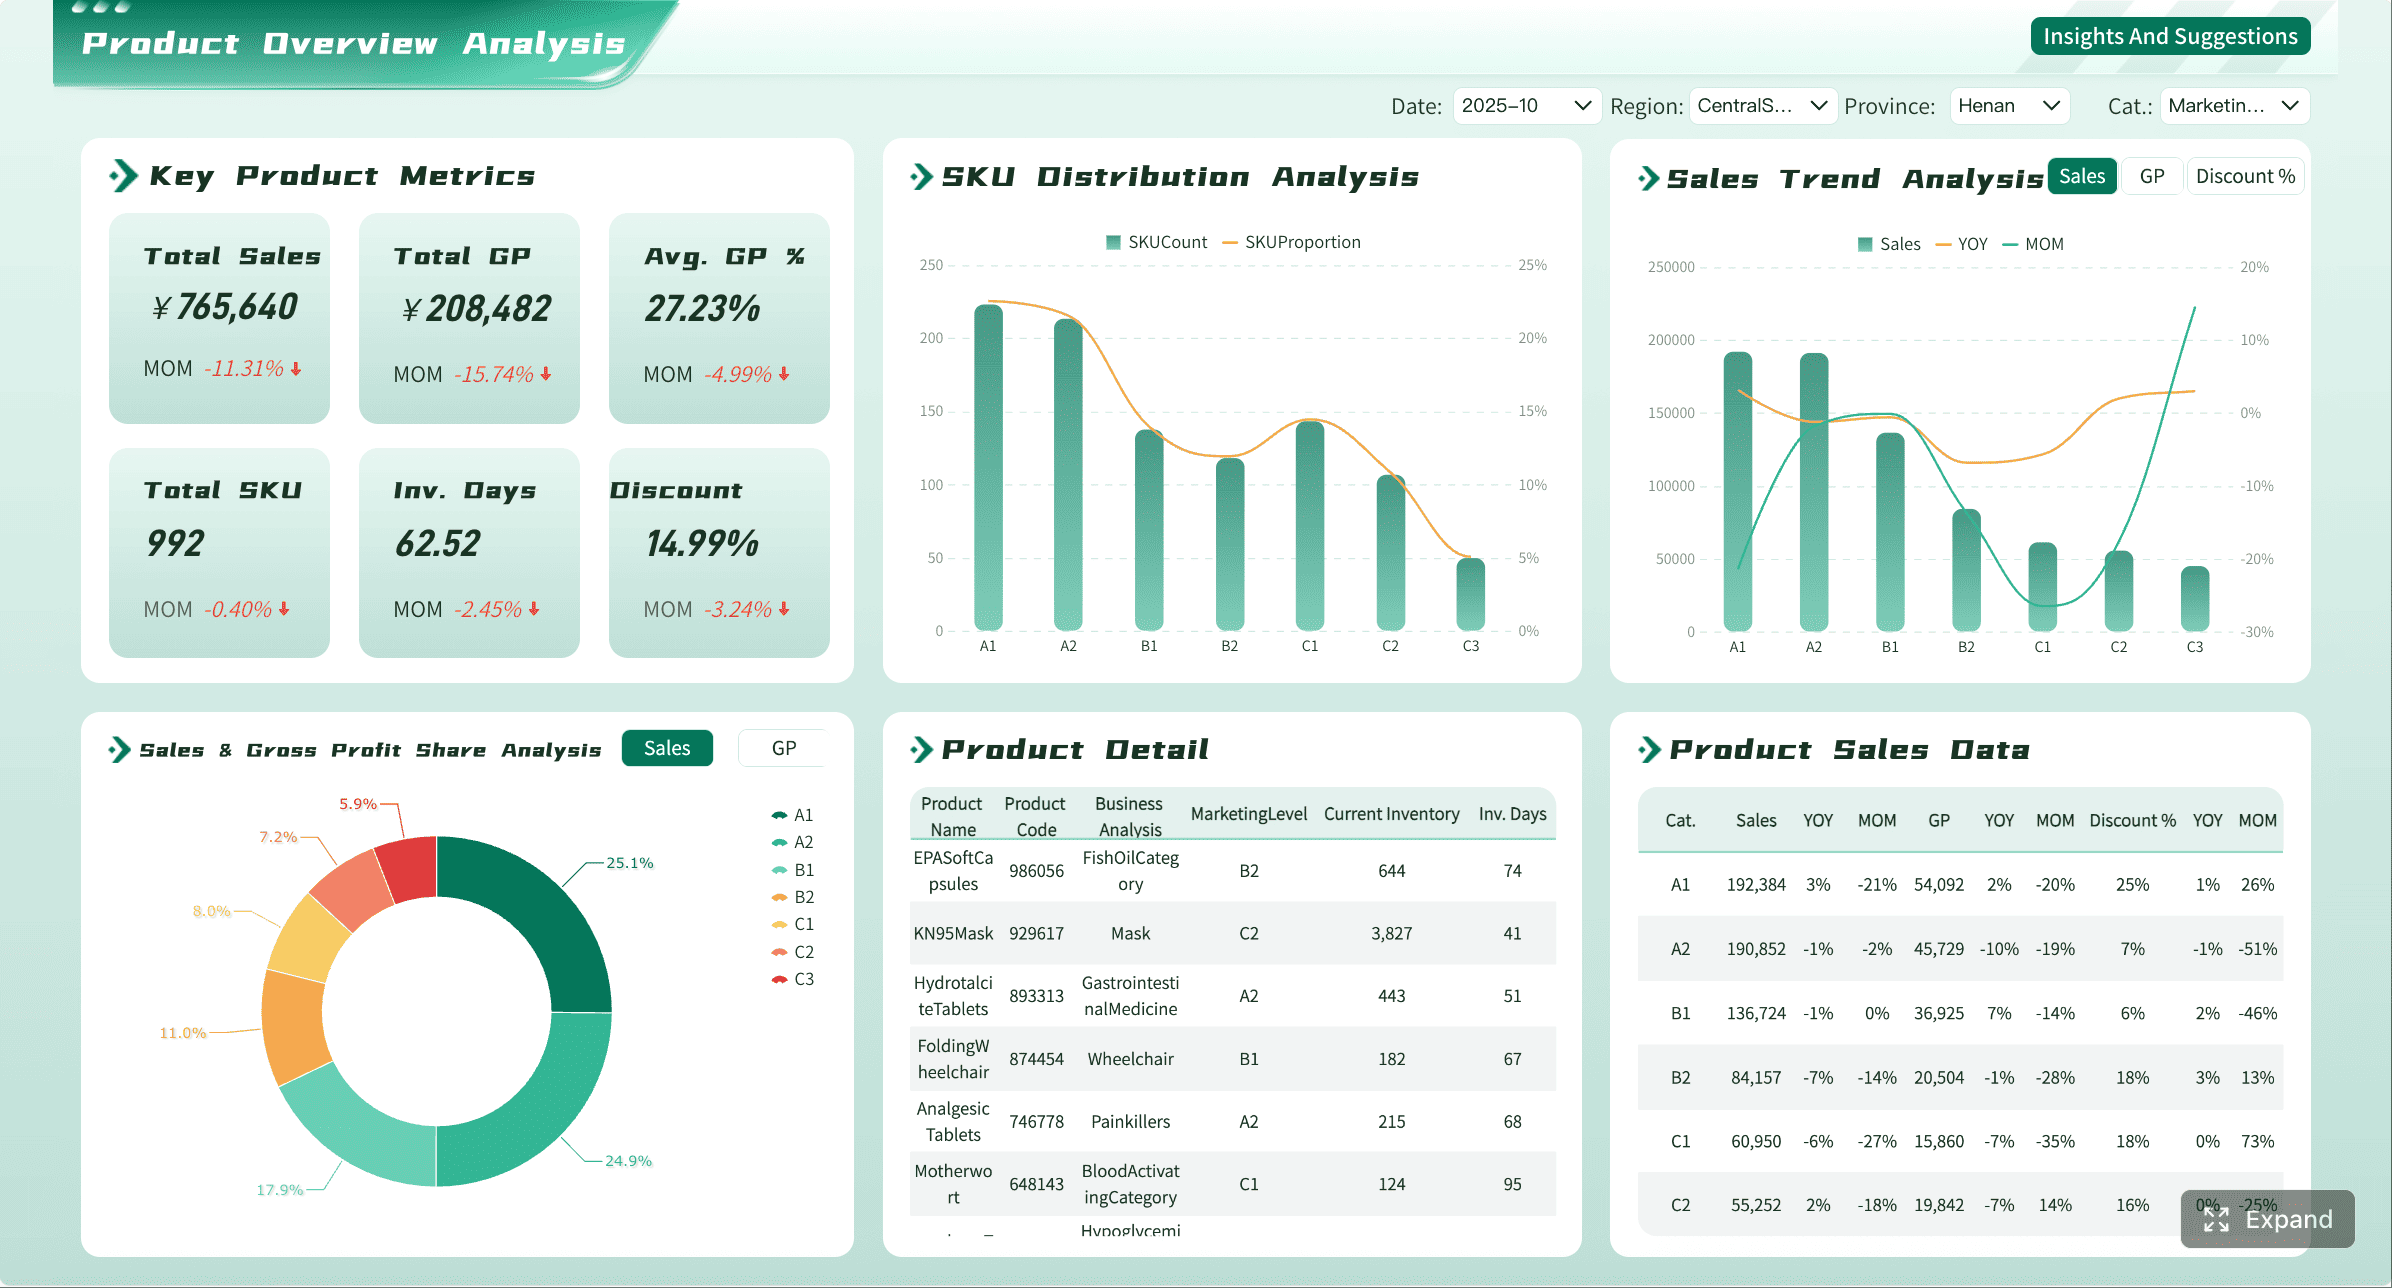
Campaign Performance Dashboard Excel
You want to measure your marketing campaigns. This free dashboard template tracks cost per click, click-through rate, impressions, conversion rate, return on ad spend, cost per acquisition, and budget utilization rate. The dashboard excel template helps you see which campaigns are working and where to improve.
| KPI | Description |
|---|---|
| Cost per click (CPC) | Average paid for each click. |
| Click-through rate (CTR) | Percentage of impressions that result in clicks. |
| Impressions | Total times ads were displayed. |
| Conversion rate | Percentage of clicks that result in actions. |
| Return on ad spend (ROAS) | Revenue for every dollar spent. |
| Cost per acquisition (CPA) | Amount paid to acquire each customer. |
| Budget utilization rate | Percentage of budget spent. |
Social Media Analytics Dashboard
You want to analyze your social media impact. This free dashboard template combines metrics from multiple platforms. You get full customization, unified views, and effective charts. The dashboard excel template lets you visualize engagement, reach, and growth. You can set it up to track likes, shares, comments, and followers.
| Feature | Excel Dashboards | Dedicated Platforms |
|---|---|---|
| Customization | Fully customizable | Predefined metrics |
| Unified View | Combines metrics from multiple sources | Siloed data |
| Visualization | Charts and graphs available | Depends on platform |
| Setup Time | Manual setup | Automated |
| Reporting | Manual formatting | Automated |
| Real-Time Data Integration | Typically static data | Real-time integration |
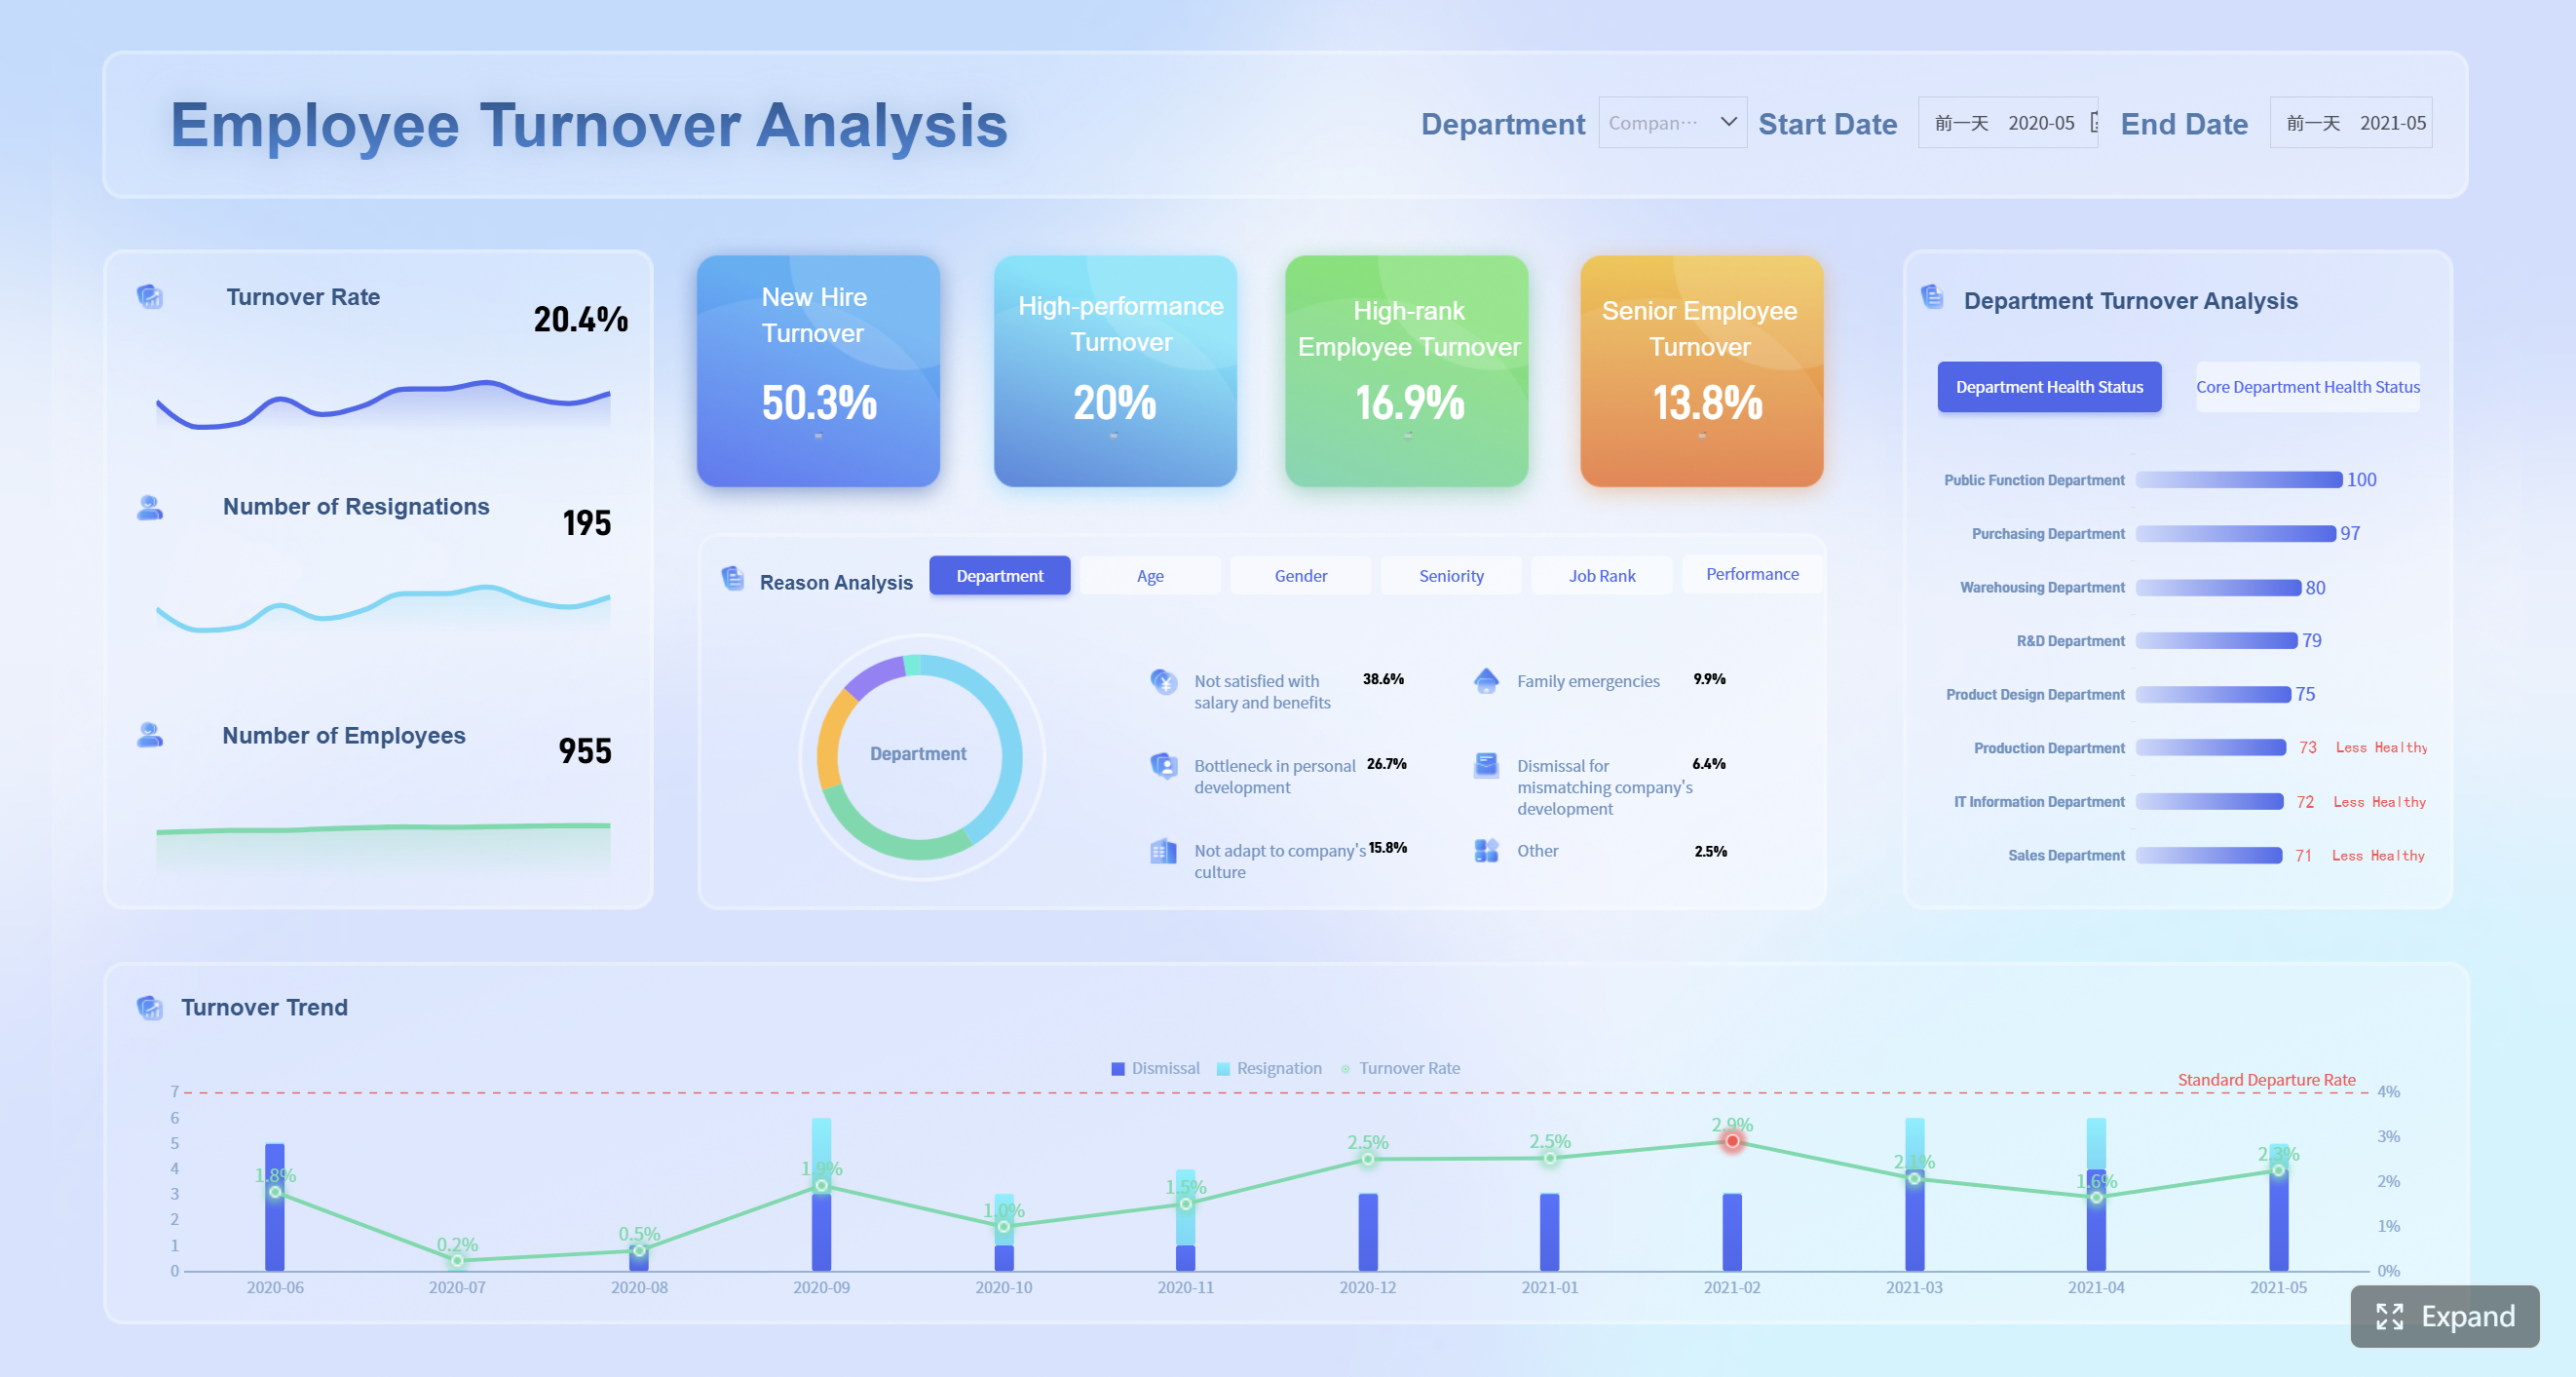
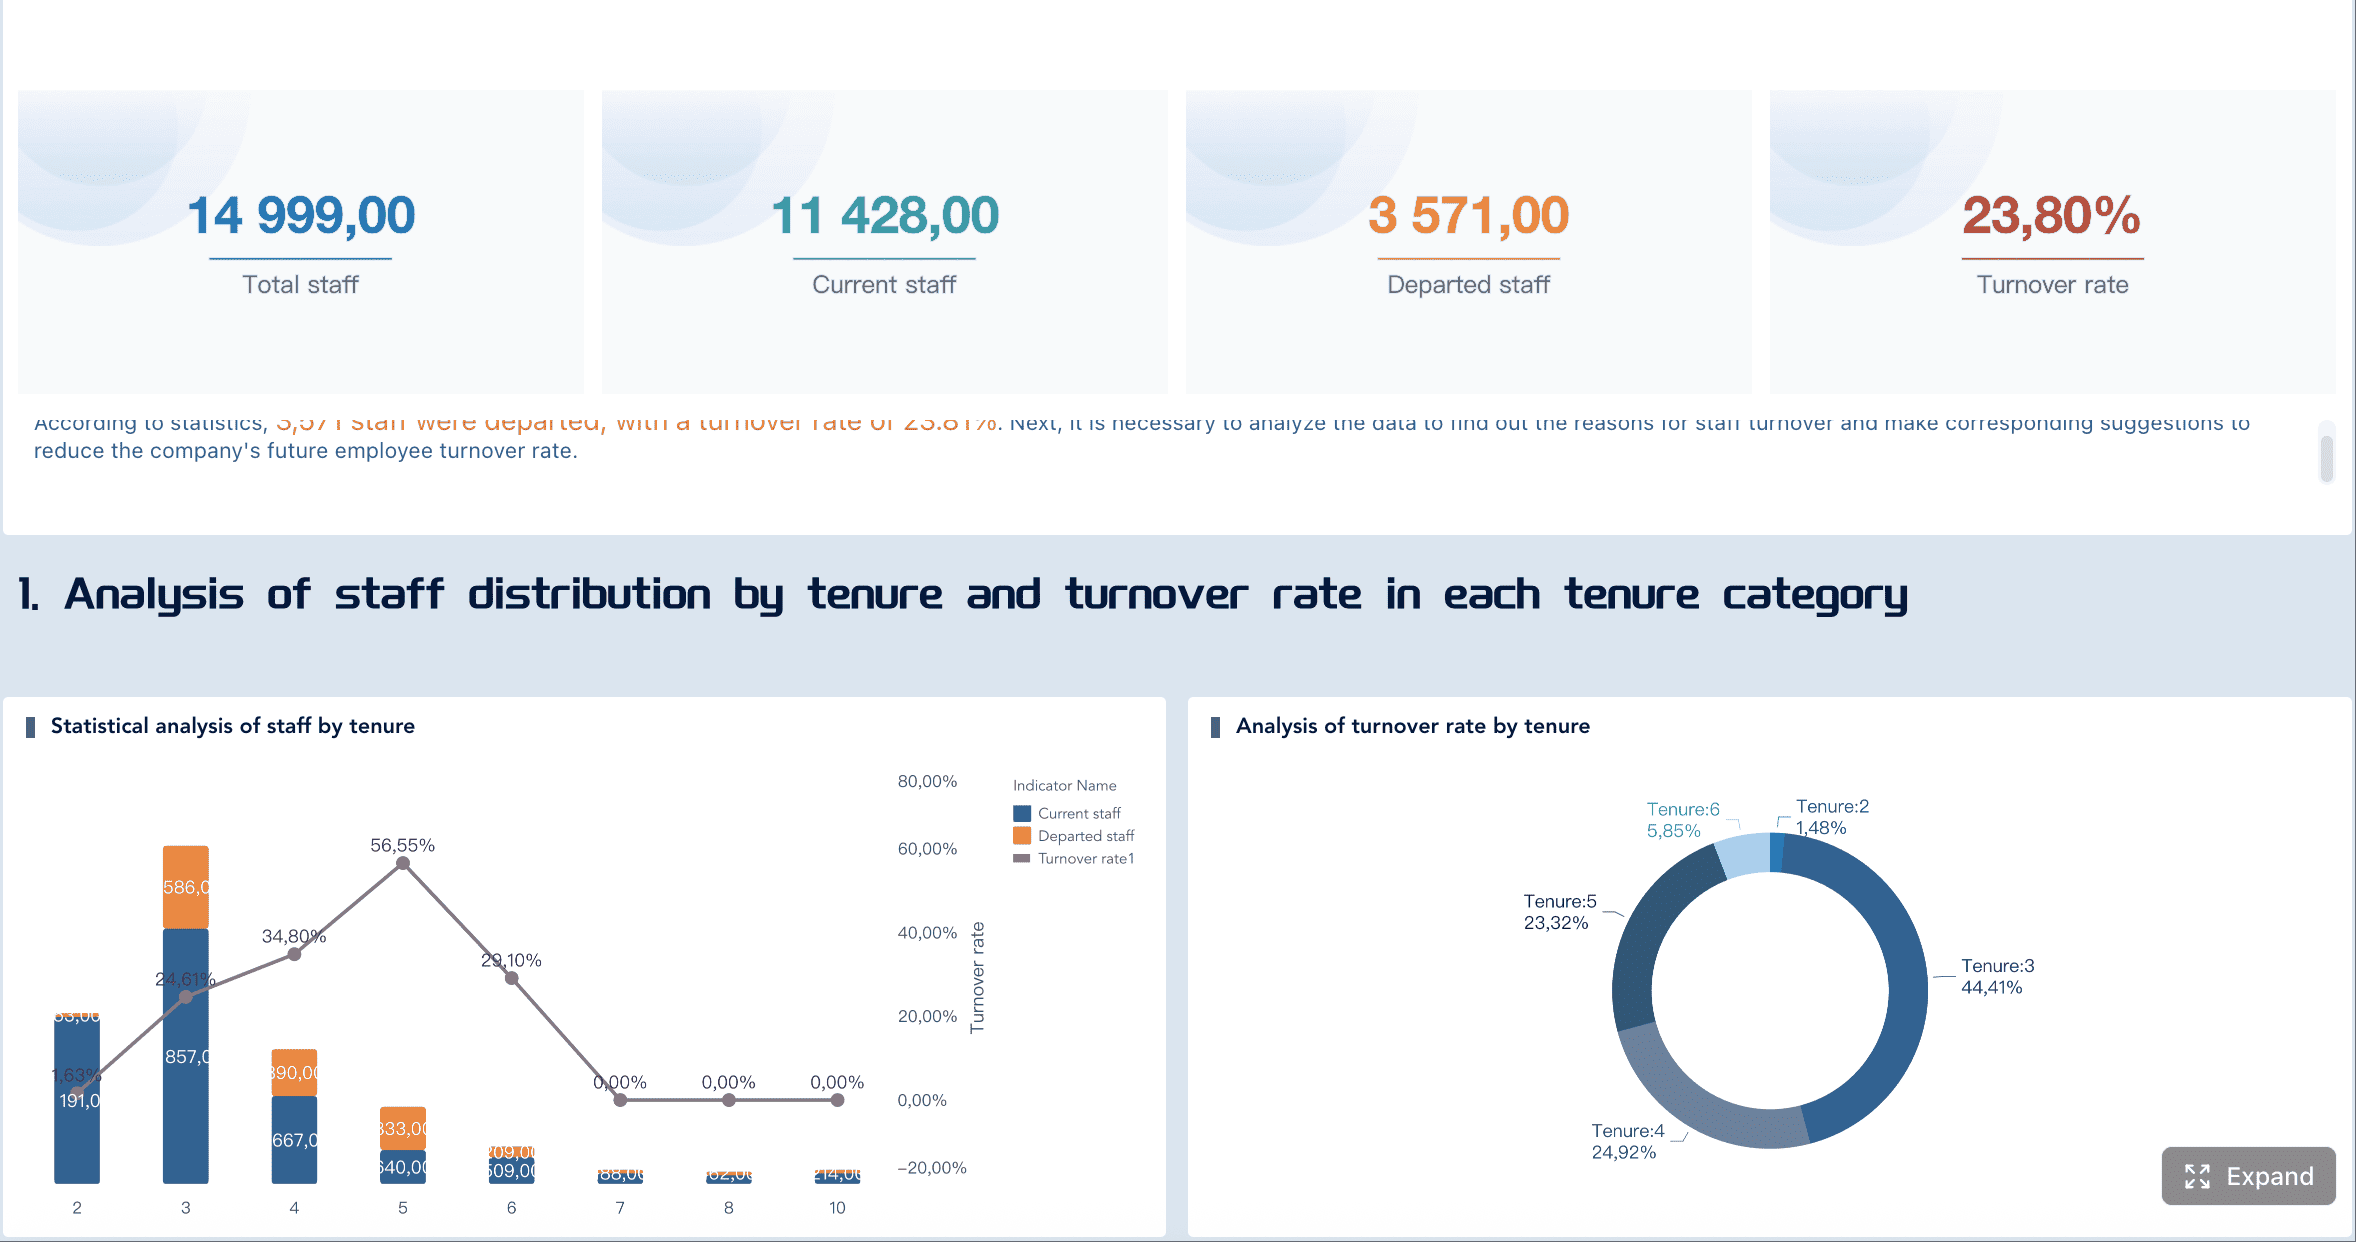
Employee Attendance Dashboard Excel
You want to track attendance and absences. This free dashboard template shows daily, weekly, and monthly attendance. The dashboard excel template helps you spot patterns, manage leave requests, and improve scheduling. You can customize it for your team size and needs.
- Daily, weekly, and monthly attendance tracking.
- Customizable for team size.
- Manage leave requests and scheduling.
- Spot attendance patterns.
Recruitment Pipeline Dashboard
You want to streamline your hiring process. This free dashboard template tracks open roles, aging requisitions, pass-through rates, offer acceptance, and quality of hire. The dashboard excel template gives you real-time visibility into hiring progress. You can see bottlenecks, improve accountability, and reduce report compilation time.
| Metric | Description |
|---|---|
| Workload and priorities | Open roles, aging requisitions, at-risk vacancies. |
| Speed and bottlenecks | Time in stage, pass-through rates, stalled steps. |
| Quality and outcomes | Offer acceptance rates, quality of hire, early performance indicators. |
| Efficiency | Cost per hire, channel performance, sourcing investment. |
| Real-time visibility | Insight into hiring progress. |
| Improved accountability | Visible ownership, timelines, outcomes. |
| Reduced report compilation | Centralized hiring metrics. |
| Candidate velocity increase | Consistent measurement boosts speed. |
Case Study: Eaton improved talent acquisition performance and increased candidate velocity by 30% to 40% using a recruitment pipeline dashboard.
You can find these free dashboard templates at Fine Gallery. The site updates its library regularly and offers layouts for both digital and print formats. If you want to go beyond Excel, FanRuan and FineReport provide advanced dashboard excel solutions for enterprise-level needs. FineReport lets you connect to multiple data sources, automate reporting, and create interactive dashboards with drag-and-drop ease.
Note: The best free dashboard templates for 2026 stand out for usability, customization, visualization, and alignment with your project requirements. You can choose templates based on your skill level and needs.
| Criteria | Description |
|---|---|
| Usability | Easy to navigate and use. |
| Customization options | Flexible to modify for your project. |
| Visualization features | Clear charts and KPIs for data interpretation. |
| User skill levels | Matches your Excel proficiency. |
| Project requirements | Meets your project type and scale. |
If you face challenges like data consolidation, version control, or real-time updates, you can overcome them by using tools like FineReport. It connects to databases, supports collaboration, and provides real-time data integration. You can create dashboards that are always up-to-date and easy to share.
Tip: Project management dashboard templates, KPI performance dashboards, and product metrics dashboards are among the most popular free dashboard templates in 2026. You can use them to visualize complex data and manage multiple projects.
You want to work smarter. The best free dashboard templates help you do just that. Try one today and see the difference.
Why Use Free Project Dashboard Templates?
You want to get more done in less time. That’s where free project dashboard templates come in. These tools help you manage projects, track progress, and make smarter decisions—without spending a dime.
Save Time and Reduce Errors
You don’t want to waste hours building dashboards from scratch. Free project dashboard templates give you instant access to ready-made layouts. You can start tracking tasks, deadlines, and budgets right away. These templates automate calculations, so you don’t have to worry about manual errors.
Here’s how project dashboard templates help you work faster and smarter:
| Feature | Benefit |
|---|---|
| Tracking and Visualization | Enhances clarity during project meetings and updates, saving time. |
| Automation of Calculations | Reduces manual reporting, minimizing errors. |
| Real-time Updates | Provides immediate insights, allowing for timely decision-making. |
| Comprehensive Overview | Collects various project metrics on one page for easier digestion. |
| Visual Data Representation | Graphs provide a snapshot of project status, aiding in quick assessments. |
You can see everything you need at a glance. That means fewer mistakes and more time for what matters.
Professional Results with Minimal Effort
You want your reports to look sharp and organized. The best free project dashboard templates deliver professional results, even if you’re not a designer. You can use Gantt charts, employee schedules, and timesheets with just a few clicks. These templates include visual progress bars, automated calculations, and clear layouts.
For example:
| Template Name | Key Features | Result |
|---|---|---|
| Project Timeline (Gantt Chart) | Task lists, start/end dates, visual progress bars | Projects stay on track, on time, and on budget. |
| Employee Schedule & Timesheet | Shift tracking, automated total hours calculation | Faster, error-free payroll and clear records. |
You can customize dropdown lists, colors, and workflows to match your team’s needs. Many project dashboard templates also work with cloud platforms, so your team can collaborate in real time.
Enhanced Data Insights with FineReport
You want deeper insights and more advanced features? FineReport by FanRuan takes project dashboard templates to the next level. You can connect multiple data sources, automate reporting, and create interactive dashboards with drag-and-drop tools. FineReport helps you visualize complex data and share real-time updates across your organization.

If you need more than what free project dashboard templates offer, FineReport gives you enterprise-level power. You can manage large projects, track KPIs, and make data-driven decisions with ease.
Free project dashboard templates let you start strong. FineReport helps you scale up when you’re ready for more.
How to Use Excel Dashboard Templates
Download and Import Templates
Getting started with excel dashboard templates is simple. First, pick the template that matches your needs, whether it’s a project management dashboard, admin dashboard template, or a kpi dashboard template. Download the file to your computer. Open Excel, then go to “File” and select “Open” to import your new dashboard excel file. You can also use free excel spreadsheet templates for quick setup. Most templates come ready to use, so you can start tracking data right away.
Customize for Your Needs
You don’t have to settle for a one-size-fits-all solution. Excel dashboard templates are designed for flexibility. Change colors, update charts, and add your own data. For example, a budget dashboard template lets you adjust categories and visualize planned versus actual costs. A sales forecast template helps you track future revenue. You can use a workload dashboard template to monitor team assignments or a task tracker dashboard template to follow project progress. Many templates, like the admin dashboard template or kpi dashboard template, include features such as pie charts, risk radar charts, and financial health summaries. Here’s a quick look at what you can customize:
| Template Name | Customization Features |
|---|---|
| Project Management Dashboard | Timeline, pie charts, budget comparison chart |
| Data Quality Dashboard | Valid/invalid records, monthly tracking |
| Budget Dashboard Template | Planned vs actual costs, overview charts |
| Sales Management Dashboard | Regional sales, product performance |
| Project Portfolio Management | Financial health, risk radar charts |
| Multiple Project Dashboard | Status overview for several projects |
Advanced Integration with FineReport
If you want to go beyond basic excel dashboard templates, FineReport gives you more power. You can connect multiple data sources, automate reporting, and build interactive dashboard excel layouts with drag-and-drop tools. FineReport supports customizable dashboards for any business scenario, from financial spreadsheet templates to a cash flow statement template. You can even create a user-friendly dashboard that works on mobile devices. FineReport makes it easy to manage complex data, whether you need an admin dashboard template, a kpi dashboard template, a budget dashboard template, a workload dashboard template, or a task tracker dashboard template. With FineReport, you can turn your dashboards into real-time decision-making tools.
Tip: FineReport helps you create dashboards that grow with your business. You can start with simple templates and scale up to advanced analytics as your needs change.
You can boost your productivity with the best free dashboard Excel templates for 2026. These tools help you save time, reduce errors, and create professional reports with ease. Want more power? Try FineReport by FanRuan for advanced dashboards and real-time data integration.
- Download a template today.
- Visit FineReport’s website for more options.
Tip: The right dashboard can turn your data into smart decisions!


FAQ

The Author
Lewis Chou
Senior Data Analyst at FanRuan
Related Articles

Portfolio Reporting for PMOs: 9 Executive Metrics Every Weekly Portfolio Dashboard Should Include
Weekly portfolio reporting should help executives answer three questions fast: Are we delivering the right initiatives, are we putting outcomes at risk, and what decisions need leadership this week? For PMOs, that means
Yida Yin
Jul 01, 2026

How to Build an Investment Portfolio Reporting Dashboard for Executives: KPIs, Benchmarks, and Drill-Down Views
Investment portfolio reporting for executives is not about showing every holding, transaction, and chart your investment team can produce. It is about giving CEOs, CFOs, CIOs, boards, and investment committees a fast, re
Yida YIn
Jun 25, 2026

12 KPI Reporting Examples for Executive Dashboards: What to Show in Weekly, Monthly, and Quarterly Reviews
Executive leaders do not need more data. They need decision ready $1 examples that match how often they review the business and what actions they are expected to take. A weekly $1 should surface fast moving risks and per
Yida YIn
Jun 25, 2026