Financial analytics is no longer just a support function for month-end reporting. In modern enterprises, it is the operating system behind smarter budgeting, faster decision-making, stronger cash management, and better risk control. When done well, financial analytics helps leaders move from asking “What happened?” to answering “Why did it happen, what is likely to happen next, and what should we do now?”
This guide explains how financial analytics works from end to end, from raw finance data collection to executive action, while also covering the core methods, metrics, tools, skills, and best practices that matter most for finance leaders.
In simple terms, financial analytics is the process of collecting, organizing, analyzing, and interpreting financial data to support better business decisions. It transforms raw numbers from accounting systems, planning files, operational platforms, and market sources into practical insight about performance, profitability, liquidity, efficiency, and risk.
At its core, financial analytics helps organizations answer questions such as:
Financial analytics is related to accounting and reporting, but it is not the same thing.
| Function | Main focus | Typical output |
|---|---|---|
| Bookkeeping | Record transactions accurately | Ledgers, entries, reconciliations |
| Accounting | Prepare and classify financial information | Financial statements, compliance records |
| Reporting | Present results to stakeholders | Monthly reports, management packs |
| Financial analytics | Explain performance and guide decisions | Insights, forecasts, scenarios, recommendations |
Bookkeeping and accounting establish the financial record. Reporting summarizes it. Financial analytics goes further by identifying drivers, testing assumptions, comparing alternatives, and helping executives choose the best course of action.
This is why senior leaders rely heavily on analytics. A CFO, CEO, business unit head, or board member rarely needs more raw data. They need clarity on what is changing, what matters most, and what decisions will improve outcomes. Financial analytics provides that layer of interpretation.

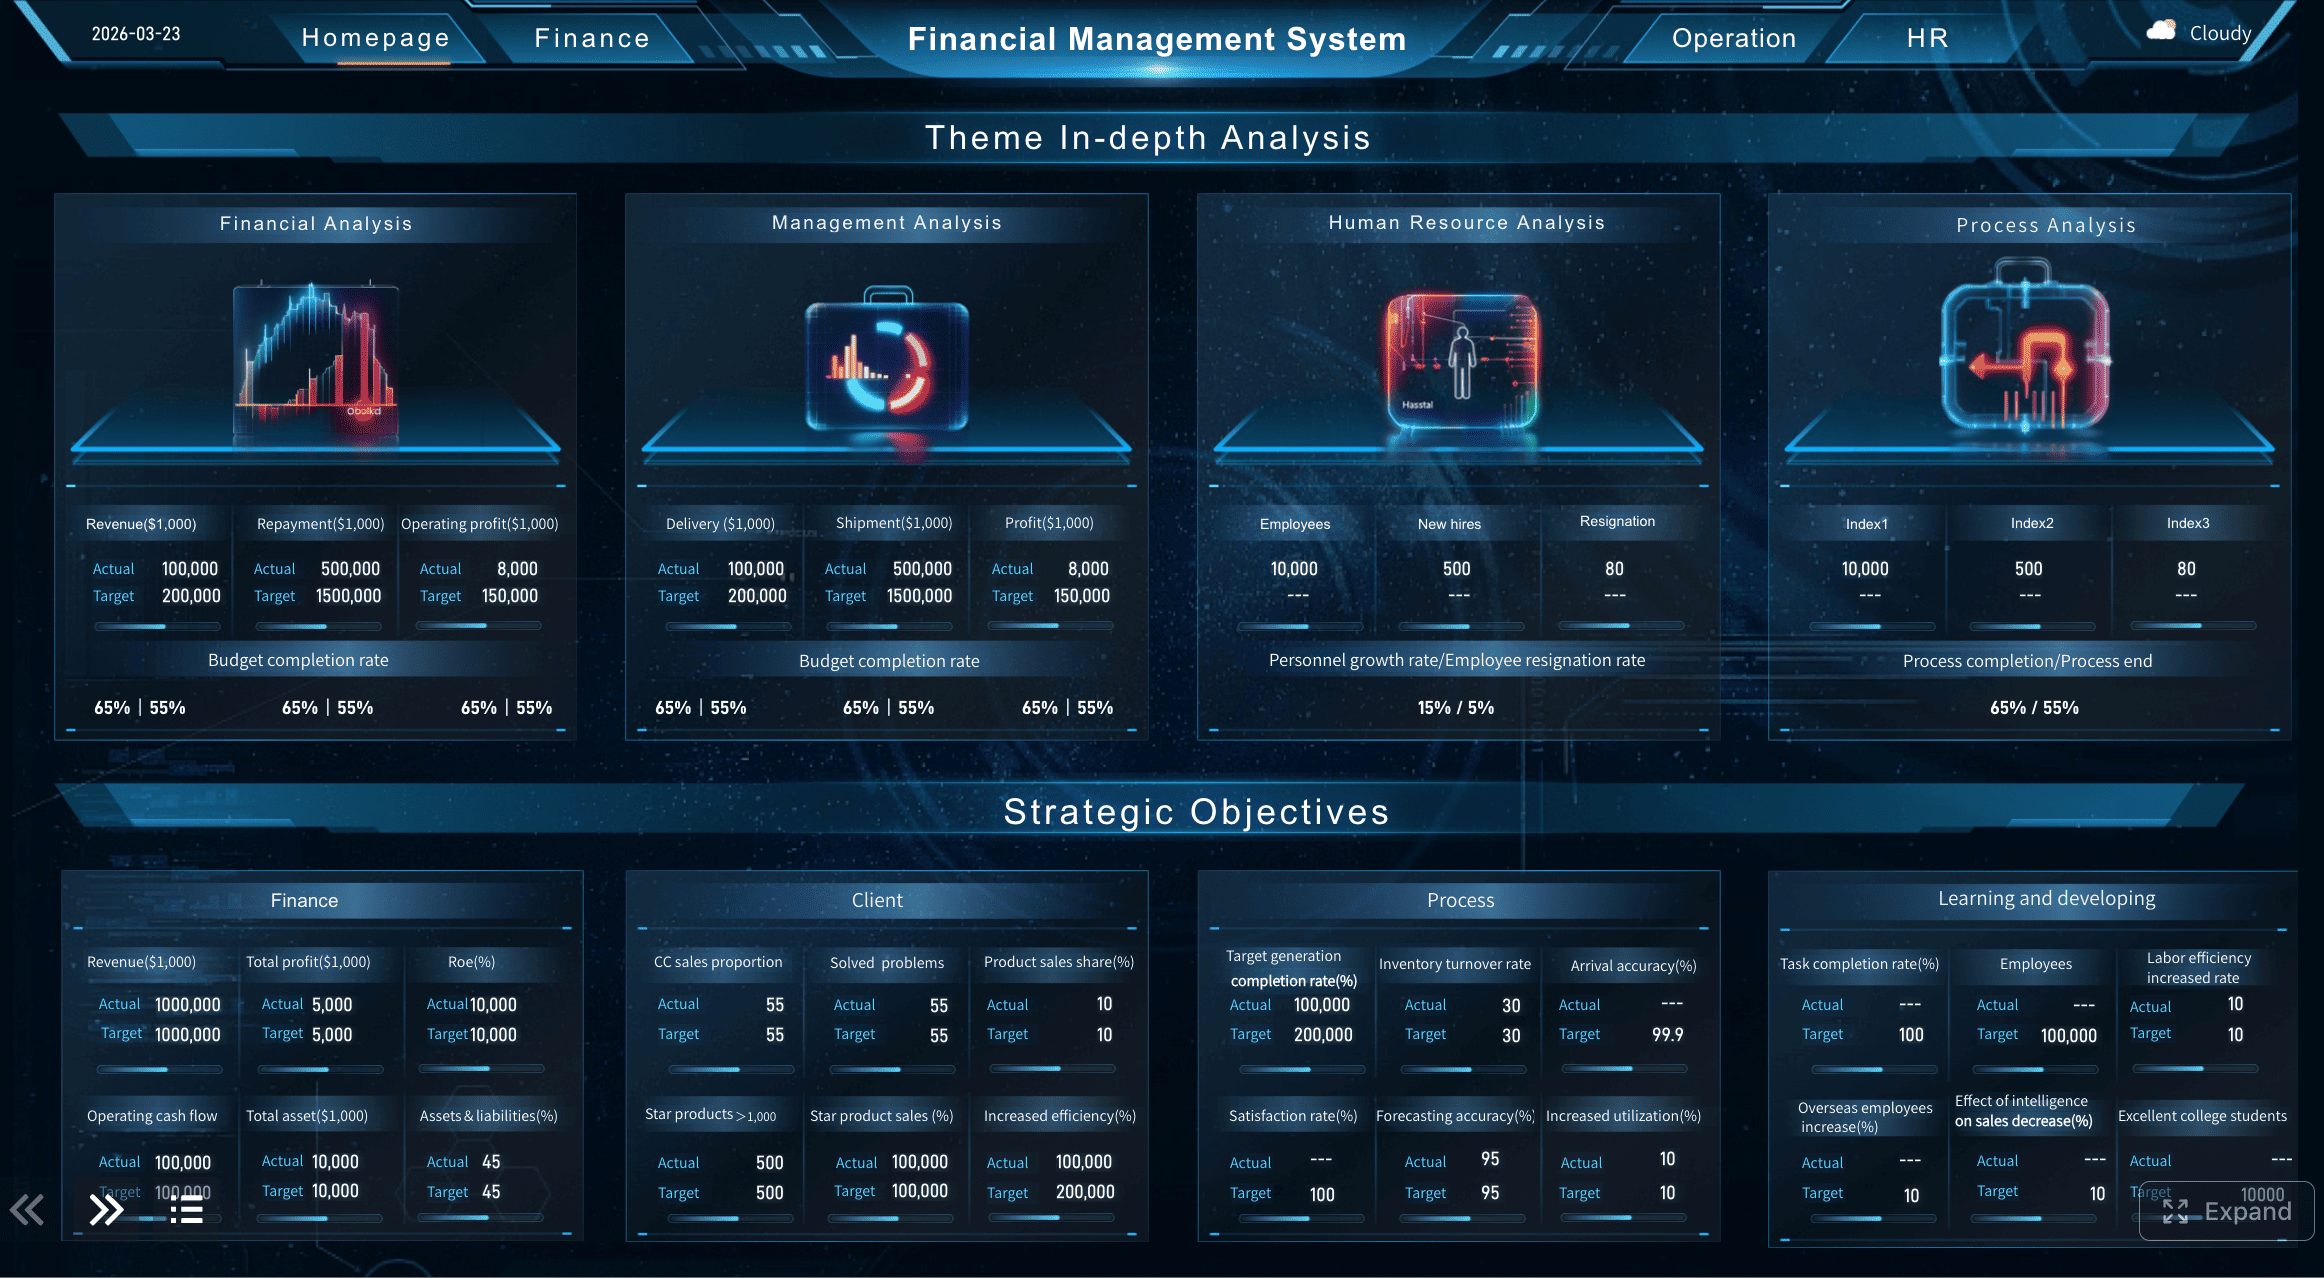
All dashboards in this article are built with FineReport.
In practice, executives use financial analytics to support:
Without strong analytics, organizations often fall back on fragmented spreadsheets, delayed reporting, and intuition-based decisions. That creates risk, especially in volatile markets where speed and accuracy matter.
Financial analytics is a structured process. While the tools may vary by organization, the workflow usually follows four stages: data collection, data preparation, analysis, and decision support.
The process begins by bringing together the relevant data. In most companies, financial information lives across multiple systems rather than one clean, complete source.
Common finance data sources include:
For example, a finance team evaluating margin performance may need revenue from the ERP, discounts from the CRM, labor cost from payroll, indirect allocations from the general ledger, and commodity pricing from external feeds. Until these inputs are gathered into a usable structure, meaningful analysis cannot begin.
This is where data quality and governance become critical. If source systems use inconsistent account mappings, outdated dimensions, duplicated entries, or conflicting metric definitions, the analytics output will be unreliable. A polished dashboard cannot fix broken input data.
Before analysis starts, organizations need to ensure:
A strong foundation here reduces disputes later about whose numbers are correct.
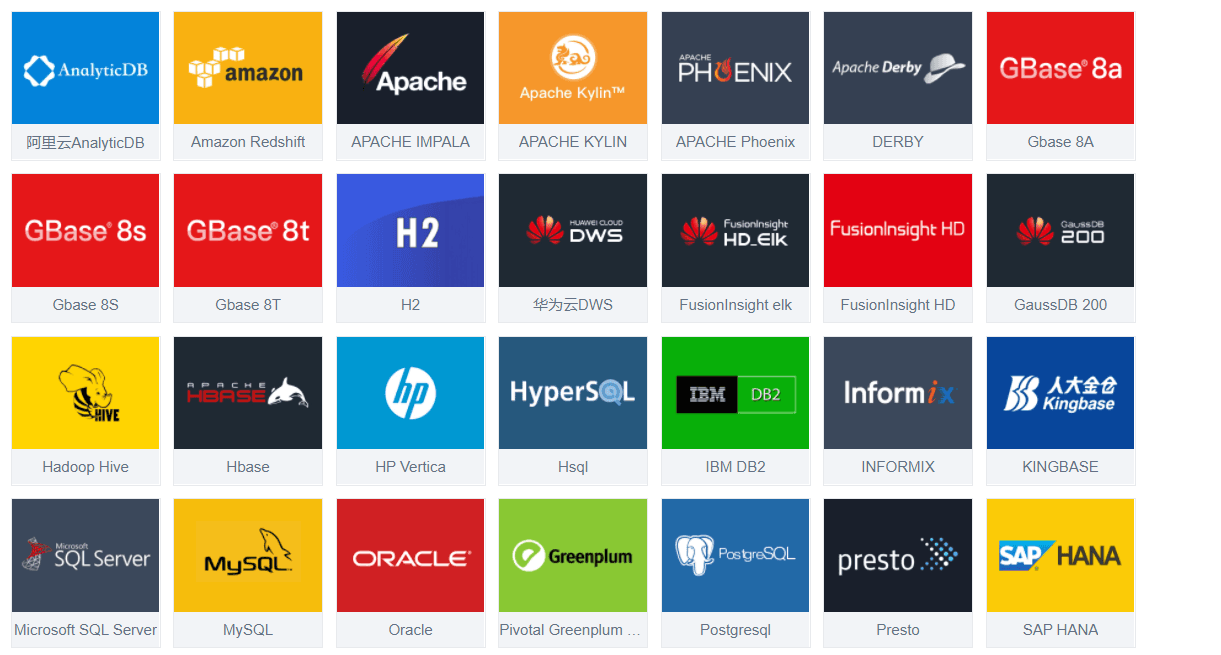 FineReport supports multiple data sources.
Once data is collected, the next step is preparation. This often takes more effort than the analysis itself because finance data is rarely analysis-ready when first extracted.
Teams typically need to:
For instance, one system may classify a cost as “marketing,” another as “brand spend,” and a third as “customer acquisition.” If these categories are not standardized, executives may see misleading trends.
A reliable data model solves this problem by creating a consistent structure for reporting and analysis. When finance teams work from a trusted model, they can answer questions faster and with more confidence. It also reduces the repeated manual effort of rebuilding reports every month.
For many enterprises, this is the stage where modern reporting and analytics platforms become especially valuable. Instead of relying on disconnected spreadsheets, teams can centralize financial data, define standard metrics, and automate refresh cycles. Solutions such as FineReport are often useful here because they help organizations build unified dashboards, connect multiple data sources, and present complex finance results in a more controlled and scalable way.
After the data is clean and structured, the real analytical work begins. This stage focuses on understanding what is happening in the business and why.
Common methods used in financial analytics include:
Each method serves a different purpose.
Variance analysis compares actual performance with budget, forecast, or prior period. It helps reveal where results beat or missed expectations.
Trend analysis looks at patterns over time, such as revenue growth, expense escalation, or margin compression.
Profitability analysis evaluates which products, channels, regions, or customers contribute the most profit after direct and indirect costs.
Forecasting projects future outcomes based on historical performance, current run rates, and planned changes.
Scenario modeling tests “what if” questions, such as the impact of a price increase, hiring freeze, capex delay, or foreign exchange shift.
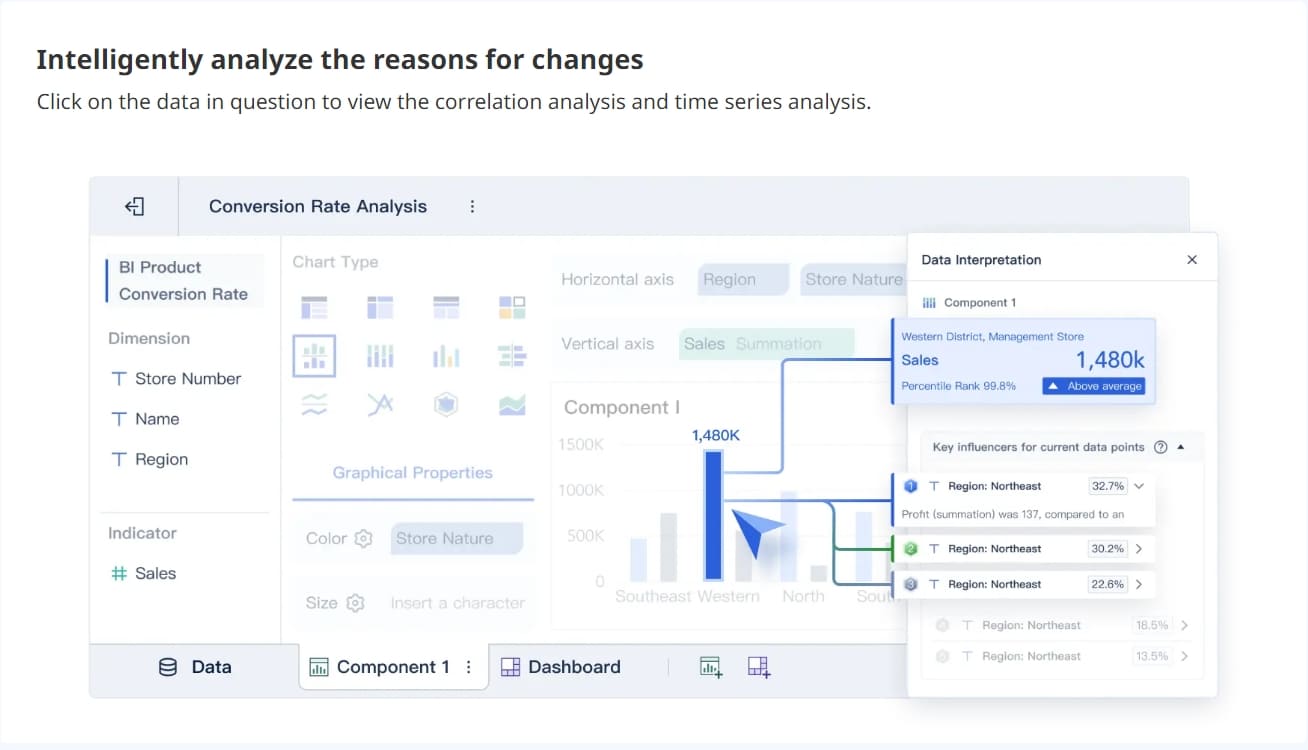
The most valuable finance teams do more than present numbers. They connect numbers to business drivers. For example:
This movement from data to explanation is what makes financial analytics actionable.
Analysis only matters if it changes decisions. The final stage is translating findings into formats executives can understand quickly and use confidently.
That usually includes:
A good executive output is not a dump of charts. It highlights what changed, why it changed, what it means, and what leadership should do next.
For example, financial analytics may lead to decisions such as:
This is where finance becomes a strategic partner rather than a reporting center. When analytics is clear, timely, and trusted, executives can act earlier and with less uncertainty.
Financial analytics depends on a mix of business metrics, analytical methods, and technology. The right combination helps organizations move from descriptive reporting to forward-looking decision support.
The exact KPI set varies by industry and business model, but most leadership teams watch a common group of financial measures.
Revenue growth shows whether the business is expanding and at what pace. It is often analyzed by:
Margin reveals how efficiently revenue turns into profit. Common views include:
Margin analysis is especially important when input costs, pricing pressure, or sales mix changes are affecting profitability.
A profitable business can still face liquidity problems. That is why finance leaders monitor:
Working capital analytics focuses on short-term operational efficiency. Key measures include:
Opex analysis helps control fixed and variable cost growth. Leaders often track spending by:
Not all revenue is equally valuable. Customer profitability analysis helps identify:
Return metrics help evaluate capital efficiency and investment performance. Common examples include:
Financial analytics uses several layers of analysis, each with a different business purpose.
Historical analysis reviews past performance to establish what happened. This includes monthly reviews, year-over-year comparisons, and trend summaries. It is the starting point for understanding baseline performance.
Diagnostic analysis explains why a result occurred. It goes deeper than reporting by identifying causal drivers, such as mix changes, pricing decisions, operational bottlenecks, or cost spikes.
Predictive forecasting estimates likely future outcomes based on historical patterns, business assumptions, and current signals. In finance, this often includes:
Scenario planning explores alternative outcomes before decisions are made. It helps leaders understand trade-offs under uncertainty.
Typical scenario questions include:
Scenario planning is one of the most practical parts of financial analytics because it supports real executive choices.
Financial analytics can be performed with many technologies, but capability maturity usually grows in stages.
| Tool category | Typical use | Strength | Limitation |
|---|---|---|---|
| Spreadsheets | Ad hoc analysis, modeling | Flexible and familiar | Error-prone at scale |
| BI dashboards | Visual reporting, KPI tracking | Fast insight delivery | Depends on good data modeling |
| FP&A tools | Budgeting, forecasting, scenarios | Better planning discipline | Can require process redesign |
| Data warehouses | Centralized, governed data | Single source of truth | Setup effort and governance needed |
| Automation workflows | Data refresh, report distribution | Saves manual effort | Requires clear rules and ownership |
Spreadsheets still play an important role, especially for quick analysis and bespoke financial models. But when organizations depend on spreadsheet chains for enterprise reporting, version control and trust become major issues.
This is why many finance teams invest in dashboards and managed reporting platforms. A solution like FineReport can help bridge the gap between finance data complexity and executive usability by enabling automated dashboard creation, multi-source integration, and highly structured report delivery for board packs, management reporting, and KPI monitoring.
Advanced analytics and machine learning can also add value, particularly in areas such as:
However, these tools should enhance financial judgment, not replace it. Finance decisions still depend on business context, assumptions, and leadership priorities.
Strong financial analytics is not just about buying better software. It depends on process discipline, governance, and alignment with business decisions.
Many analytics efforts fail because they begin with available data rather than decision needs. Finance teams should first clarify which business questions matter most.
Examples include:
When analytics starts from decisions, the outputs are more focused and more likely to drive action.
Trust is everything in finance. If stakeholders question the numbers, adoption collapses.
A practical governance approach should define:
This is especially important in large enterprises where different functions may define the same metric in different ways.
Executives do not need every calculation detail. They need clarity.
The best finance outputs typically include:
A dashboard should not force a CEO or business leader to interpret accounting logic on their own. It should guide them directly to the signal.
For finance teams building standardized executive reporting, a structured dashboard platform can be far more effective than static slides. FineReport, for example, is often a practical choice for organizations that want finance dashboards and management reports that are easier to refresh, easier to distribute, and easier for non-technical stakeholders to consume.
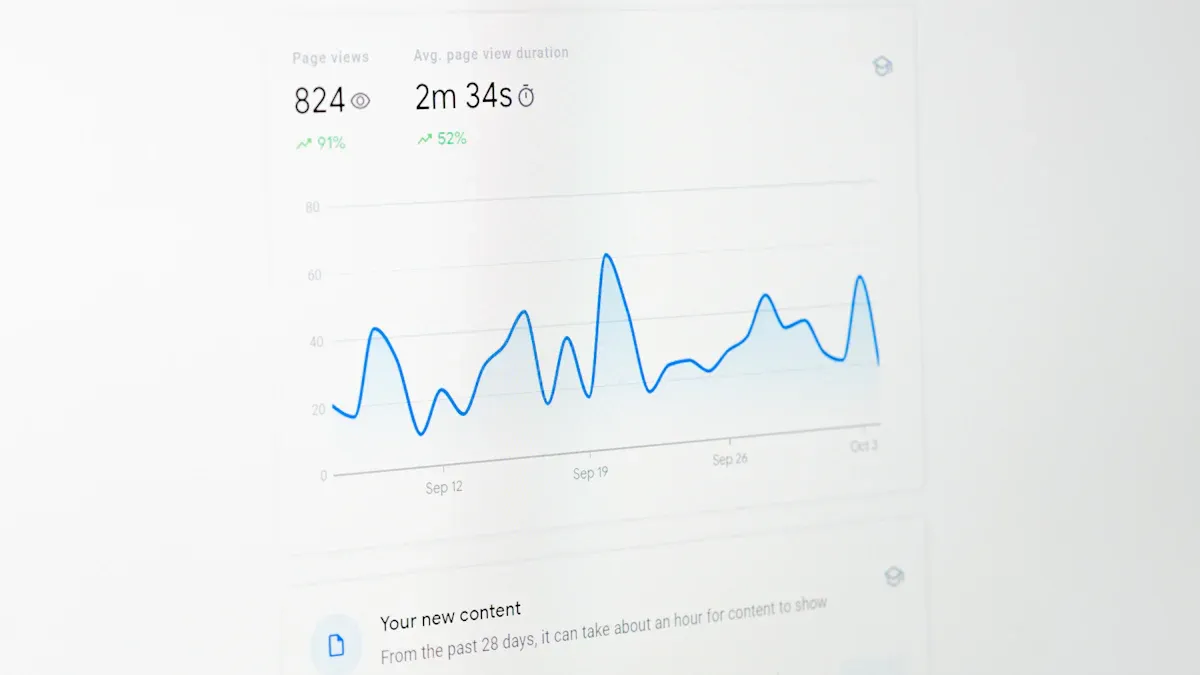
 Real-time analysis
Financial analytics should evolve as the business changes. Forecasts need to be compared with actuals. Assumptions need to be tested. Models need to be refined when they no longer reflect operating reality.
A continuous improvement cycle usually includes:
The goal is not a perfect model. The goal is a useful and improving model that supports better decisions over time.
As financial analytics becomes more central to business strategy, demand is growing for professionals who can combine finance knowledge with data fluency and communication skill.
The strongest financial analytics professionals usually combine technical ability with business judgment.
Key skills include:
Technical skill alone is not enough. A finance analyst who can build a model but cannot explain the business implication will have limited impact. Likewise, someone with strategic instincts but weak data discipline may produce unreliable conclusions.
Financial analytics spans several roles, depending on company size and maturity.
Often responsible for reporting, budgeting support, variance analysis, and periodic performance reviews.
Typically focused on planning, forecasting, scenario analysis, management reporting, and business performance insight.
Acts as the link between finance and operating teams, translating business activity into financial implications and supporting decision-making.
Oversees reporting frameworks, KPI design, data quality improvement, dashboard delivery, and cross-functional analytics initiatives.
Use financial analytics to evaluate expansion plans, pricing strategies, investments, M&A cases, and long-range planning.
In many organizations, these roles increasingly overlap. The trend is clear: finance professionals are expected to move beyond report preparation and contribute more directly to strategic decisions.
There is no single path into financial analytics, but common entry points include degrees in:
University programs, specialized master’s degrees, online certifications, and employer-led training can all help professionals build relevant capabilities. Topics often include financial modeling, data visualization, analytics tools, forecasting, and quantitative methods.
Professional growth also comes from hands-on exposure to:
Job outlook, salary, and role scope vary by industry, location, and experience level. In general, professionals who combine strong finance fundamentals with analytics and communication skills tend to have broader advancement opportunities.
Despite its value, financial analytics is not always easy to implement well. Many organizations struggle with structural and cultural obstacles.
Common challenges include:
These issues often lead to delayed decisions, duplicated effort, and endless debates about which number is correct.
At the same time, the future of financial analytics is becoming more dynamic. Several trends are reshaping the function:
Routine extraction, reconciliation, and report distribution can increasingly be automated. This frees finance teams to spend more time on interpretation and planning rather than assembling reports.
Monthly reporting alone is often too slow. Leaders want faster visibility into revenue, cash, cost, and risk signals so they can respond earlier.
AI can help finance teams identify anomalies, generate first-pass commentary, improve forecast models, and surface relevant trends faster. But AI is most effective when layered onto governed data and reviewed by experienced finance professionals.
Even with better automation and more advanced tools, the core of financial analytics remains human. Models do not fully understand strategic context, organizational politics, customer relationships, or risk appetite. Leaders still need finance professionals who can interpret results, challenge assumptions, and communicate trade-offs clearly.
That is why the most future-ready finance teams are not trying to replace human judgment. They are strengthening it with better data, better systems, and better analytical workflows.
Financial analytics works by turning fragmented finance data into structured insight and then turning that insight into decisions. The process starts with data collection, improves through cleaning and standardization, gains value through analysis, and creates impact when executives act on the findings.
For enterprise leaders, the goal is not simply more reporting. It is better financial visibility, faster decisions, and stronger confidence in where the business is heading.
Organizations that invest in reliable financial analytics capabilities are better positioned to:
And for finance teams aiming to scale these capabilities, the combination of sound governance, strong business alignment, and modern reporting platforms matters greatly. When used appropriately, tools like FineReport can help transform financial analytics from a manual reporting burden into a trusted decision engine for executives.

In the end, financial analytics is not just about understanding numbers. It is about helping the business make better choices with them.
Financial analytics is the process of turning raw financial data into insights that help leaders understand performance, forecast outcomes, and make better business decisions. It goes beyond reporting by explaining what happened, why it happened, and what actions to take next.
It usually starts with collecting data from systems like ERP, accounting, payroll, and CRM platforms, then cleaning and standardizing that data for analysis. Finance teams then use models, metrics, and dashboards to identify trends, test scenarios, and support executive decisions.
Financial reporting focuses on presenting historical results, such as monthly statements or management reports. Financial analytics uses that information along with other data to explain drivers, evaluate alternatives, and guide future actions.
Financial analytics helps organizations improve budgeting, forecasting, cash flow management, profitability analysis, and risk control. It also gives executives faster, clearer insight so they can make more confident decisions.
Poor data quality leads to inconsistent metrics, unreliable dashboards, and decisions based on incorrect numbers. Strong governance, standard definitions, and reconciliation rules help ensure the analysis is accurate and trusted.

The Author
Yida Yin
FanRuan Industry Solutions Expert
Related Articles

KPI Marketing Report for Enterprise Stakeholders: What to Track, How to Structure the Dashboard, and When to Report
A kpi $1 is not just a dashboard for the marketing team. In an enterprise environment, it is a decision support system that helps executives, finance leaders, sales stakeholders, and regional operators understand whether
Yida Yin
May 27, 2026

Record to Report Process Transformation in 7 Steps for a Faster, More Controlled Close
$1 transformation is the disciplined redesign of the financial close cycle to make period end reporting faster, more accurate, and easier to control. For finance leaders, controllers, shared services managers, and CIOs,
Yida Yin
May 26, 2026
How to Build a Wealth Management Report Dashboard: KPIs, Data Sources, and Workflow
A strong wealth management report dashboard helps advisors, branch managers, and firm leadership answer one question fast: where are we growing, where are we leaking value, and what action should we take next? In practic
Yida Yin
May 25, 2026


