Retail data analysis is reshaping how businesses operate in 2026. You’ve probably noticed how companies are getting smarter about predicting trends and understanding customers. That’s no coincidence. Data is the driving force behind this transformation. For example, Walmart cut overstocked inventory by 30% using data-driven for ecasting, while Target boosted revenue by 15% with price optimization. These aren’t just numbers—they’re proof of how analytics can make or break success.
The right tools are your secret weapon. They help you dive deep into customer behavior, optimize inventory, and even predict what’s next. With 69% of organizations reporting better decisions through data, it’s clear that analytics isn’t just a trend—it’s a necessity. Whether you’re a small retailer or a global brand, leveraging data effectively can give you a competitive edge.
The data panel and system construction of the cases in this article are implemented by FanRuan's products. Click the button below to use the functions of the latest version of FanRuan's products for free, come and try it!
Data-Driven Decisions: Tools like FineBI and FineReport turn raw data into actionable insights, enabling real-time adjustments and better decision-making.
Customer and Inventory Insights: Analyzing data helps understand customer preferences and optimize inventory, reducing waste and improving satisfaction.
Ease and Scalability: Choose user-friendly, scalable tools; FineBI and FineReport offer simple designs and free trials to test their fit for your business.
What Are Retail Data Analysis Tools?
Definition and Purpose
Retail data analysis tools are your go-to solutions for making sense of the vast amounts of data generated in the retail world. These tools help you collect, process, and analyze data from various sources like sales transactions, customer interactions, and inventory systems. Their ultimate goal? To turn raw data into actionable insights that drive smarter decisions.
Think of these tools as your retail business's secret weapon. They help you understand customer behavior, predict trends, and optimize operations. Whether you're analyzing in-store purchases or tracking online shopping habits, these tools ensure you're always one step ahead.
Here’s a quick breakdown of what these tools can do:
Category
Purpose
In-store analytics
Analyzes consumer purchasing trends using data from POS systems and security cameras.
Customer analytics
Uses data from customer-facing systems to understand product popularity and customer behavior.
Inventory analytics
Evaluates inventory levels to recommend effective distribution and restocking practices.
Merchandise analytics
Assesses product showcasing in stores to enhance customer purchasing decisions.
Business intelligence
Communicates key performance indicators through dashboards for management insights.
Sales forecasting
Projects future sales based on real data and demand forecasting to ensure adequate inventory.
FineBI and FineReport, two standout data analysis software solutions from FanRuan, excel in these areas. FineBI empowers you with self-service analytics, making it easy for non-technical users to explore data independently. On the other hand, FineReport specializes in creating pixel-perfect reports and dashboards, ideal for businesses needing detailed and visually stunning presentations.
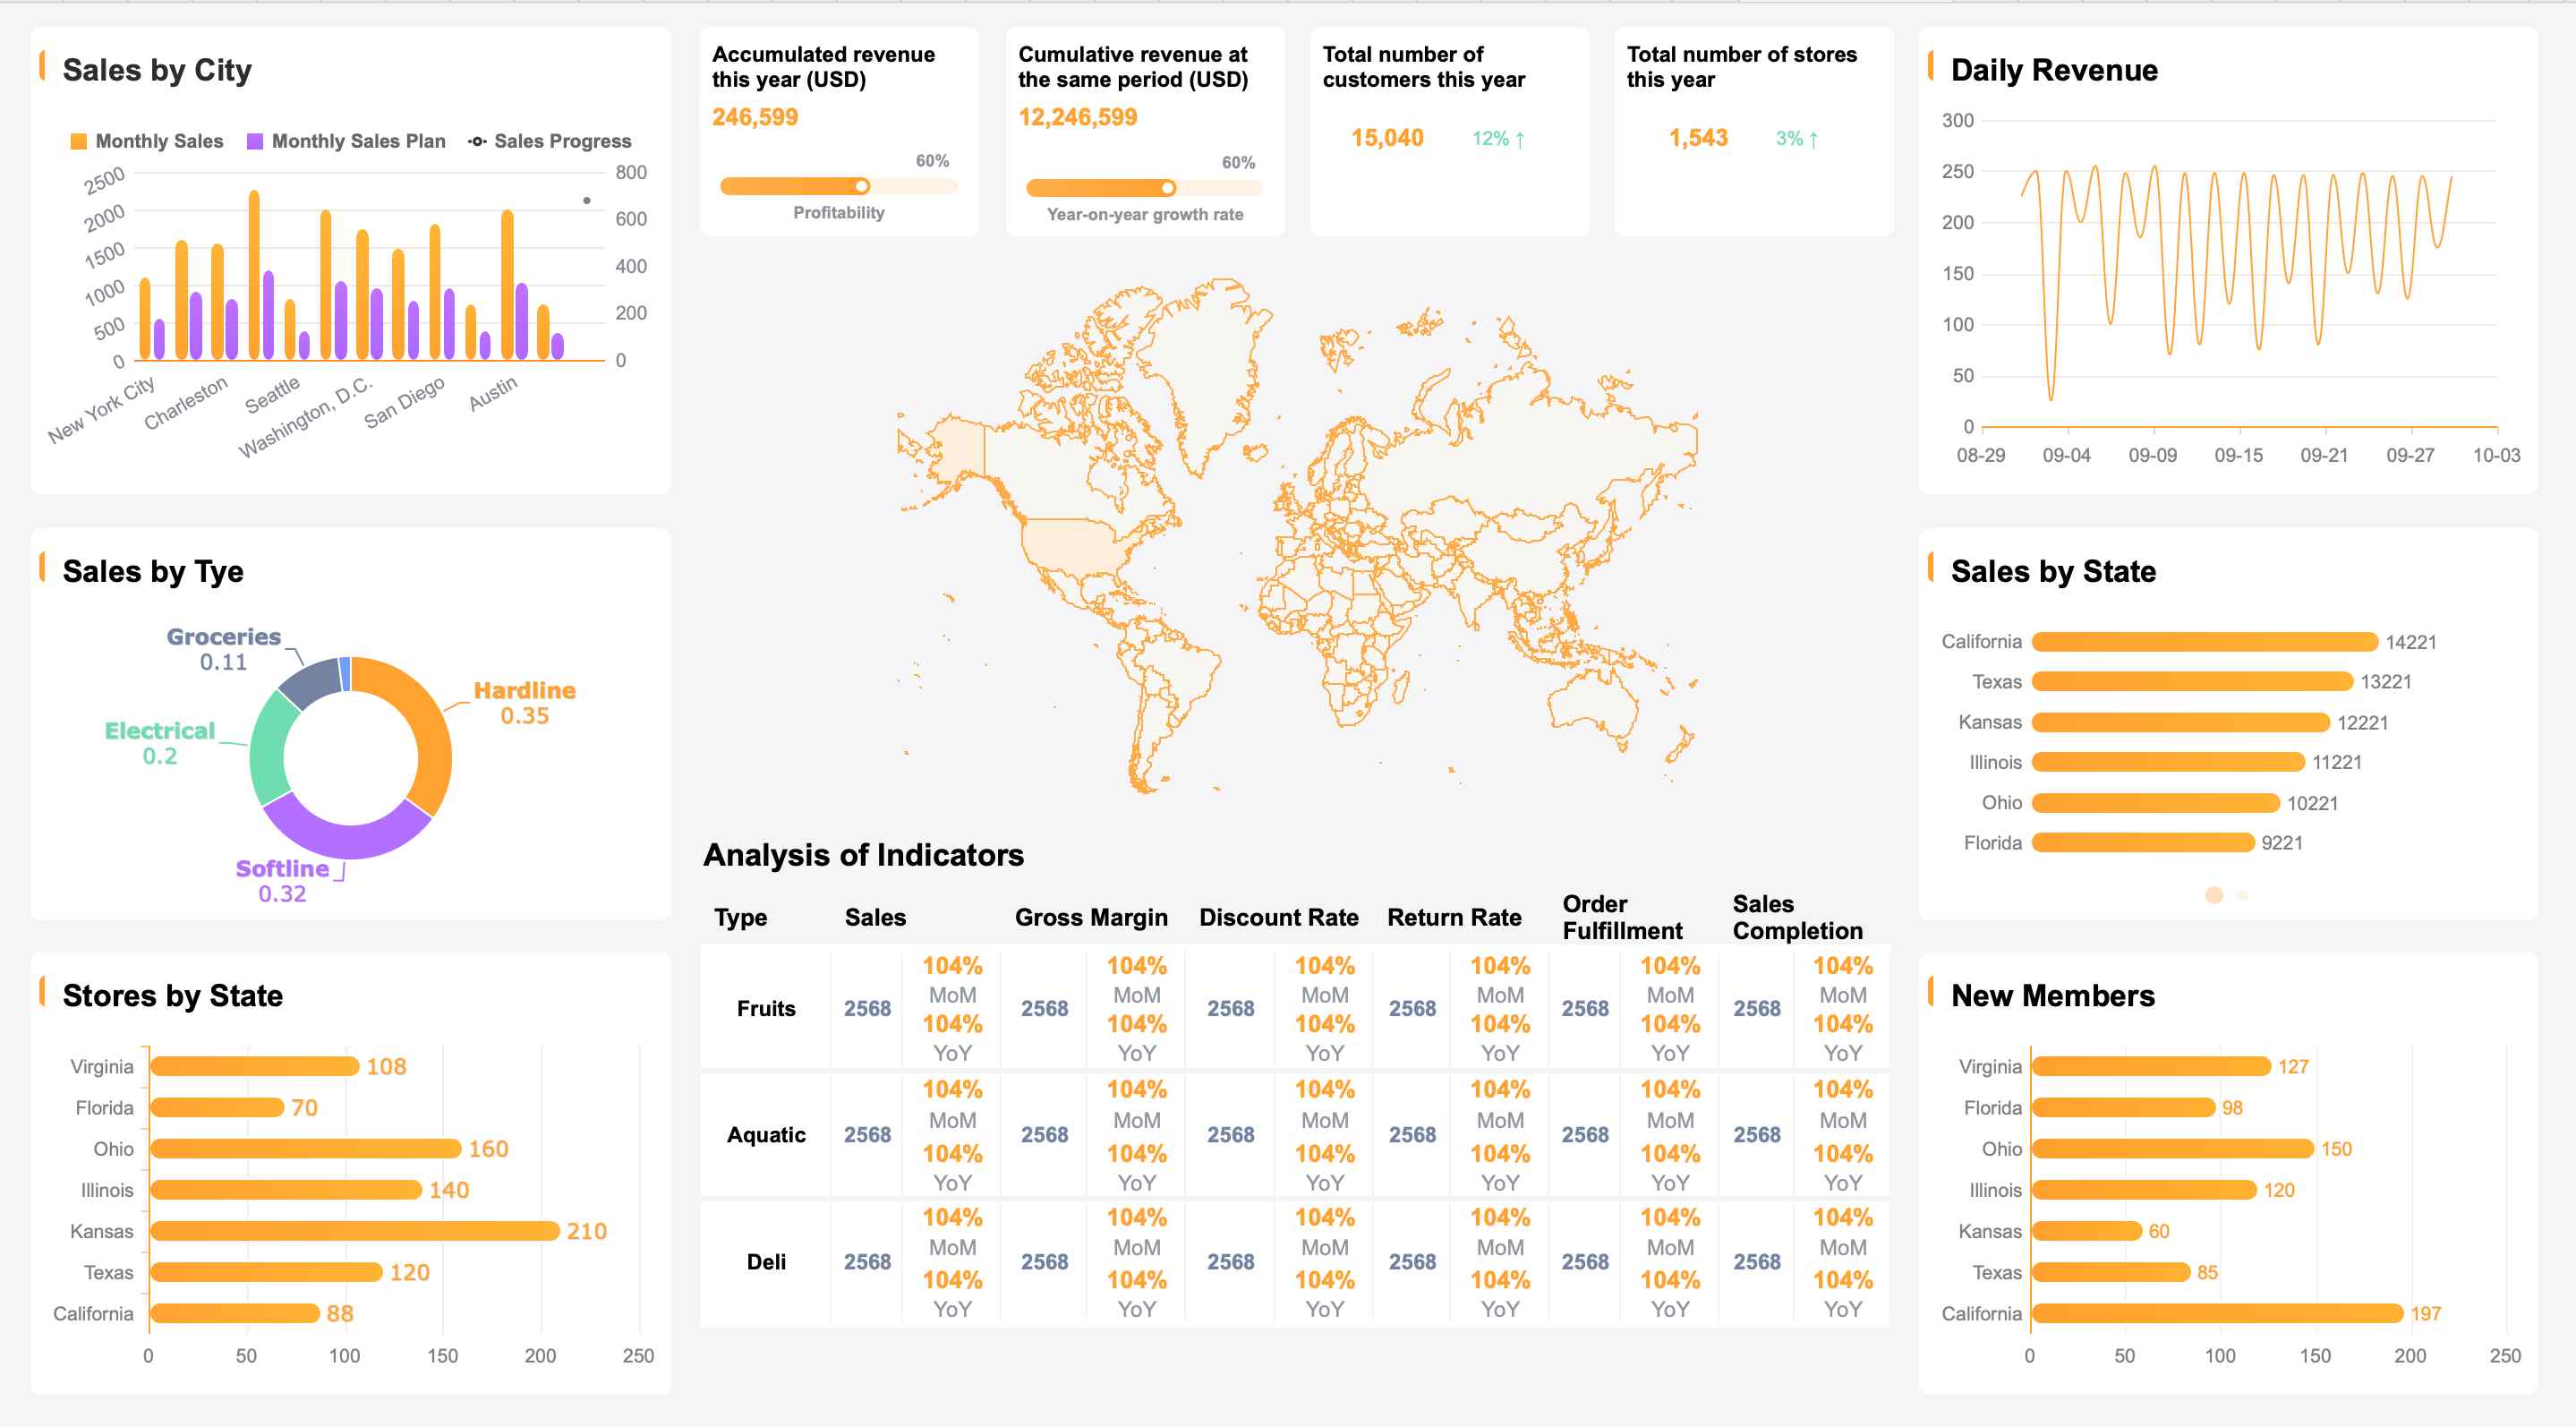
E-commerce Popular Products Analysis Dashboard Created By FineReport
Key Benefits for Retailers
Improved Decision-Making
Retail data analysis tools give you the power to make decisions based on facts, not guesses. For instance, FineBI's real-time dashboards let you monitor sales trends as they happen. This means you can adjust your strategies on the fly, whether it's tweaking prices or reallocating inventory. With tools like these, you're not just reacting to changes—you’re anticipating them.
Enhanced Customer Insights
Understanding your customers is key to staying competitive. Tools like FineBI and FineReport help you dive deep into customer data, revealing patterns and preferences. For example, Best Buy uses customer analytics to personalize marketing campaigns, boosting loyalty and engagement. With FineBI, you can achieve similar results by segmenting customers and tailoring your offers to their needs.
Optimized Inventory Management
Nobody likes stockouts or overstocked shelves. Retail data analysis tools, such as FineReport, help you strike the perfect balance. By analyzing sales data and inventory levels, you can predict demand more accurately. Lowe's, for example, uses analytics to optimize product assortment and store layouts, ensuring customers find what they need when they need it.
Increased Profitability
At the end of the day, it’s all about the bottom line. Tools like FineBI and FineReport help you identify high-ROI opportunities, streamline operations, and reduce waste. Dynamic pricing strategies, powered by real-time data, can maximize profits while keeping you competitive. With these tools, you're not just running a business—you’re growing it.
Retail data analysis isn’t just a buzzword; it’s a game-changer. Whether you’re using FineBI for self-service analytics or FineReport for enterprise-level reporting, these tools equip you with the insights needed to thrive in today’s fast-paced retail environment.
Top Tools for Retail Data Analysis in 2026
FineBI: Self-Service BI for Retail Analytics
Key features
FineBI is a game-changer for retailers who want to take control of their data. This self-service business intelligence tool empowers you to explore and analyze data independently, without relying on IT teams. Its drag-and-drop interface makes it incredibly user-friendly, even if you’re not a data expert. FineBI connects seamlessly to various data sources, including relational databases, big data platforms, and Excel files, ensuring you can unify all your data in one place.
One standout feature is its OLAP (Online Analytical Processing) capabilities. You can drill down into data, filter it, and even link different datasets for cross-theme analysis. FineBI also offers real-time dashboards, so you can monitor sales trends or inventory levels as they happen. Plus, its data visualization options include over 60 chart types, making it easy to present your findings in a visually compelling way.
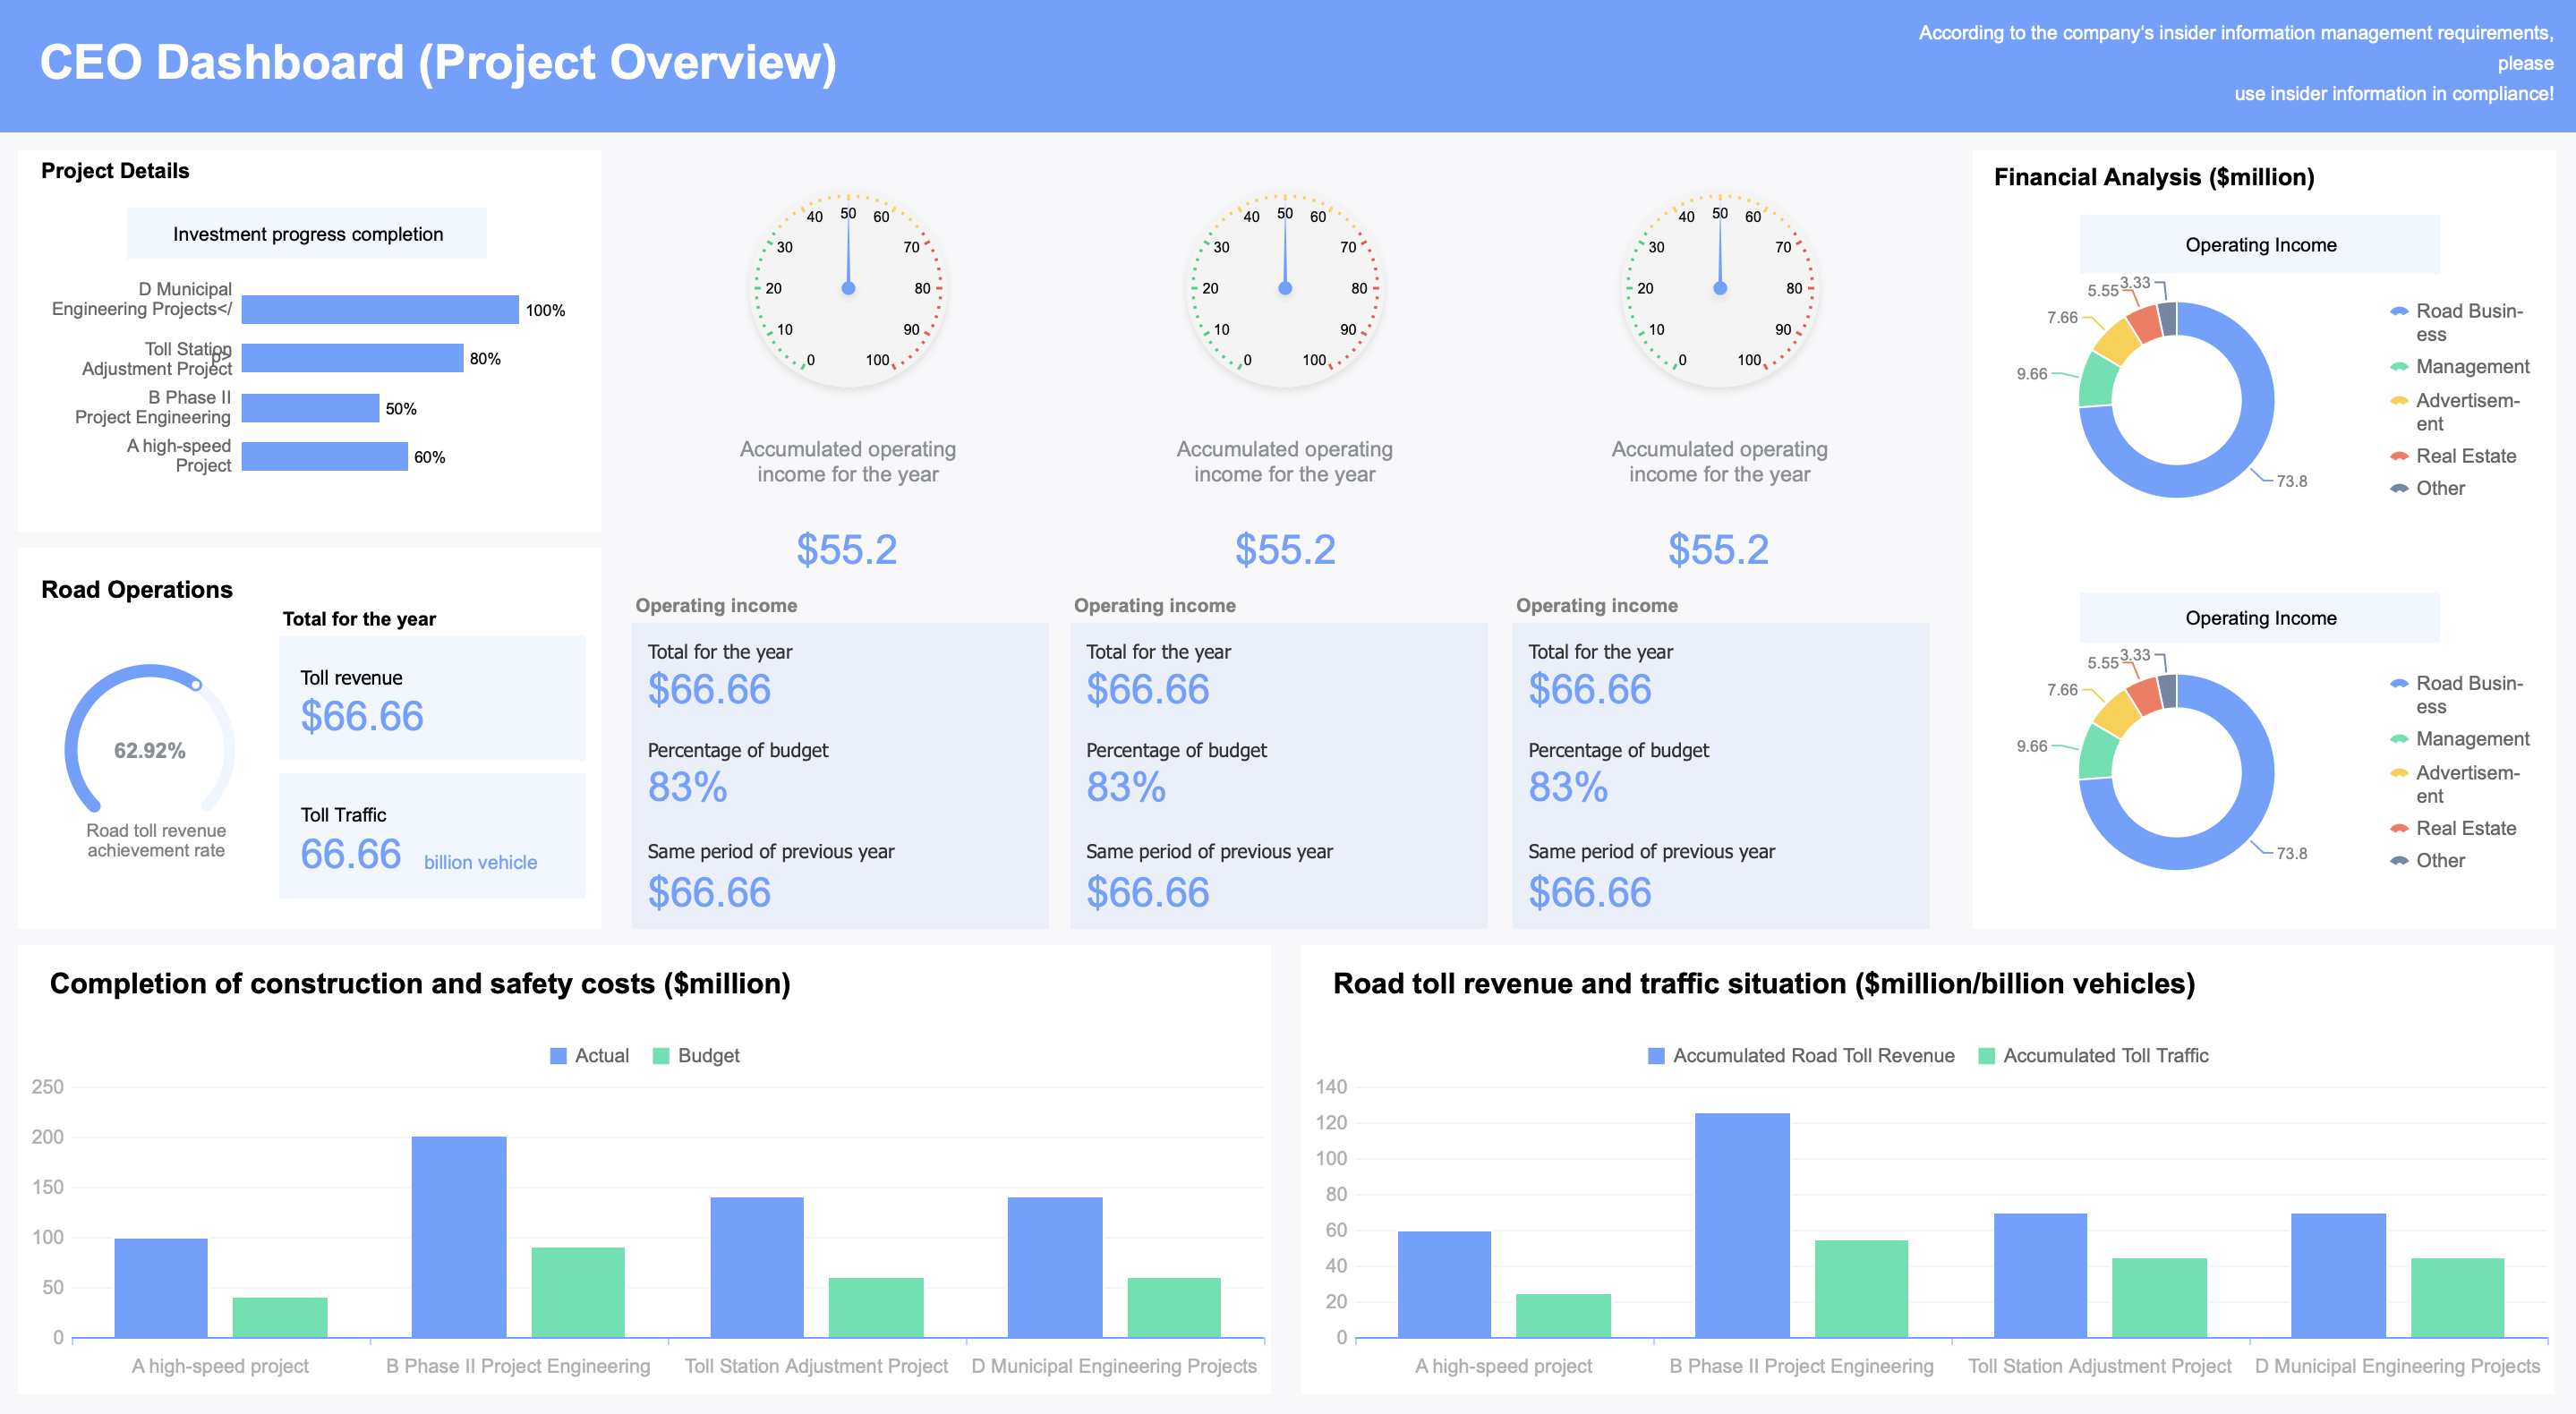
CEO Dashboard(Project Overview) Created By FineBI
Pros and benefits
FineBI shines when it comes to accessibility and collaboration. It’s designed for business users, so you don’t need coding skills to get started. The tool also supports team collaboration, allowing multiple users to work on the same dashboard and share insights effortlessly. With FineBI, you can identify trends, track KPIs, and make data-driven decisions faster than ever.
Compared to other data analytics tools, FineBI stands out for its enterprise-level data permission controls. You can assign access based on roles or departments, ensuring sensitive information stays secure. Whether you’re a small retailer or a large enterprise, FineBI adapts to your needs, making it one of the best data analysis software options for retail.
FineReport: Enterprise-Level Reporting for Retail
Key features
FineReport is your go-to tool for creating pixel-perfect reports and dashboards. It’s ideal for retailers who need detailed, professional-grade reports to support decision-making. With its drag-and-drop report designer, you can build complex reports in minutes. FineReport connects to multiple data sources, including databases and spreadsheets, and integrates seamlessly with FineBI for a unified analytics experience.
One of its standout features is automated task scheduling. You can set up daily, weekly, or monthly reports to be generated and distributed automatically. FineReport also excels in data visualization, offering over 70 chart styles and interactive features like drill-downs and linkages. Its mobile BI capabilities ensure you can access your reports anytime, anywhere.
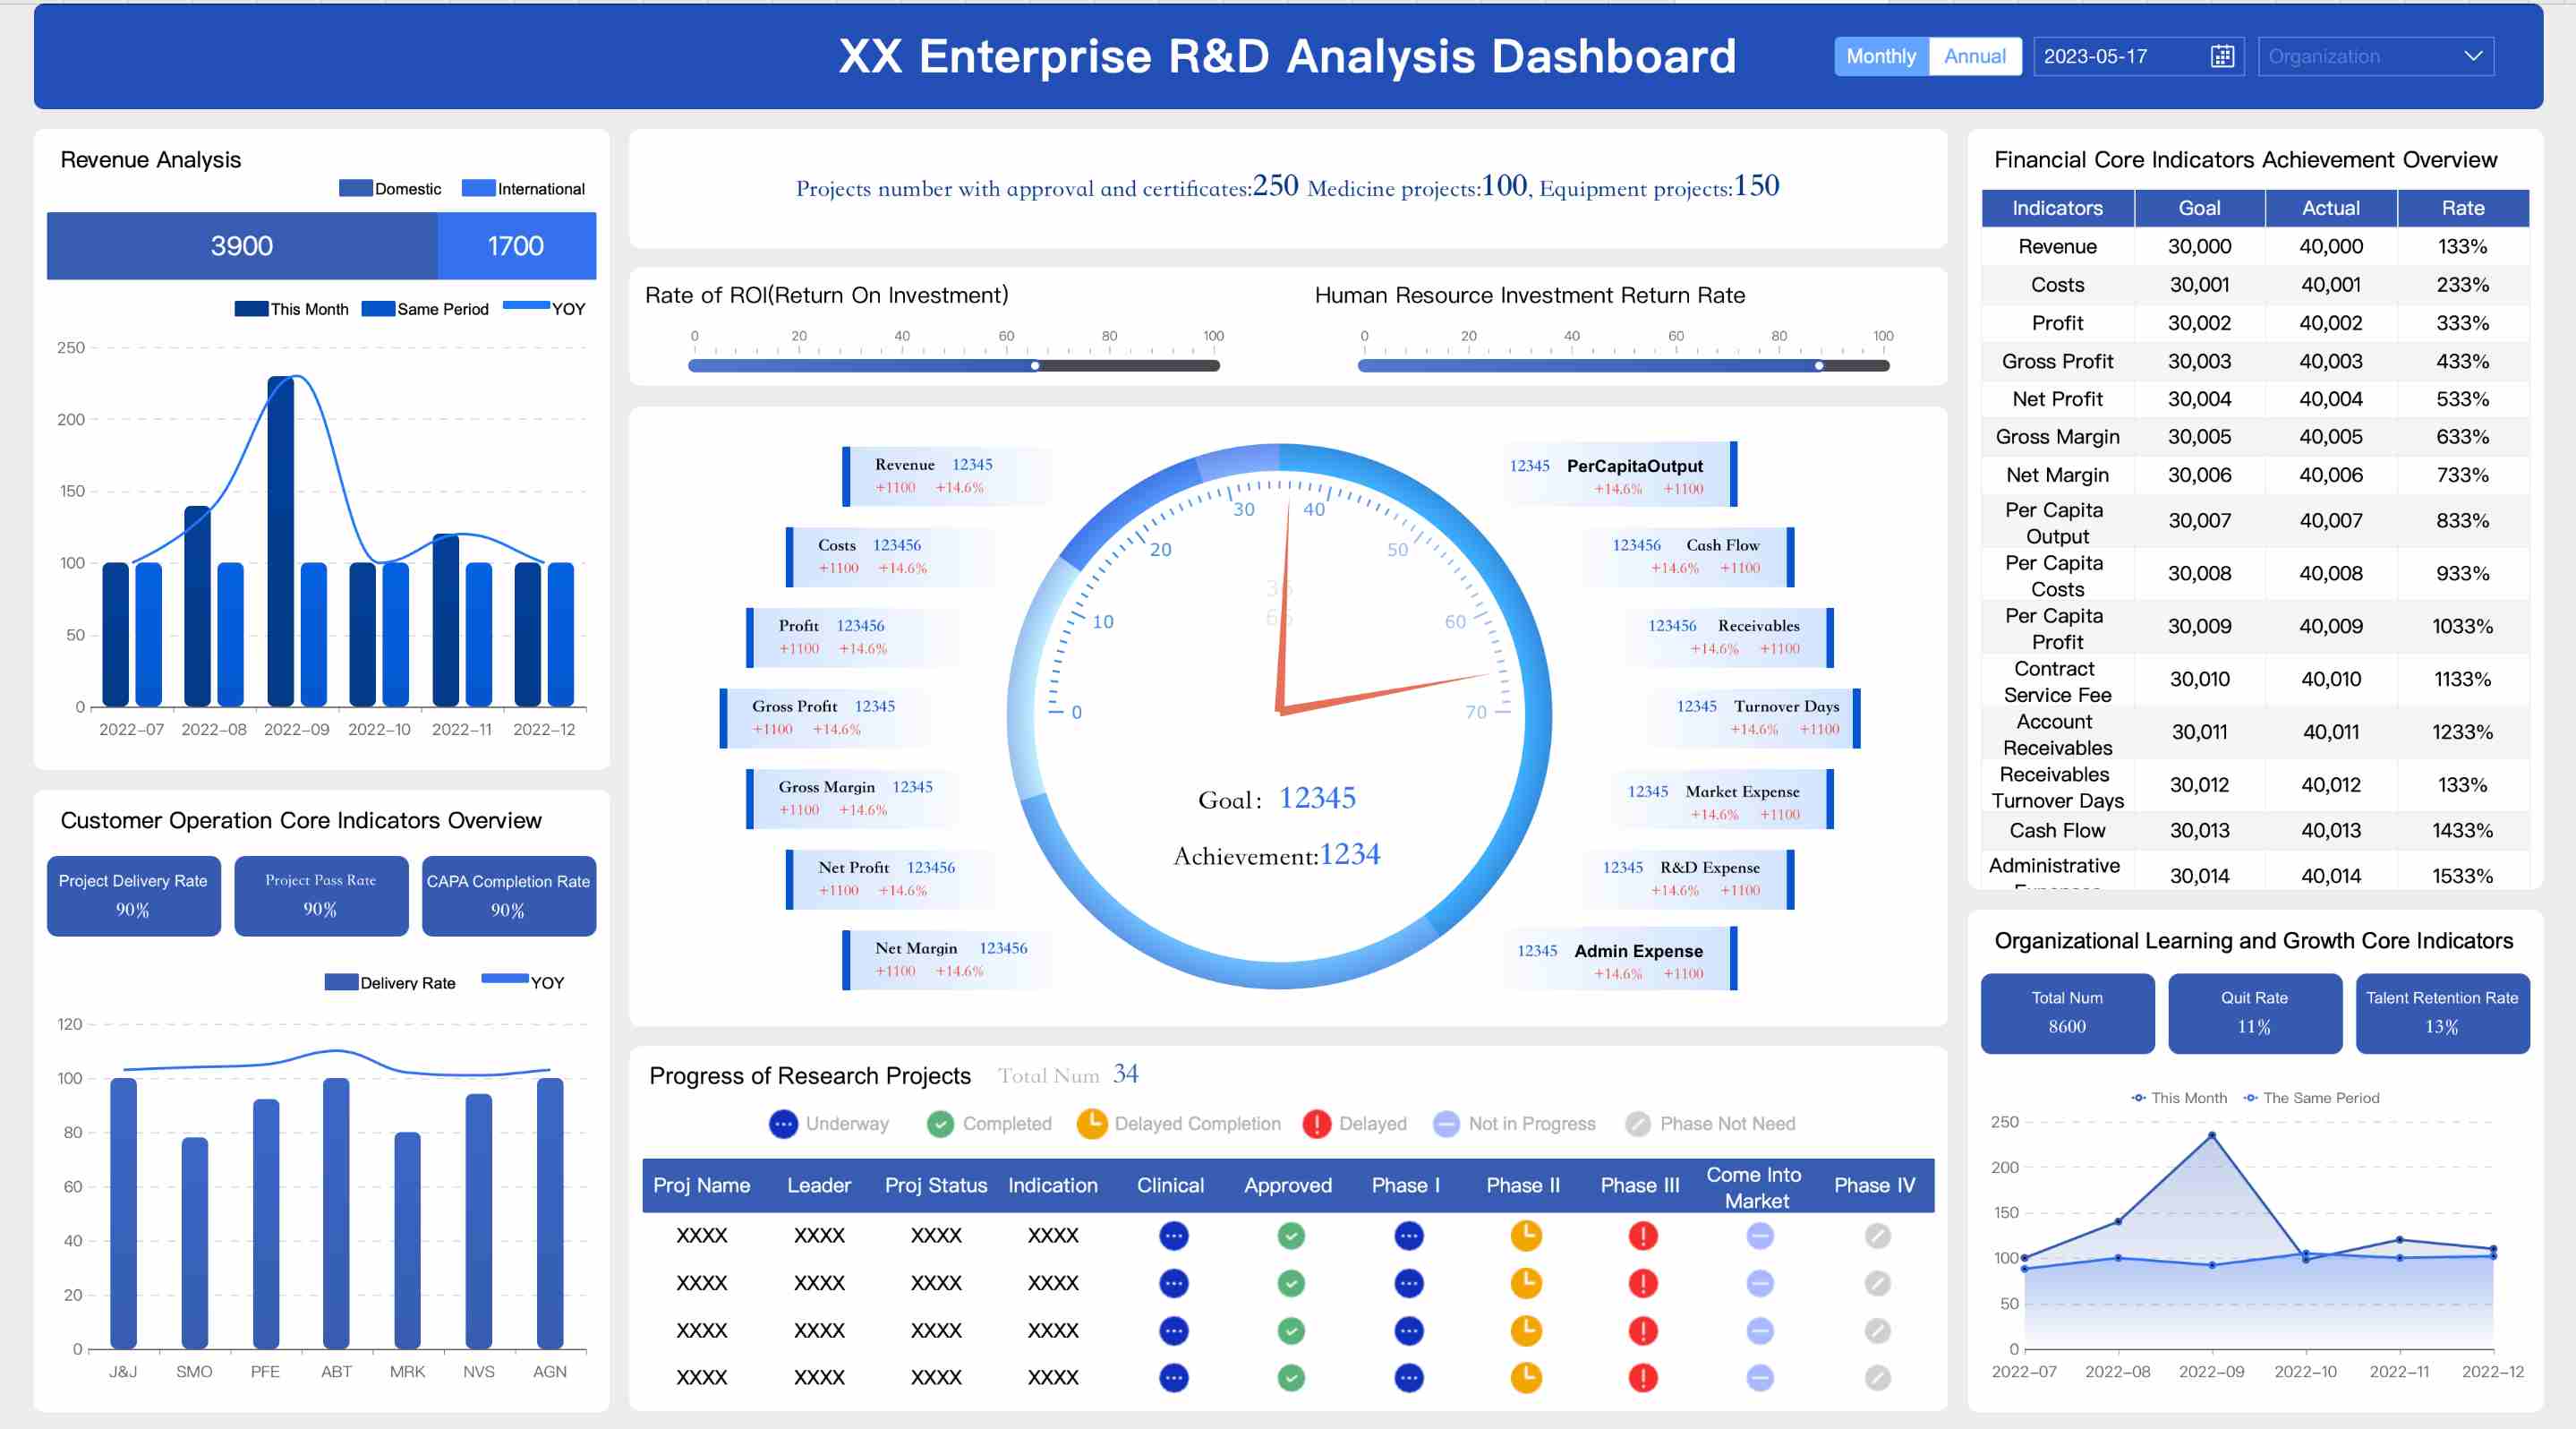
Enterprise R&D Analysis Dashboard Created By FineReport
Pros and benefits
FineReport simplifies the reporting process, saving you time and reducing errors. Its ability to handle large datasets makes it perfect for enterprise-level applications. Unlike other data analysis tools, FineReport focuses on delivering highly formatted, professional reports that meet complex business needs. It’s particularly useful for financial reporting, inventory management, and performance tracking.
What sets FineReport apart is its flexibility. Whether you need static reports or dynamic dashboards, FineReport has you covered. Its integration with FineBI creates a powerful ecosystem for data analysis and reporting, giving you a comprehensive view of your business operations.
Tableau: Advanced Visualization for Retail Data
Key features
Tableau is a powerhouse when it comes to data visualization tools. It connects to a wide range of data sources, including SQL databases, ensuring secure and reliable analysis. Tableau’s predictive modeling tools help you discover patterns and trends, making it easier to forecast sales or optimize inventory. It also includes built-in statistical functions for deeper insights into your data.
Tableau’s visualizations are its biggest strength. You can create interactive dashboards that allow you to explore data in real-time. Whether you’re analyzing customer purchase histories or monitoring inventory levels, Tableau makes it easy to understand complex data through stunning visuals.
Pros and benefits
Tableau excels in making data accessible and actionable. Its intuitive interface and advanced visualization capabilities make it a favorite among data analysts and business users alike. Retailers can use Tableau to assess marketing success, understand customer behavior, and optimize store layouts. The tool’s ability to handle large datasets and provide real-time insights ensures you’re always ahead of the curve.
However, compared to FineBI and FineReport, Tableau focuses more on visualization than on comprehensive reporting or self-service analytics. While it’s a fantastic tool for creating visualizations, it may require additional software for tasks like automated reporting or enterprise-level data management.
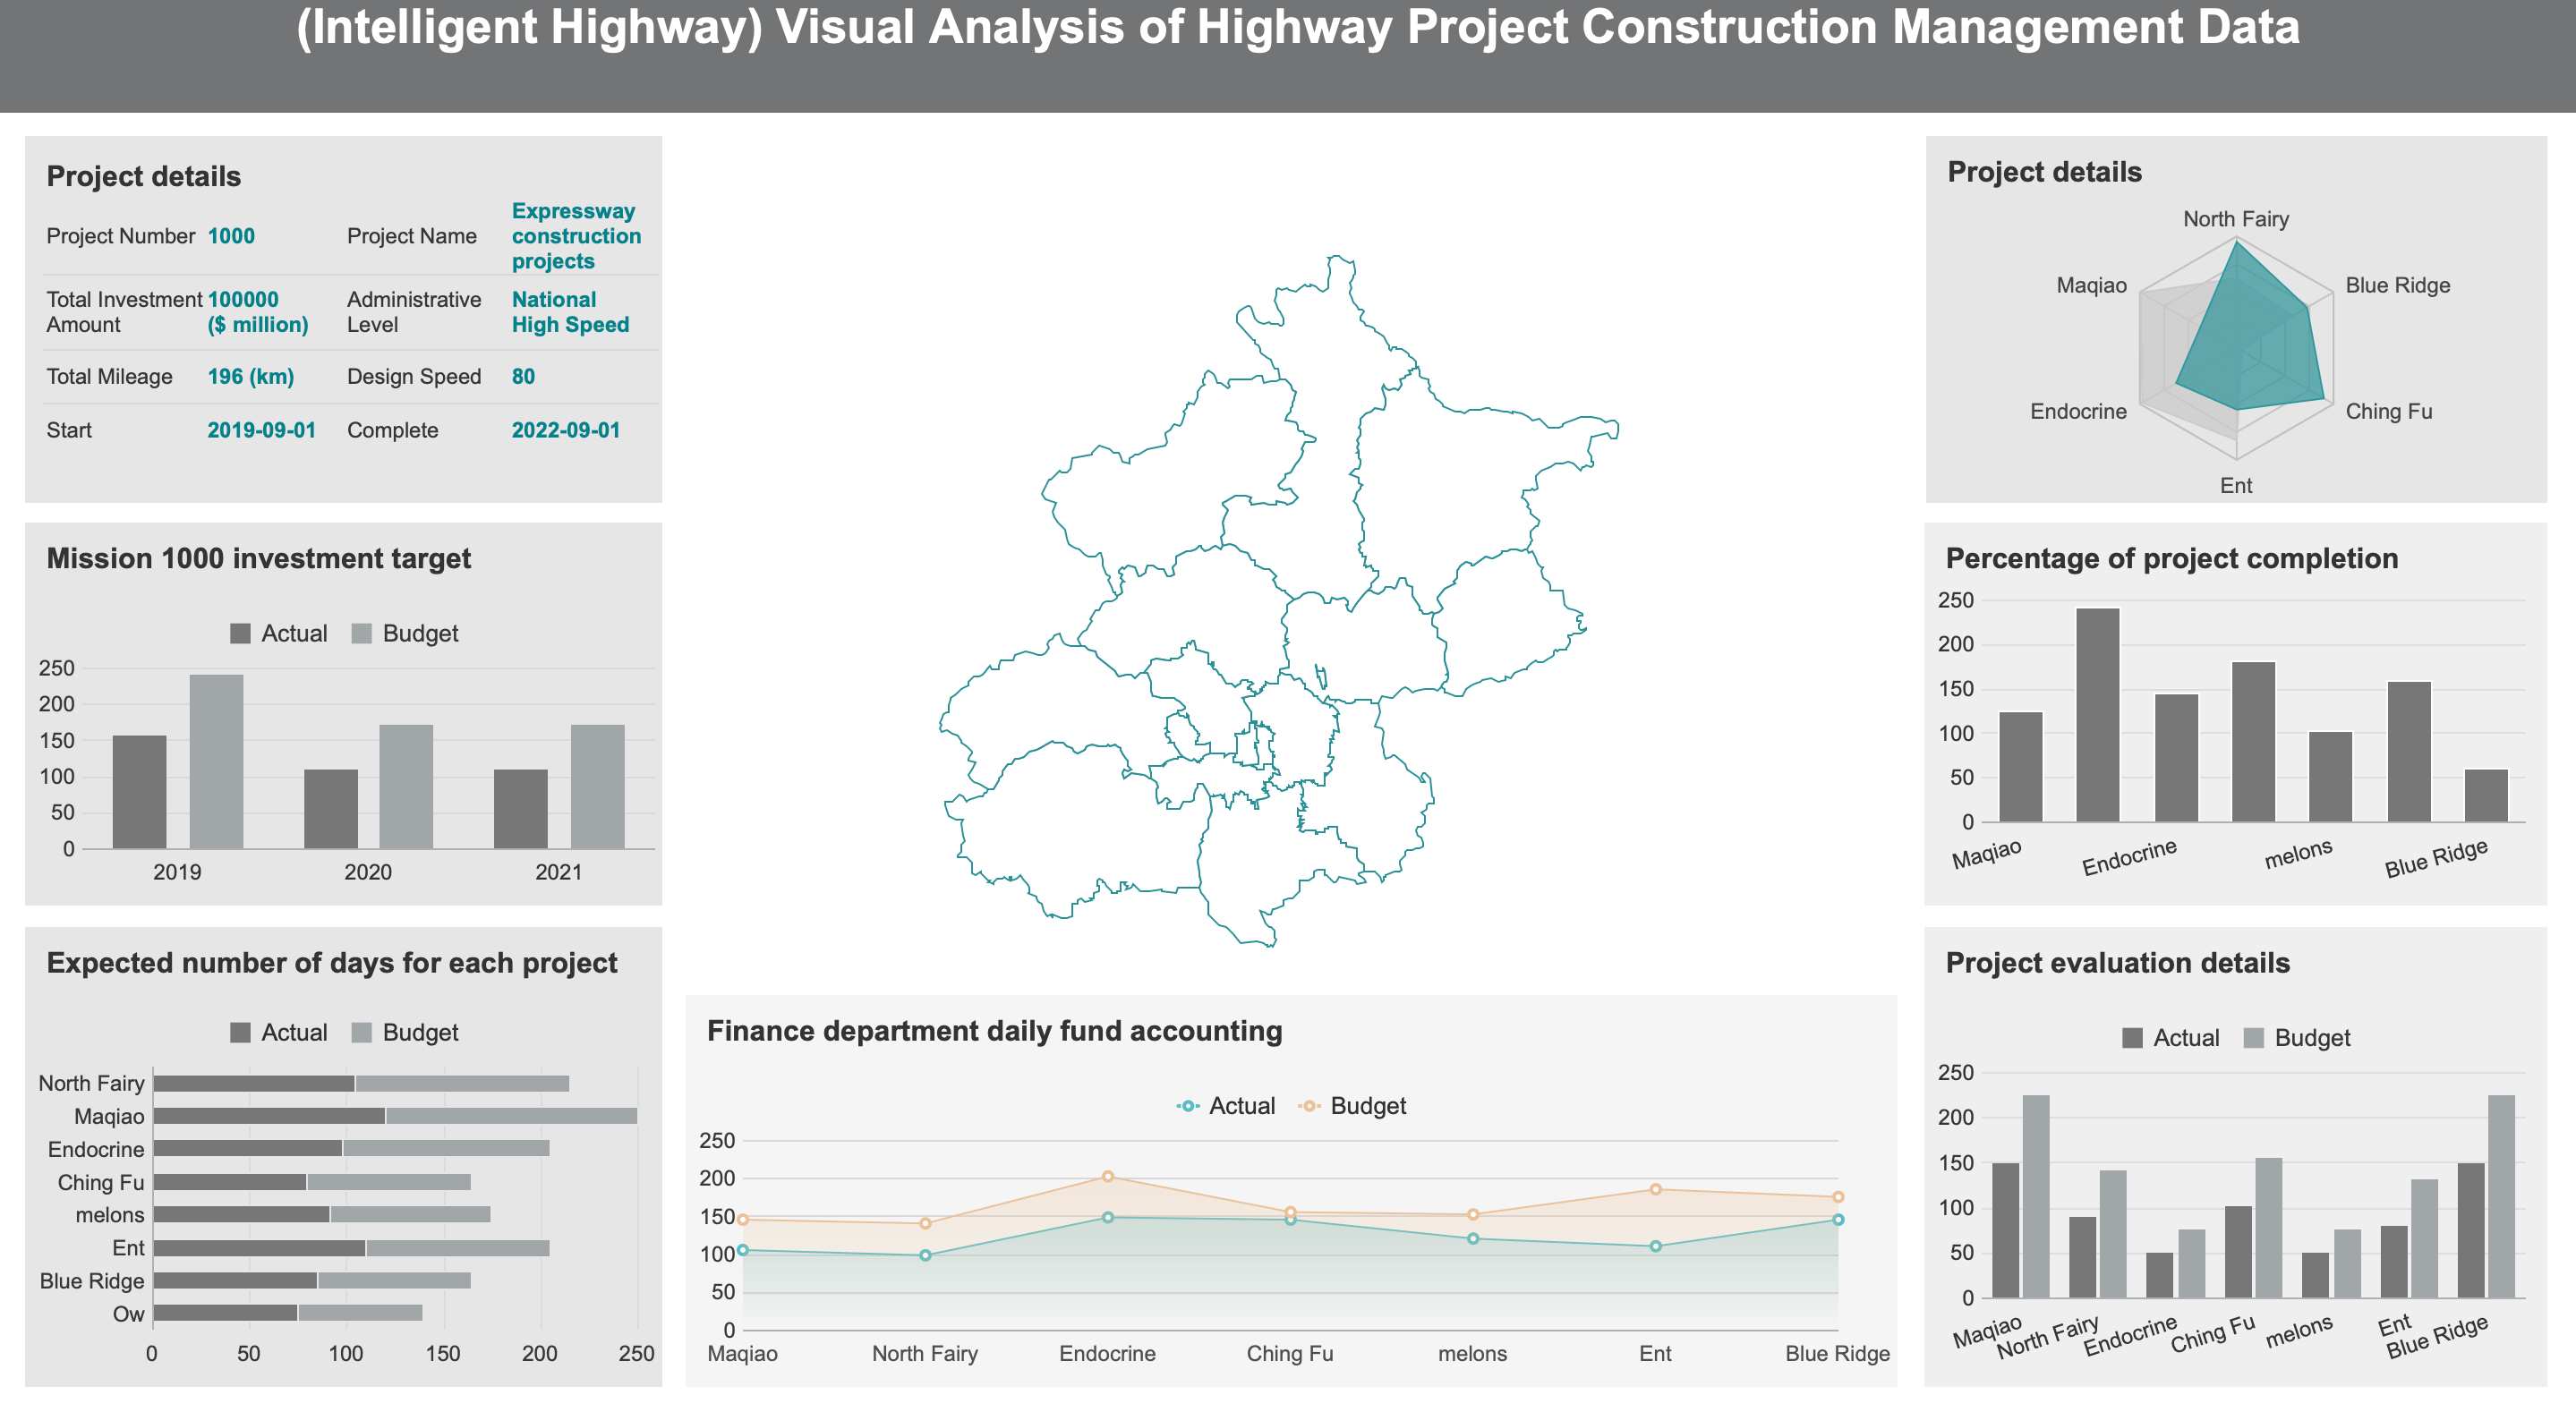
Highway Project Construction Management Dashboard Created By FineReport
Power BI: Comprehensive Analytics for Retailers
Key features
Power BI is a versatile tool that offers comprehensive analytics for retailers. It connects to a wide range of data sources, including point-of-sale systems, customer databases, and supply chain platforms. This connectivity ensures you can analyze all your data in one place. Power BI excels in handling large datasets, making it ideal for retailers managing multiple stores or e-commerce platforms.
One of its standout features is its ability to provide detailed insights across various retail metrics. For example, you can track gross margins, revenue, and inventory turns. Power BI also supports advanced visualizations, allowing you to create interactive dashboards that highlight key performance indicators. Its predictive analytics capabilities help you forecast sales trends, optimize pricing strategies, and identify profitable products.
Here’s a quick look at the metrics Power BI can analyze:
Success of promotions, Total cost, ROI, Pricing offers
Customer-Centric Data
Demographics, Frequency, Loyalty
Supply Chain and Operations
Demand for products, Profitable products, Units sold tracking
Merchandising Data
Insights into product performance and inventory management
Pros and benefits
Power BI stands out for its user-friendly interface and powerful analytics capabilities. It allows you to create custom dashboards and reports without needing advanced technical skills. This makes it accessible to both data analysts and business users. Its real-time data processing ensures you can make timely decisions, whether you’re adjusting inventory levels or launching a new marketing campaign.
Compared to FineBI, Power BI focuses heavily on data visualization and predictive analytics. However, FineBI offers a more collaborative environment with features like team dashboards and enterprise-level data permission controls. If you’re looking for a tool that combines self-service analytics with robust collaboration, FineBI might be a better fit for your needs.
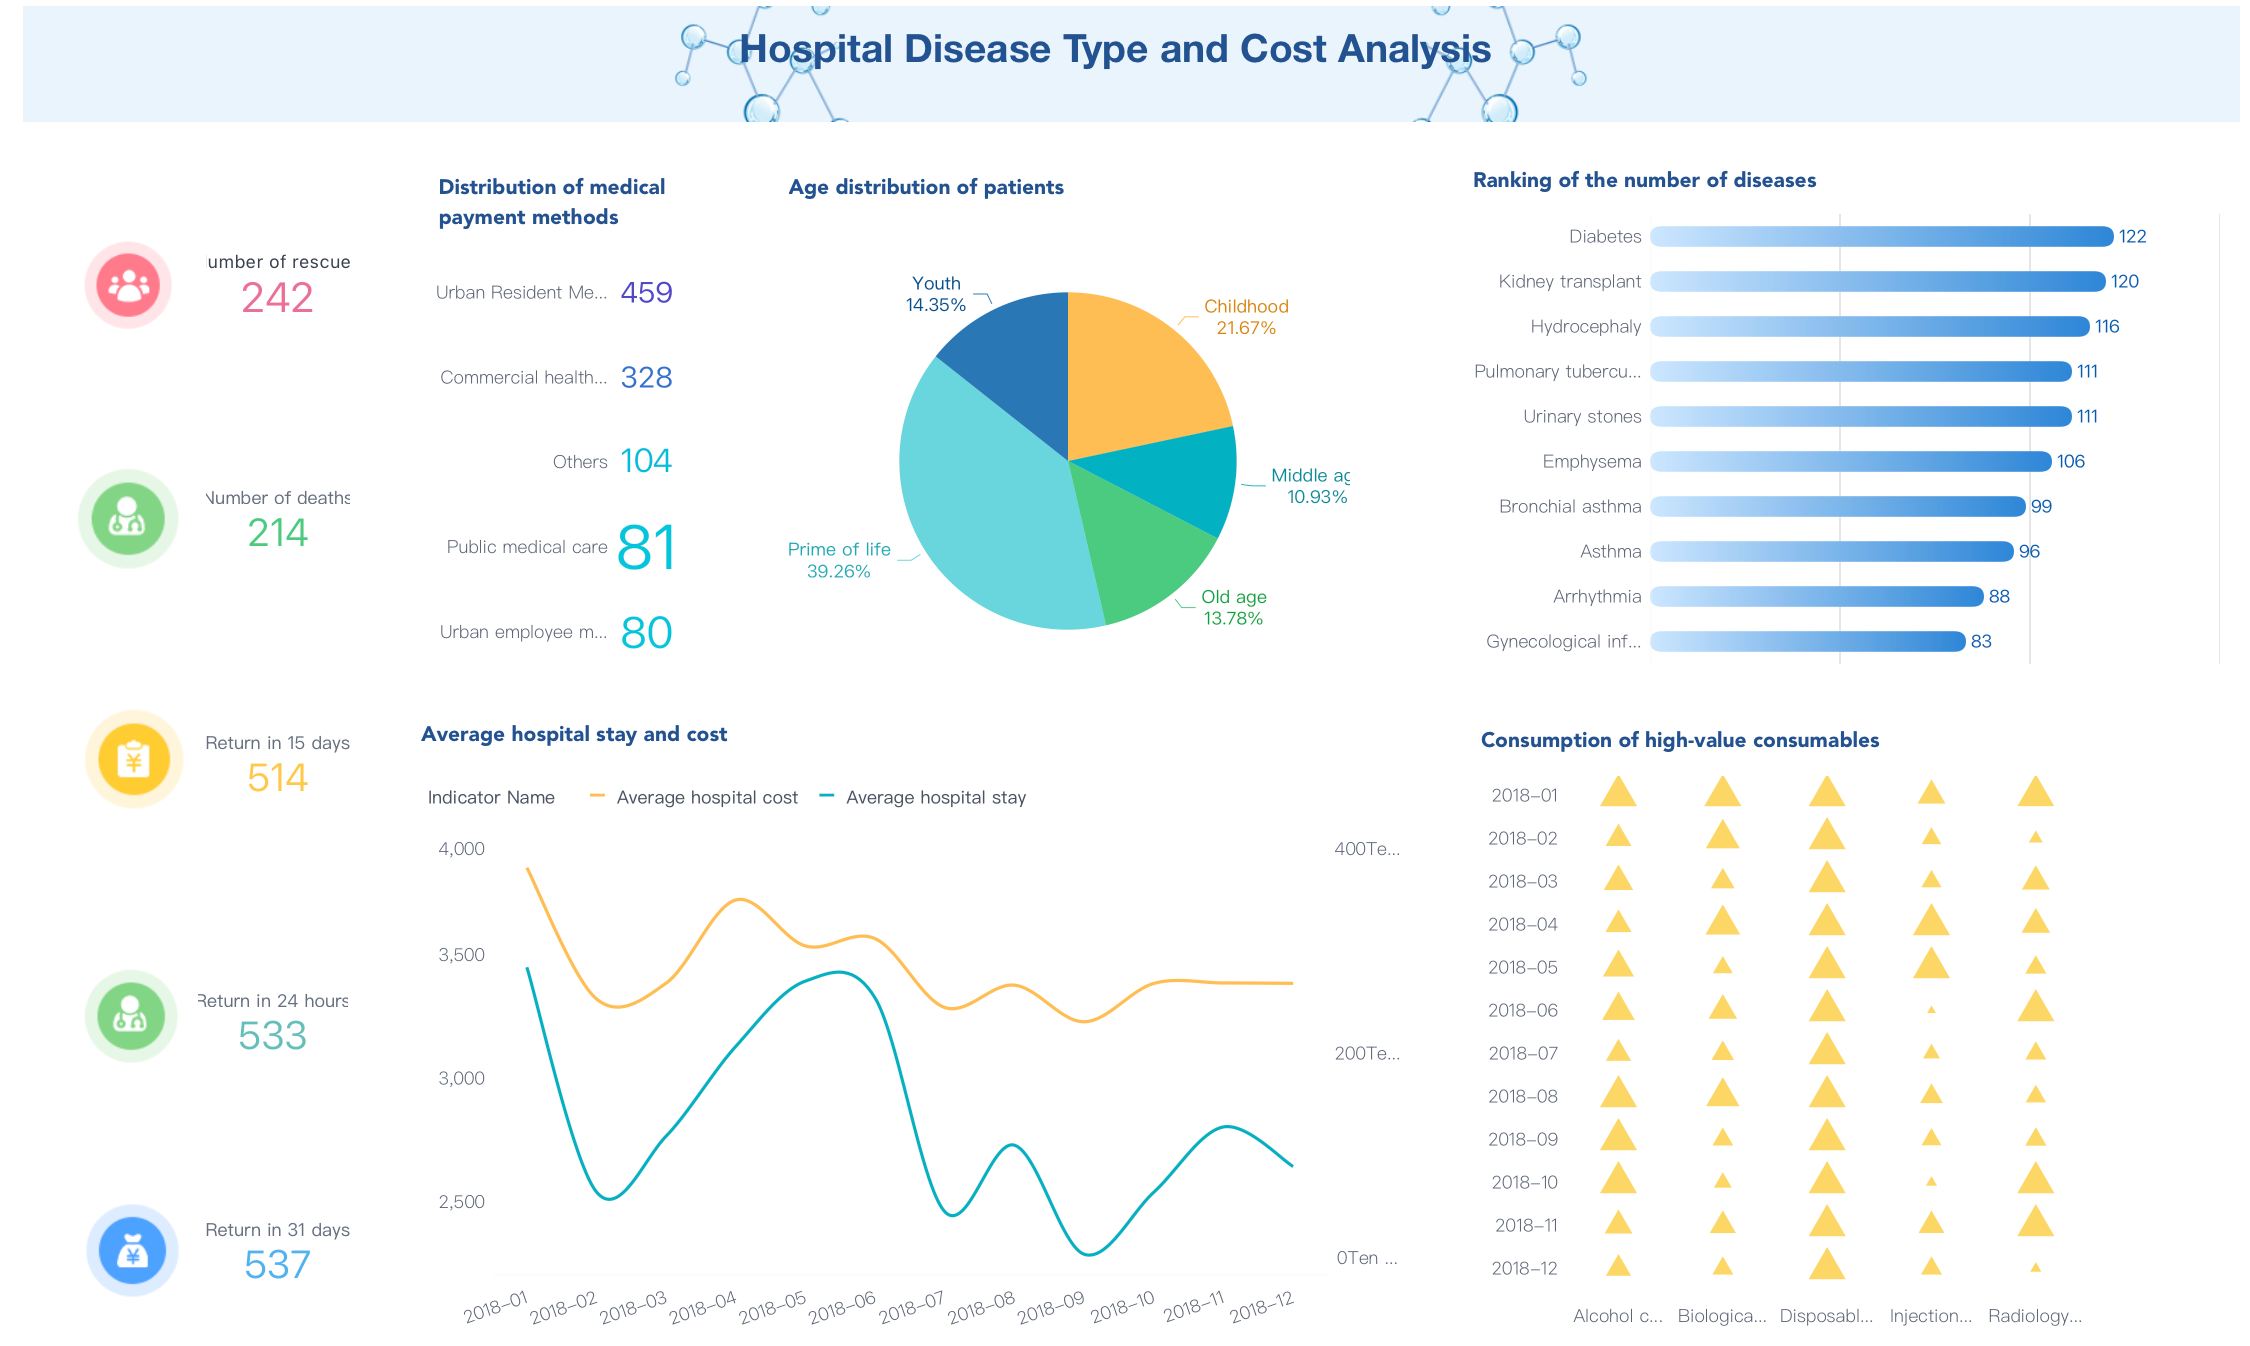
Hospital Disease Type and Cost Analysis Dashboard Created By FineBI
Google Analytics 4: Customer Interaction Insights
Key features
Google Analytics 4 (GA4) is a must-have tool for understanding customer interactions. It tracks visitors across devices, giving you a complete view of their journey. GA4 enhances event measurement, allowing you to monitor actions like scrolls, searches, and clicks. This makes it easier to understand how customers engage with your website or app.
GA4 also supports advanced audience segmentation. You can group customers based on demographics, shopping behavior, or purchase history. Its machine learning capabilities predict purchase probabilities and customer churn, helping you tailor your marketing strategies. Additionally, GA4 provides insights into engagement rates and cart conversion rates, which are crucial for improving the shopping experience.
Pros and benefits
GA4 excels in providing actionable insights into customer behavior. It helps you identify patterns that can improve cart conversion rates and enhance customer engagement. Retailers can use GA4 to create targeted promotions, boosting sales and loyalty. Its ability to track customer interactions across devices ensures you have a holistic view of your audience.
While GA4 is excellent for marketing analytics, it lacks the robust reporting and self-service analytics features of FineBI and FineReport. For example, FineReport’s automated task scheduling and pixel-perfect reports make it a better choice for businesses needing detailed operational insights. Similarly, FineBI’s real-time dashboards and OLAP capabilities offer more flexibility for in-depth data analysis.
Honorable Mentions
KNIME Analytics Platform
KNIME is a powerful open-source tool for data analysis and machine learning. It supports a wide range of data sources and offers advanced analytics features. KNIME is particularly useful for retailers looking to perform complex analyses, such as customer segmentation or sales forecasting.
KPI
Description
Inventory Turns
Measures how often inventory is sold and replaced
Sell-Through Rate
Indicates the percentage of inventory sold over a specific period
Customer-Centric Data
Focuses on metrics that reflect customer behavior and preferences
Zoho Analytics
Zoho Analytics is another excellent option for retailers. It offers a user-friendly interface and supports a variety of data visualization tools. Zoho Analytics is ideal for small to medium-sized businesses looking for an affordable yet powerful data analysis software. It provides insights into sales trends, customer behavior, and inventory performance.
While KNIME and Zoho Analytics are strong contenders, FineBI and FineReport offer unique advantages. FineBI’s self-service analytics and collaborative features make it ideal for team-based decision-making. FineReport’s ability to create highly formatted reports and automate tasks ensures you can focus on strategy rather than manual processes.
Key Features to Look for in Retail Data Analysis Tools
Scalability and Flexibility
When choosing data analysis tools, scalability and flexibility should be at the top of your checklist. As your retail business grows, so does your data. You need a tool that can handle increasing data volumes and complexity without slowing down. Imagine starting with a small store and expanding to multiple locations—your software should grow with you.
Feature
Description
Scalability
Ensures the tool can handle growing data volumes and increasing complexity as your business expands.
Adaptability
Allows you to adjust to changing market demands with ease.
Performance
Supports more data sources, users, and analytical capabilities without sacrificing speed.
FineBI excels in scalability. Its high-performance computing engine processes massive datasets effortlessly, supporting over 10,000 users simultaneously. This makes it perfect for large retailers managing multiple stores or e-commerce platforms. FineReport, on the other hand, shines in flexibility. Its drag-and-drop designer lets you create complex, pixel-perfect reports tailored to your unique needs. Together, they offer a robust solution for businesses of all sizes.
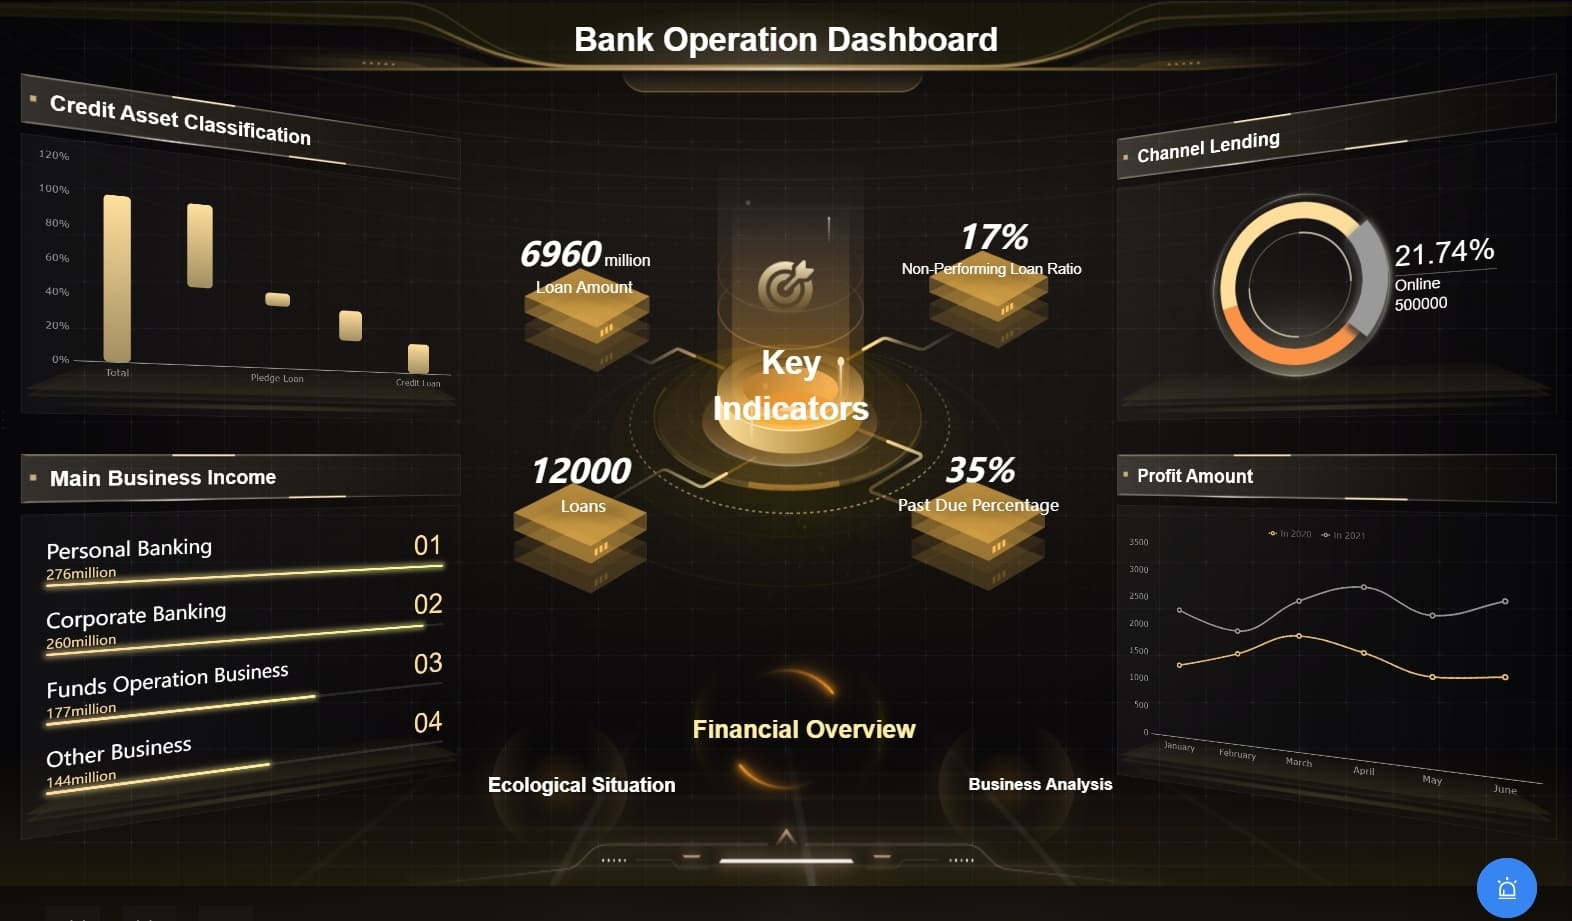
Bank Operation Dashboard Created By FineReport
Integration Capabilities
Integration is another must-have feature. Your data comes from everywhere—point-of-sale systems, customer databases, and even social media. A good tool should bring all this data together seamlessly, giving you a complete picture of your business.
Retail software offers varied data integration services tailored to unique business needs.
Companies can choose between individual applications or an all-in-one platform for analytics and integration.
Lexer combines data collection, CDP, analytics tools, and dashboards into a single system.
FineBI and FineReport stand out here. FineBI connects to over 100 data sources, including big data platforms like Hadoop and relational databases like MySQL. It also supports real-time data synchronization, ensuring your dashboards always reflect the latest trends. FineReport complements this by integrating with FineBI, creating a unified ecosystem for reporting and analysis. This combination eliminates data silos, making your analytics more effective.
User-Friendly Interface
Let’s face it—nobody wants to spend hours learning how to use new software. A user-friendly interface can make or break your experience with data analysis tools. Look for features like drag-and-drop functionality, real-time data connections, and cross-platform compatibility.
Feature
Benefit
Drag-and-drop feature
Aids quick visualization creation
Real-time Data
Connects to live data sources for immediate insights
Cross-platform Connectivity
Works with cloud services like Google BigQuery
FineBI is designed with business users in mind. Its intuitive interface allows you to create dashboards and visualizations without any coding skills. FineReport takes it a step further with its Excel-like interface, making it easy for anyone to design professional-grade reports. Both tools prioritize ease of use, ensuring you spend less time learning and more time analyzing.
Choosing the right data analysis software can transform your retail operations. FineBI and FineReport offer the perfect blend of scalability, integration, and user-friendliness, making them the best data analysis software options for retailers in 2026.
Advanced Analytics and AI
Advanced analytics and AI are transforming how you approach retail data analysis. These technologies dig deeper into your data, uncovering patterns and trends that might otherwise go unnoticed. They don’t just tell you what happened—they predict what’s coming next. Imagine knowing which products will sell out next week or which customers are likely to churn. That’s the power of advanced analytics.
FineBI and FineReport excel in this area. FineBI’s augmented analytics feature uses AI to interpret your data automatically. It highlights anomalies, identifies key factors, and even suggests insights you might have missed. This means you can focus on making decisions instead of crunching numbers. FineReport complements this with its ability to handle complex data sets and generate detailed reports. Together, they create a seamless ecosystem for advanced data analysis.
Other tools like Tableau and Power BI also offer predictive analytics, but FineBI stands out with its user-friendly interface and collaborative features. For example, FineBI allows teams to share dashboards and insights effortlessly, fostering better decision-making across departments. FineReport, on the other hand, shines in its ability to create pixel-perfect reports that integrate AI-driven insights. This makes it ideal for businesses that need both precision and intelligence in their reporting.
AI isn’t just about predictions. It’s about making your life easier. FineBI’s real-time dashboards, powered by advanced analytics, let you monitor sales, inventory, and customer behavior as they happen. FineReport’s automated scheduling ensures you get the right reports at the right time, without lifting a finger. These features save you time and help you stay ahead in a competitive market.
When choosing data analysis software, look for tools that combine advanced analytics with ease of use. FineBI and FineReport deliver on both fronts, making them the perfect choice for retailers aiming to leverage AI effectively.
Cost-Effectiveness
Cost-effectiveness is a big deal when selecting data analysis tools. You want something that delivers value without breaking the bank. FineBI and FineReport strike the perfect balance between affordability and functionality. They offer enterprise-level features at a fraction of the cost of some competitors.
FineBI’s self-service analytics reduce your reliance on IT teams, saving you both time and money. Its intuitive interface means you don’t need to hire expensive data scientists to make sense of your data. FineReport’s automated reporting features cut down on manual work, freeing up your team to focus on strategy. These efficiencies translate directly into cost savings.
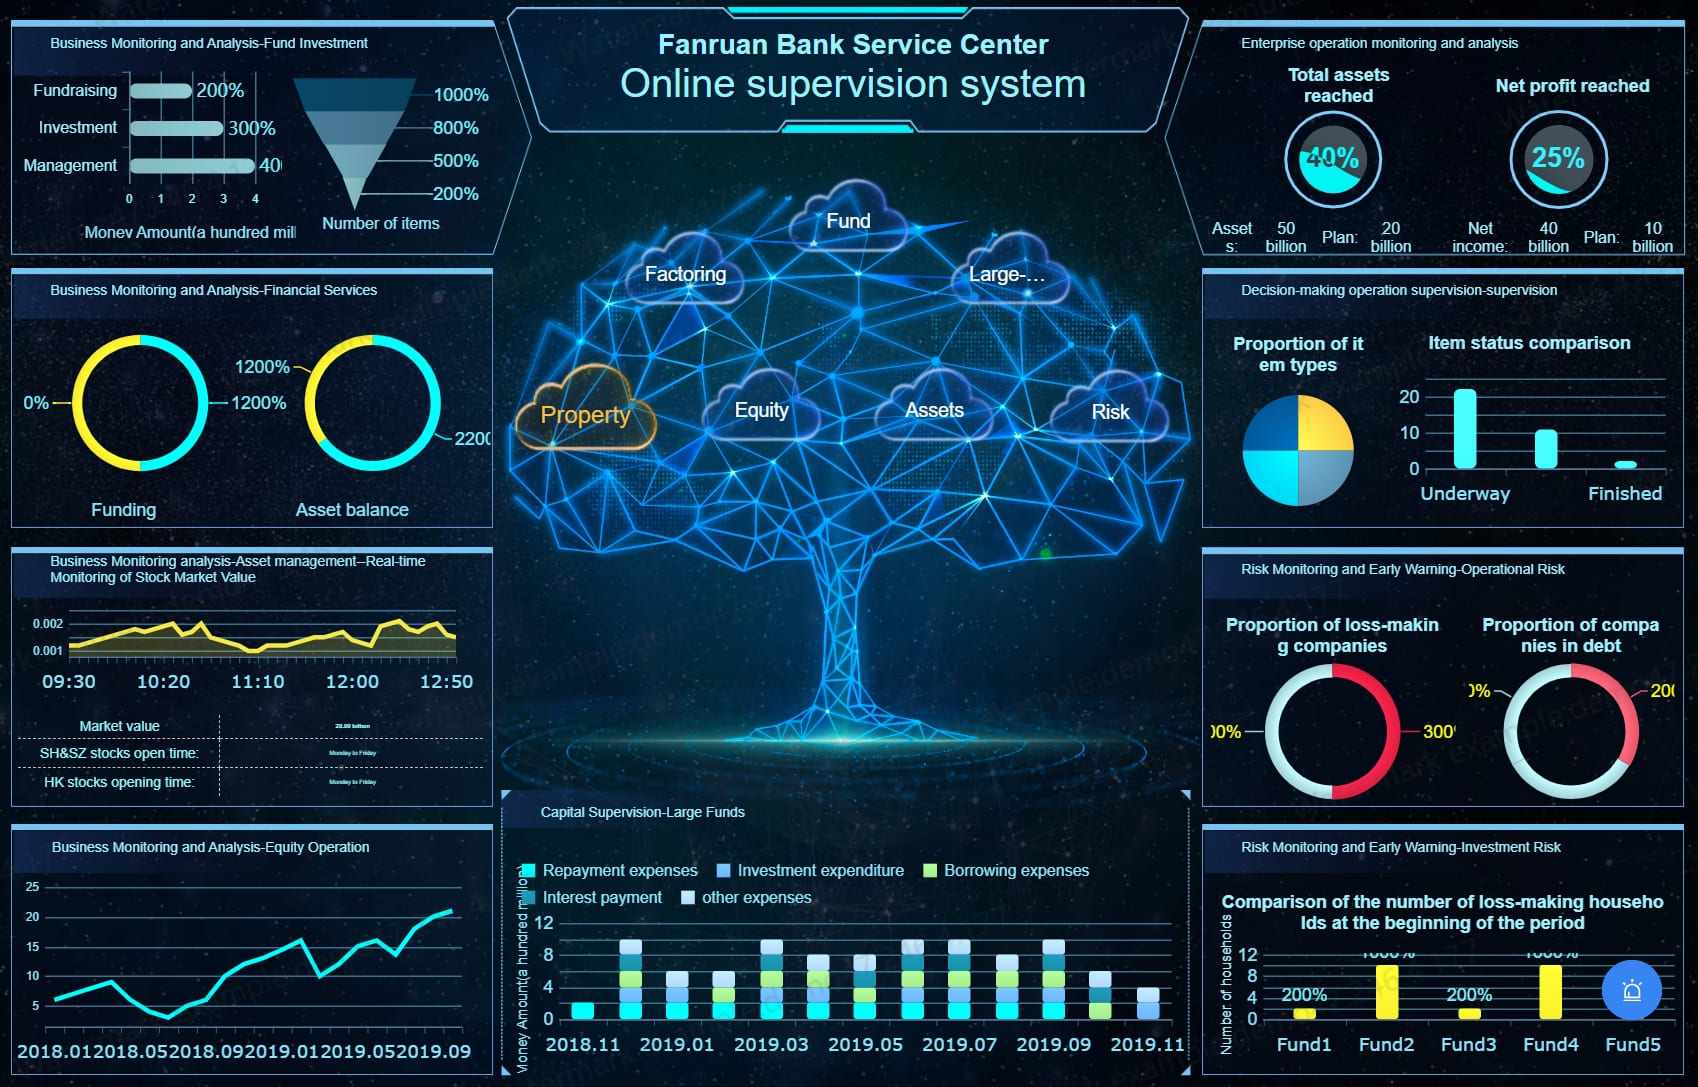
Bank Service Center Online Supervision System Dashboard Created By FineReport
Let’s compare. Tableau and Power BI are excellent tools, but they often come with higher licensing fees and additional costs for advanced features. FineBI and FineReport, on the other hand, offer flexible pricing models that cater to businesses of all sizes. Whether you’re a small retailer or a large enterprise, you’ll find a plan that fits your budget.
Another factor to consider is scalability. FineBI’s high-performance computing engine handles massive datasets effortlessly, ensuring you won’t outgrow the software as your business expands. FineReport’s flexibility allows you to create reports and dashboards tailored to your specific needs, eliminating the need for additional tools. This scalability ensures long-term cost-effectiveness.
Investing in the right data analysis software isn’t just about saving money—it’s about maximizing value. FineBI and FineReport give you the tools to make smarter decisions, improve efficiency, and drive growth. That’s cost-effectiveness at its best.
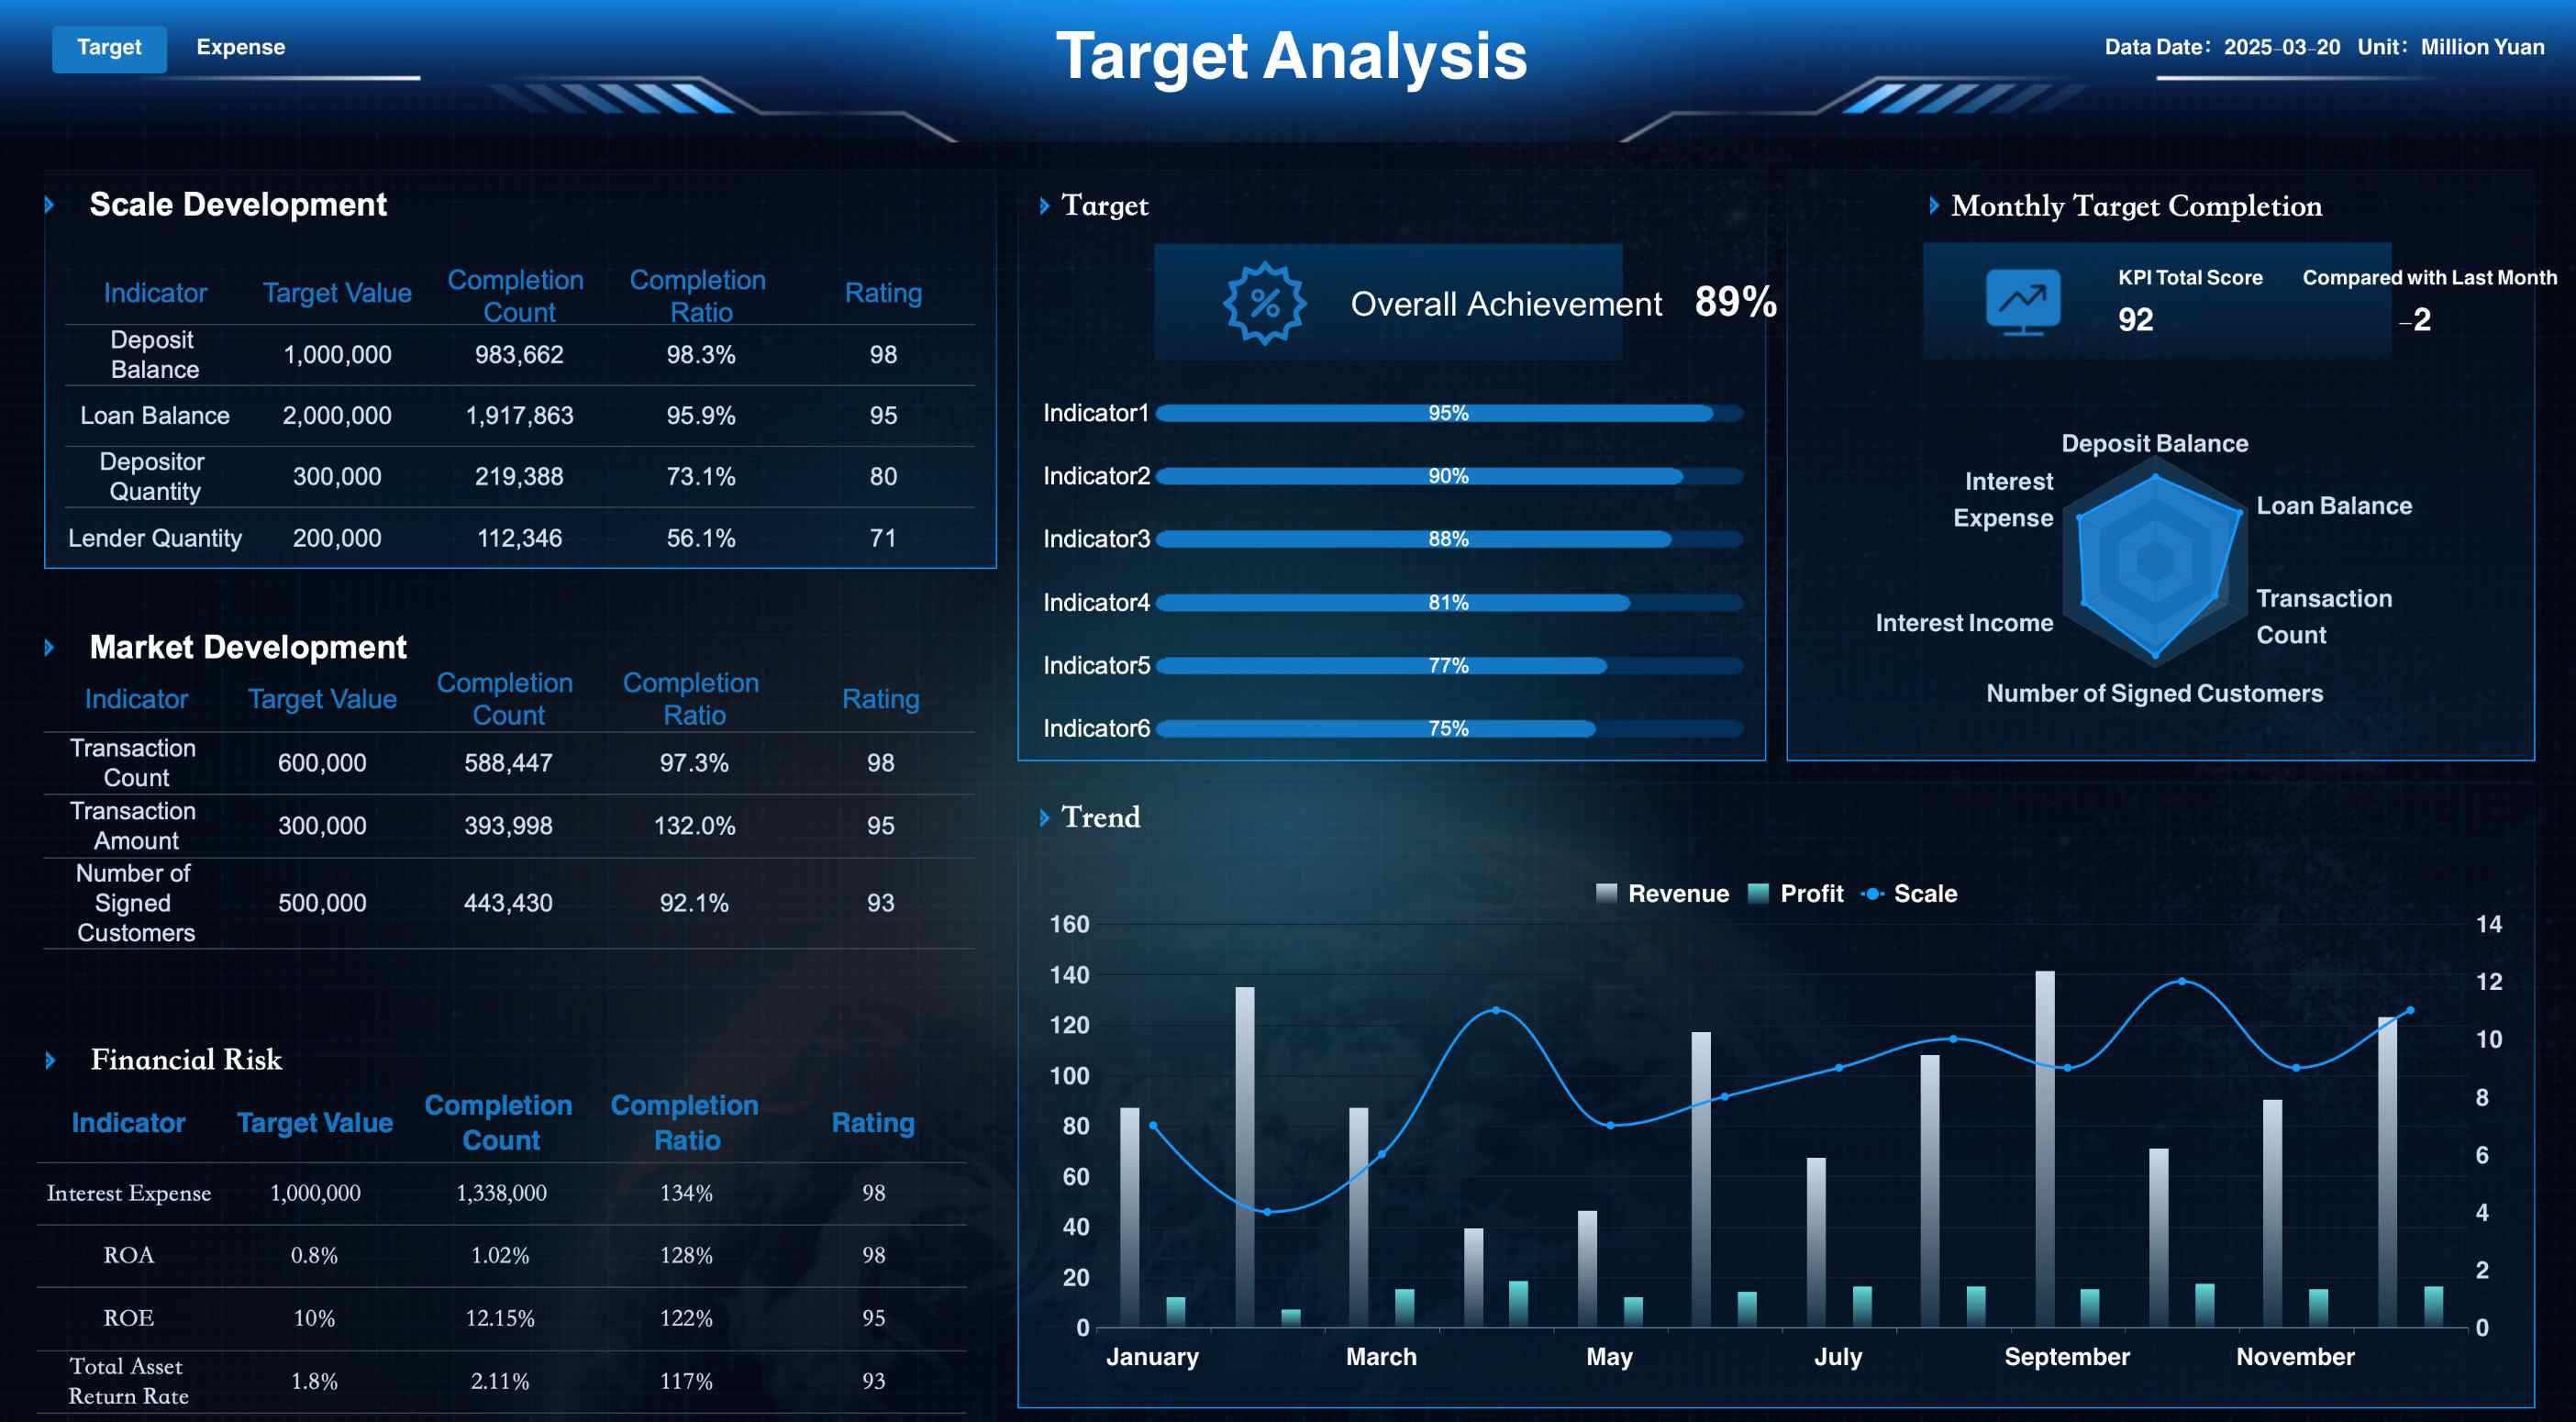
Target Analysis Dashboard Created By FineReport
How to Choose the Right Retail Data Analysis Tool for Your Business
Assessing Your Business Needs
Choosing the right data analysis tool starts with understanding your business needs. What challenges are you trying to solve? Are you looking to improve inventory management, enhance customer insights, or optimize sales forecasting? Identifying your goals will help you narrow down your options.
Different types of analytics serve different purposes. Here’s a quick breakdown:
Type of Analytics
Description
Applications
Diagnostic Analytics
Identifies the underlying cause of a problem
Helps in understanding issues affecting sales or customer satisfaction.
Predictive Analytics
Projects future outcomes based on historical data
Assists in forecasting sales trends and inventory needs.
Prescriptive Analytics
Suggests course corrections based on data analysis
Guides decision-making for marketing strategies and product placements.
Descriptive Analytics
Reflects and explains historical performance
Provides insights into past sales data and customer behavior patterns.
For example, FineBI excels in predictive and prescriptive analytics. Its real-time dashboards and OLAP capabilities allow you to forecast trends and make data-driven decisions. FineReport, on the other hand, shines in descriptive analytics, offering pixel-perfect reports that provide a clear picture of your historical performance. Together, they create a powerful ecosystem for comprehensive analysis.
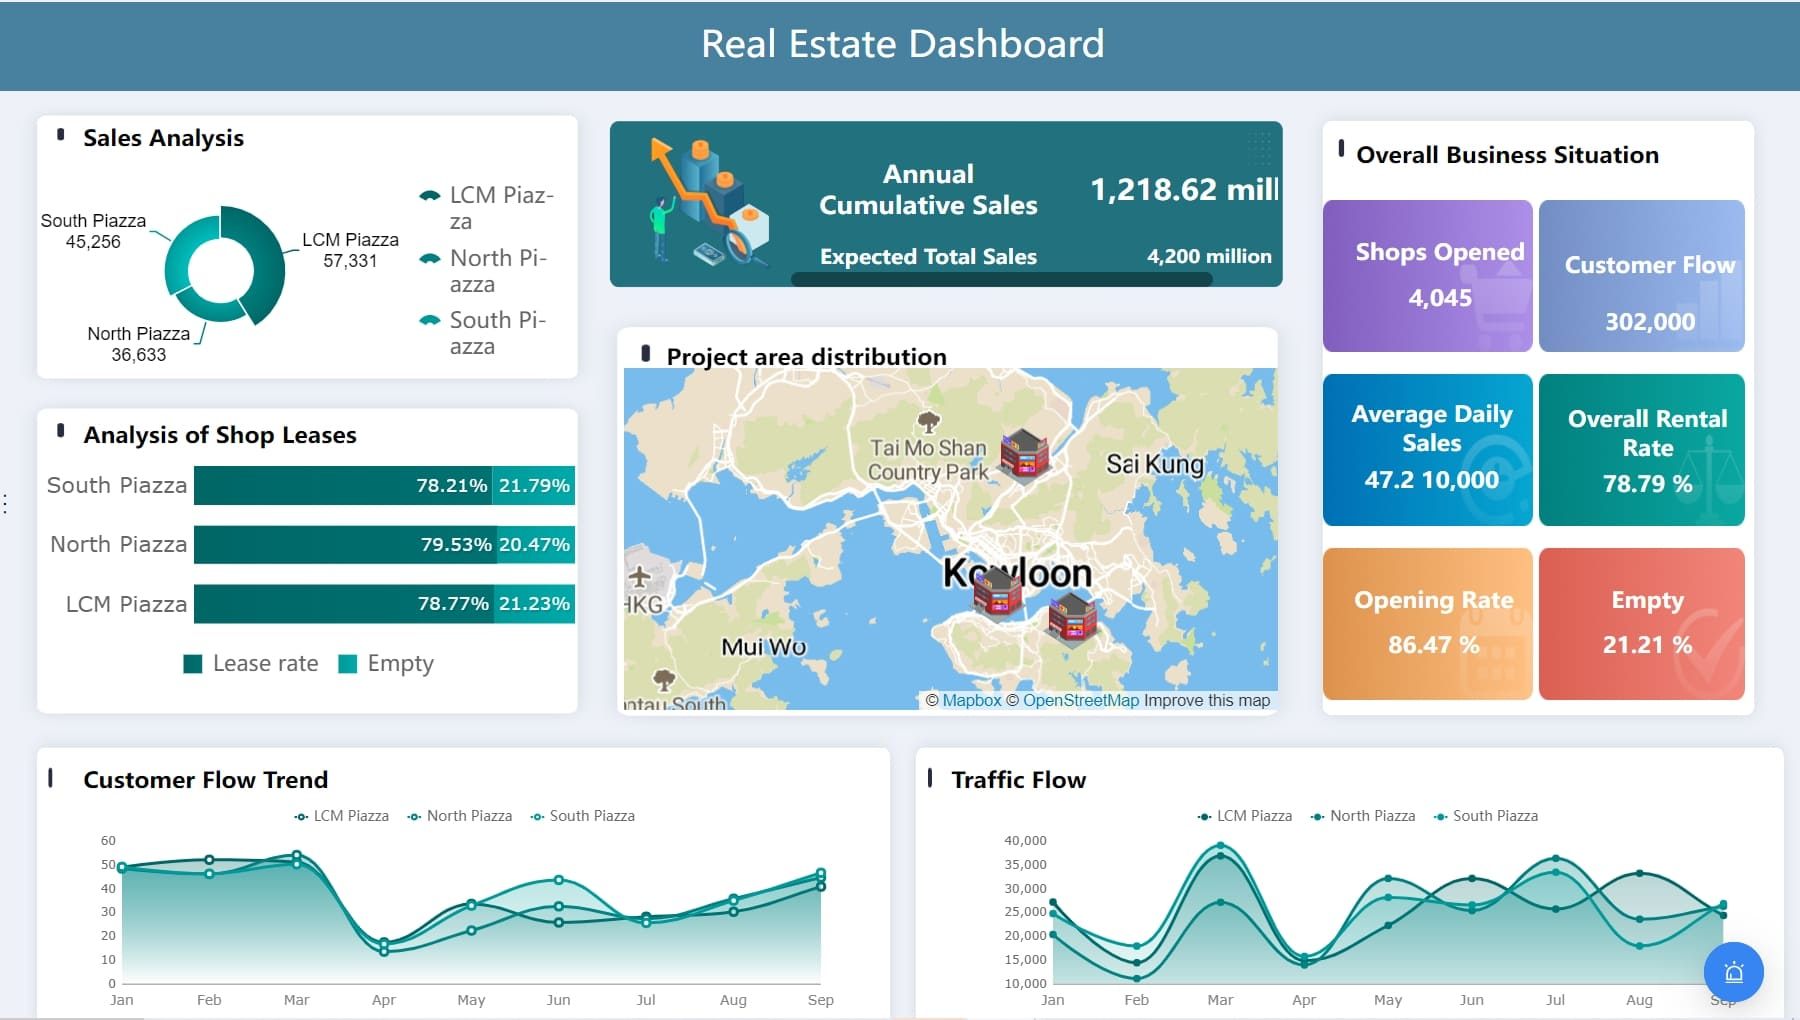
Real Estate Dashboard Created By FineReport
You should also consider the type of data you’ll analyze. Retailers often deal with purchase types, customer feedback, and buying patterns. FineBI’s self-service analytics make it easy to explore these datasets without relying on IT teams. FineReport complements this by integrating data from multiple sources, ensuring you have a unified view of your operations.
Budget Considerations
Budget plays a crucial role in selecting the best data analysis software. Start by setting clear financial goals and reviewing historical data. Forecast your sales, revenue, and expenses to determine how much you can allocate for analytics tools.
Here’s a step-by-step approach to budgeting:
Set financial goals and objectives.
Review historical data to identify trends.
Forecast sales and revenue.
Estimate costs and expenses.
Create a budgeted profit and loss statement.
Design a cash flow plan.
Monitor and adjust the budget as needed.
Market trends also influence your budget. Factors like inflation, seasonality, and shifting customer preferences can impact your spending. FineBI and FineReport offer flexible pricing models, making them cost-effective options for businesses of all sizes. Unlike Tableau or Power BI, which often come with higher licensing fees, FineBI and FineReport provide enterprise-level features at a fraction of the cost.
"Considerable analysis of both internal and external data is necessary to create a high-quality retail budget. Much of the analysis involves looking at historical company data to see what has been working and to quantify key metrics to be used for estimating future results."
FineBI’s self-service analytics reduce reliance on IT teams, saving you time and money. FineReport’s automated reporting features streamline operations, allowing you to focus on strategy rather than manual tasks. These efficiencies translate directly into cost savings, making them ideal choices for budget-conscious retailers.
Evaluating Ease of Use
Ease of use is a critical factor when choosing data analytics tools. A tool that’s too complex can slow you down, while an intuitive interface can make your life much easier. Look for features like drag-and-drop functionality, real-time data connections, and cross-platform compatibility.
FineBI is designed with business users in mind. Its drag-and-drop interface allows you to create dashboards and visualizations without any coding skills. FineReport takes it a step further with its Excel-like interface, making it easy to design professional-grade reports. Both tools prioritize user-friendliness, ensuring you spend less time learning and more time analyzing.
Here’s what to consider when evaluating ease of use:
Drag-and-drop functionality: Simplifies the process of creating visualizations.
Real-time data connections: Ensures your dashboards always reflect the latest trends.
Cross-platform compatibility: Allows you to work seamlessly across devices and platforms.
Compared to Tableau and Power BI, FineBI offers a more collaborative environment. Teams can share dashboards and insights effortlessly, fostering better decision-making. FineReport’s automated scheduling ensures you get the right reports at the right time, without lifting a finger. These features make FineBI and FineReport the best data analysis software options for retailers looking for ease of use.
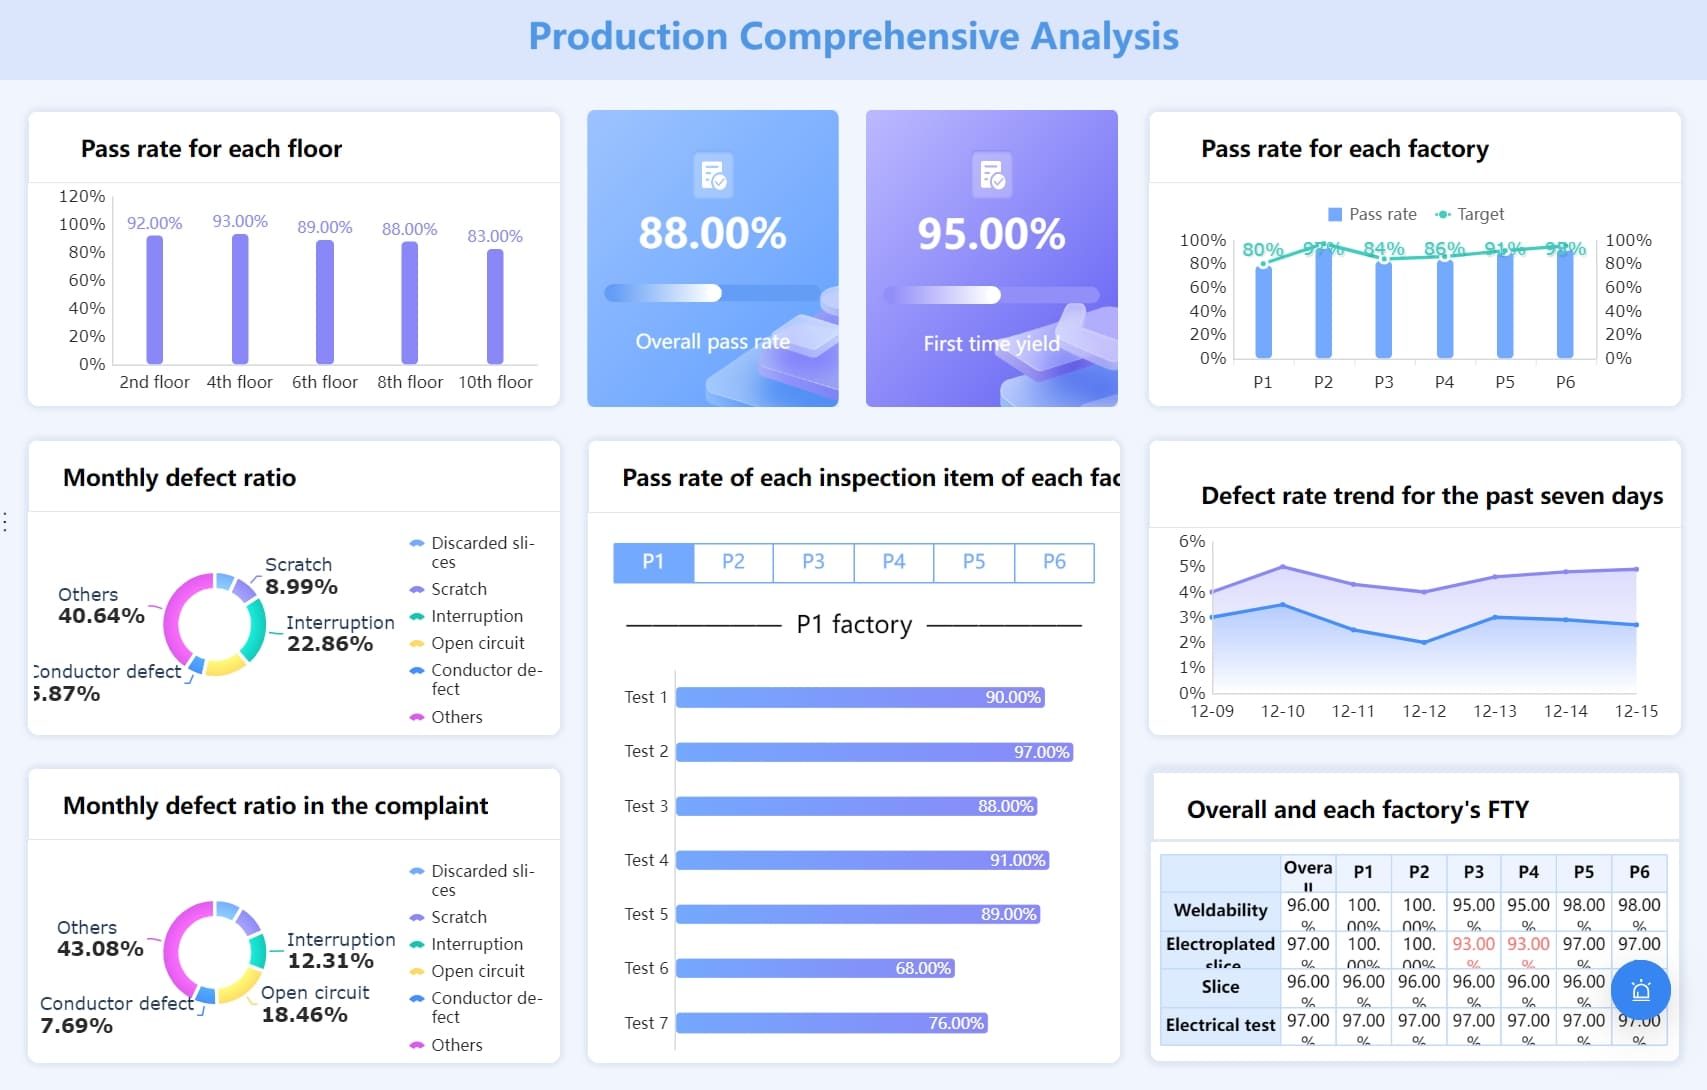
Production Comprehensive Analysis Dashboard Created By FineReport
Checking for Customer Support and Training
When choosing retail data analysis tools, customer support and training can make or break your experience. Imagine hitting a roadblock while analyzing sales trends or creating a report. Without reliable support, you’re stuck. That’s why evaluating the quality of customer service and training programs is crucial.
Start by looking at how the tool’s support team performs. Do they respond quickly? Are they knowledgeable? Metrics like response time and customer satisfaction scores can give you a clear picture. For example:
Surveys and feedback forms help you understand how users feel about the support they receive.
Analyzing support interactions, like chat transcripts or recorded calls, can reveal gaps in the team’s knowledge.
Tracking call resolution times shows how efficiently issues are handled.
FineBI and FineReport excel in this area. FineBI offers extensive documentation and tutorials, making it easy for your team to get started. FineReport goes a step further with personalized training sessions, ensuring your staff can create pixel-perfect reports without a hitch. Both tools prioritize user satisfaction, which is reflected in their high customer satisfaction scores.
Training is another key factor. A tool might have all the features you need, but if your team doesn’t know how to use it, those features are wasted. FineBI’s intuitive interface minimizes the learning curve, while FineReport’s Excel-like design feels familiar to most users. Together, they ensure your team can hit the ground running.
Tip: Engage with the tool’s support team during the trial phase. This gives you a firsthand look at their responsiveness and expertise.
Testing with Free Trials or Demos
Free trials or demos are your golden ticket to finding the perfect data analysis software. They let you test the waters without committing financially. But how do you make the most of this opportunity?
Start by focusing on key aspects during the trial:
Aspect
Description
Ease of Use
Check if the tool feels intuitive and whether your team can navigate it comfortably.
Integration
Test how well it connects with your existing systems, like POS or inventory management tools.
Performance
Evaluate its ability to handle large datasets and generate reports quickly.
Customization
See if it allows adjustments to fit your specific business needs.
FineBI and FineReport shine during trials. FineBI’s drag-and-drop interface makes it easy to explore data and create dashboards, even for non-technical users. FineReport impresses with its ability to generate highly formatted reports in minutes. Both tools integrate seamlessly with various data sources, ensuring you can test their full potential.
Involve your team during the trial. Let them explore the features and provide feedback. This ensures the tool meets everyone’s needs, from analysts to decision-makers. FineBI’s collaborative dashboards and FineReport’s automated scheduling features often stand out during this phase, showcasing their ability to streamline workflows.
Note: Don’t rush the trial. Take your time to explore all features and test real-world scenarios. This helps you make an informed decision.
By thoroughly testing tools like FineBI and FineReport, you can ensure they align with your business goals. Their user-friendly design, robust performance, and excellent support make them top contenders for retail data analysis in 2026.
Retail data analysis is no longer optional in 2026—it’s essential. The right tools empower you to adapt quickly, deliver personalized customer experiences, and scale your business with confidence. FineBI and FineReport stand out by combining user-friendly interfaces with powerful features like real-time dashboards and pixel-perfect reporting. These tools don’t just analyze data; they transform it into actionable insights that drive growth.
Consider this: real-time data enhances agility, while AI-powered analytics unlock patterns and predict trends. Tools like FineBI and FineReport streamline operations, ensuring your business stays ahead. Whether you’re optimizing inventory or tailoring customer experiences, these solutions grow with your ambitions. The future of retail belongs to those who leverage data effectively—start exploring today.
Click the banner below to also experience FineReport for free and empower your enterprise to convert data into productivity!
Access a wealth of case studies, industry insights, and solution guides to accelerate digital transformation.
FAQ
What is the difference between FineBI and FineReport?
FineBI focuses on self-service analytics, letting you explore data independently with real-time dashboards and OLAP analysis. FineReport excels in creating pixel-perfect reports and automating tasks like scheduled reporting. Together, they form a powerful ecosystem for both analysis and reporting.
Can FineBI and FineReport integrate with other systems?
Yes, both tools connect seamlessly to over 100 data sources, including relational databases, big data platforms, and Excel files. This ensures you can unify all your data in one place for comprehensive analysis and reporting.
Are FineBI and FineReport suitable for small businesses?
Absolutely! FineBI’s user-friendly interface and FineReport’s flexible reporting make them ideal for businesses of all sizes. Their scalable features grow with your business, ensuring long-term value.
How do FineBI and FineReport enhance collaboration?
FineBI allows teams to share dashboards and insights effortlessly, fostering better decision-making. FineReport supports collaborative report development with role-based access control, ensuring secure and efficient teamwork.
Do I need technical skills to use FineBI or FineReport?
Not at all! FineBI’s drag-and-drop interface and FineReport’s Excel-like design make them accessible even if you’re not a data expert. You can start analyzing and reporting without relying on IT teams.
How do these tools improve decision-making?
FineBI provides real-time dashboards and predictive analytics, helping you anticipate trends. FineReport delivers detailed, professional-grade reports that offer clear insights into your operations. Together, they empower smarter, faster decisions.
Can FineBI and FineReport handle large datasets?
Yes, both tools are built for performance. FineBI’s high-performance computing engine processes massive datasets effortlessly, while FineReport manages complex reporting needs without slowing down.
Are there training resources for FineBI and FineReport?
Yes, both tools come with extensive documentation, tutorials, and personalized training sessions. These resources ensure you and your team can maximize their potential quickly and effectively.