In 2026, business intelligence services will play a pivotal role in shaping the success of organizations. Data-driven strategies are no longer optional. Companies that embrace them are 23 times more likely to acquire customers and 19 times more likely to achieve profitability. With the business intelligence market projected to grow to $54.27 billion by 2030, staying competitive means partnering with the right business intelligence vendors. These providers empower you to make faster, smarter decisions, helping you navigate high customer expectations and global competition. Choosing wisely can yield a 127% return on investment within three years.
With so much at stake, selecting the right BI partner requires careful consideration. The best providers combine robust technology with industry expertise and scalable solutions that grow with your business. Here are 5 top business intelligence services providers that are setting the standard in 2026:
Tableau
Microsoft Power BI
Qlik Sense
Oracle Analytics Cloud
Honorable Mentions
Understanding Business Intelligence Services
What Are Business Intelligence Services?
Business intelligence services empower organizations to transform raw data into actionable insights. These services encompass tools, technologies, and practices that enable you to collect, integrate, analyze, and visualize data. By leveraging business intelligence tools, you can uncover trends, monitor performance, and make informed decisions. Whether you aim to optimize operations or enhance customer experiences, these services provide the foundation for data-driven decision-making.
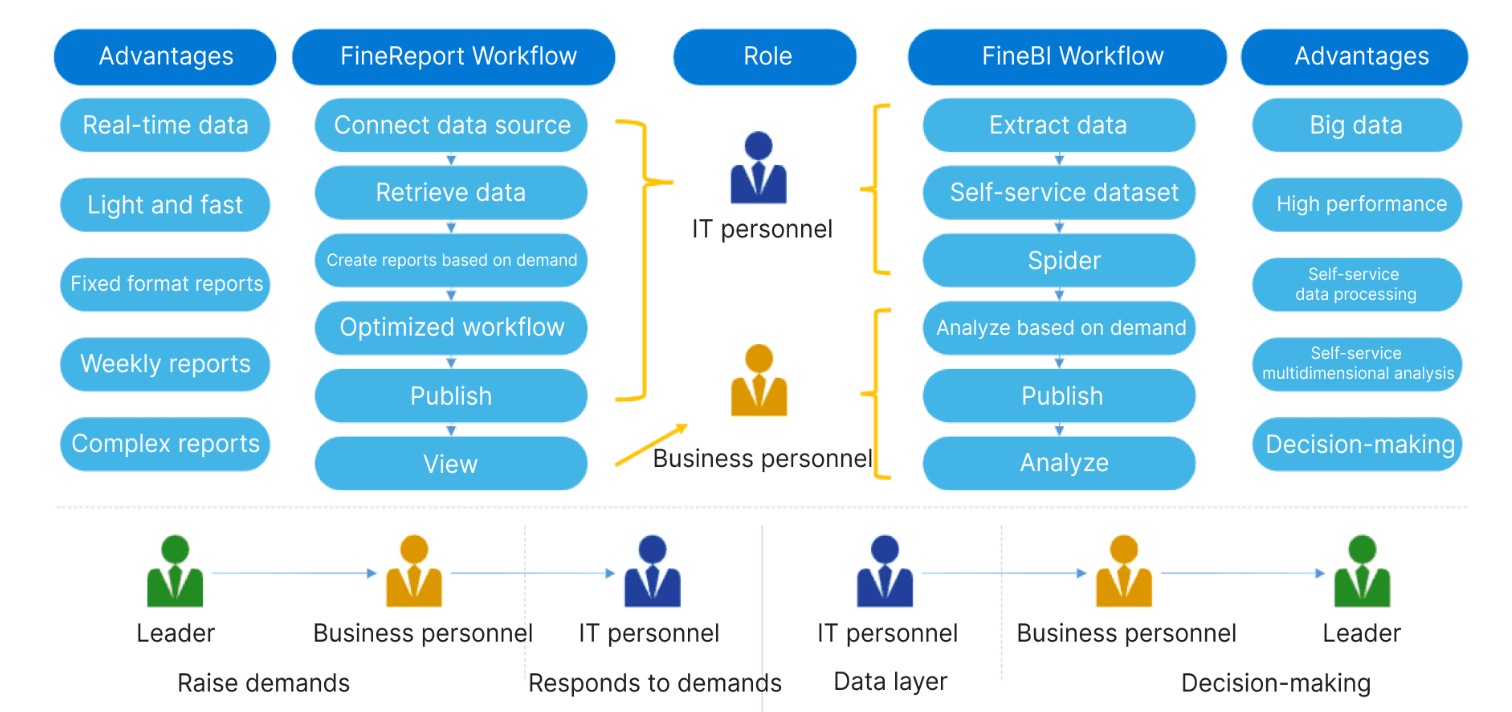
For example, enterprise business intelligence platforms like FineBI and FineReport offer tailored solutions for different needs. FineBI focuses on self-service analytics, allowing business users to independently explore data and generate real-time dashboards. In contrast, FineReport excels in creating structured, pixel-perfect reports for IT-driven reporting tasks. Together, they address diverse business analytics requirements, ensuring flexibility and efficiency.
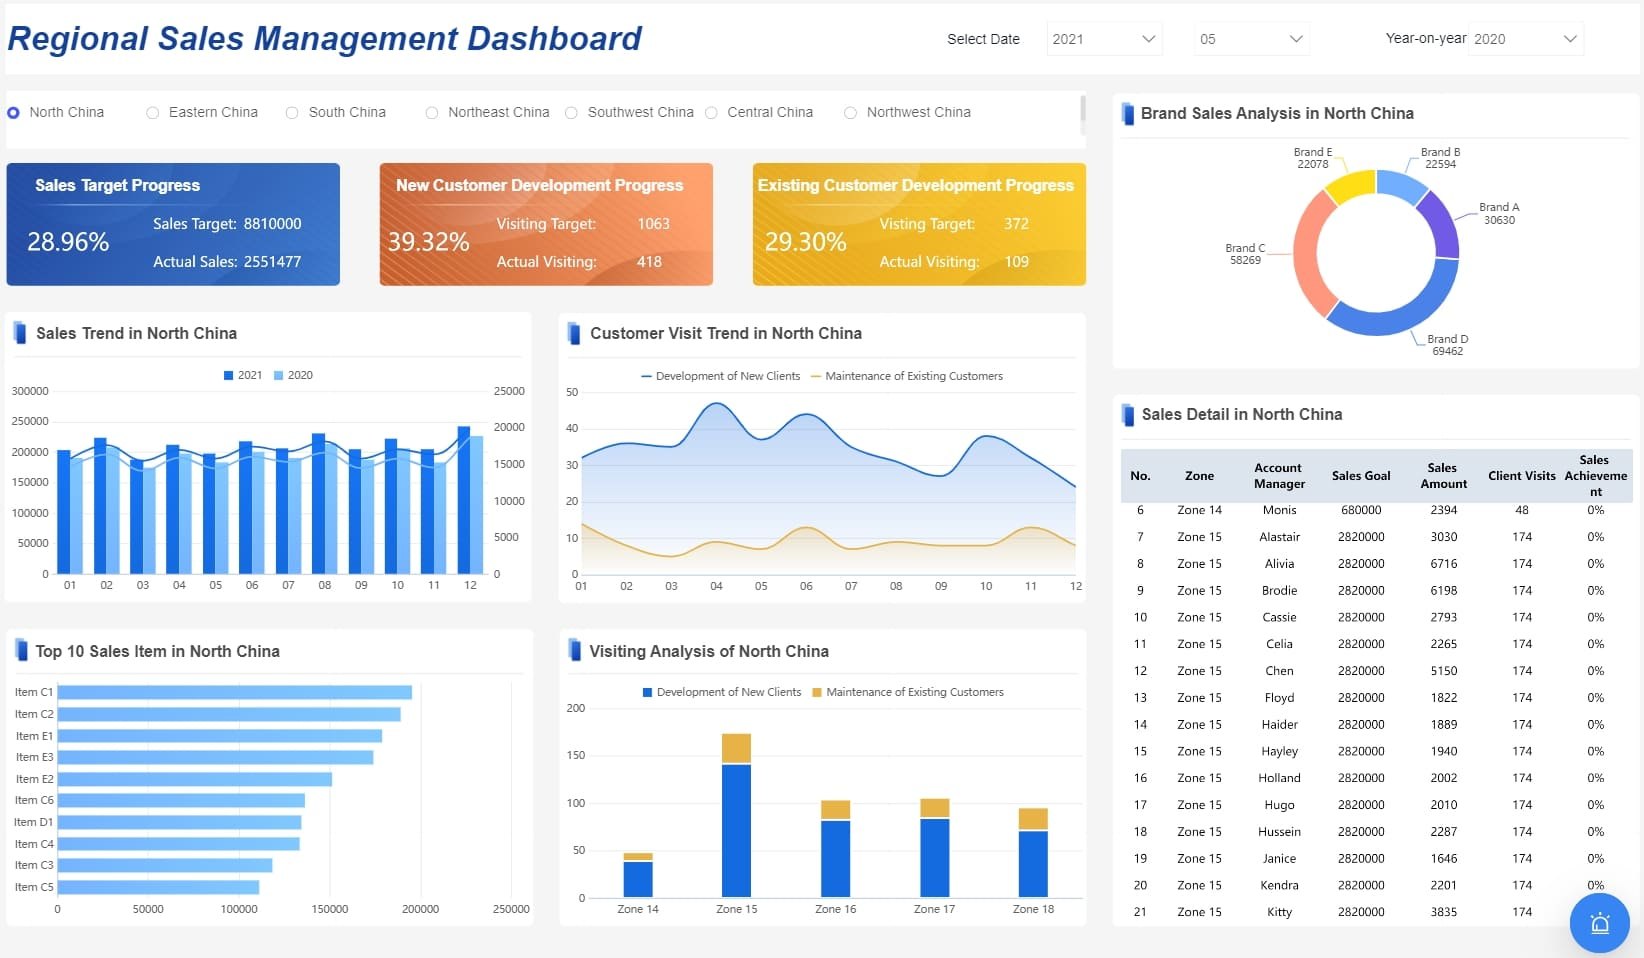
Regional Sales Management Dashboard Created By FineReport
Key Benefits of Business Intelligence Services
Improved decision-making with actionable insights
Business intelligence services enable improved decision-making by providing actionable insights. For instance, Lotte.com used customer experience analytics to understand shopping cart abandonment. This led to a $10 million increase in sales and stronger customer loyalty. Similarly, FineBI empowers you to analyze data independently, reducing reliance on IT teams and accelerating decision-making processes.
Enhanced operational efficiency through data-driven strategies
Operational efficiency improves significantly when you adopt data-driven strategies. Cementos Argos, for example, established a business analytics center to standardize finance processes. This initiative enhanced profitability and provided deeper insights into operations. FineReport complements such efforts by offering robust reporting and visualization capabilities, ensuring seamless data integration and ETL processes.
Gaining a competitive edge with advanced analytics
Advanced analytics give you a competitive edge by uncovering hidden opportunities. Sabre Airline Solutions leveraged real-time dashboards to analyze customer behavior, boosting revenue and client satisfaction. FineBI supports similar outcomes by enabling real-time insights and dynamic data visualization, helping you stay ahead in a fast-paced market.
Trends Shaping Business Intelligence in 2026
AI and machine learning integration in BI tools
Artificial intelligence and machine learning are revolutionizing business intelligence tools. Predictive and prescriptive analytics are becoming central to BI applications, enabling you to anticipate trends and make proactive decisions. FineBI incorporates augmented analytics, allowing you to generate insights effortlessly through automated analysis.
Real-time analytics and dynamic data visualization
Real-time analytics are replacing legacy systems, offering immediate insights into business performance. Tools like FineBI excel in creating real-time dashboards, ensuring you can respond quickly to changing conditions. Additionally, FineReport enhances data visualization with over 60 chart types and dynamic 3D visualizations, making complex data more accessible.
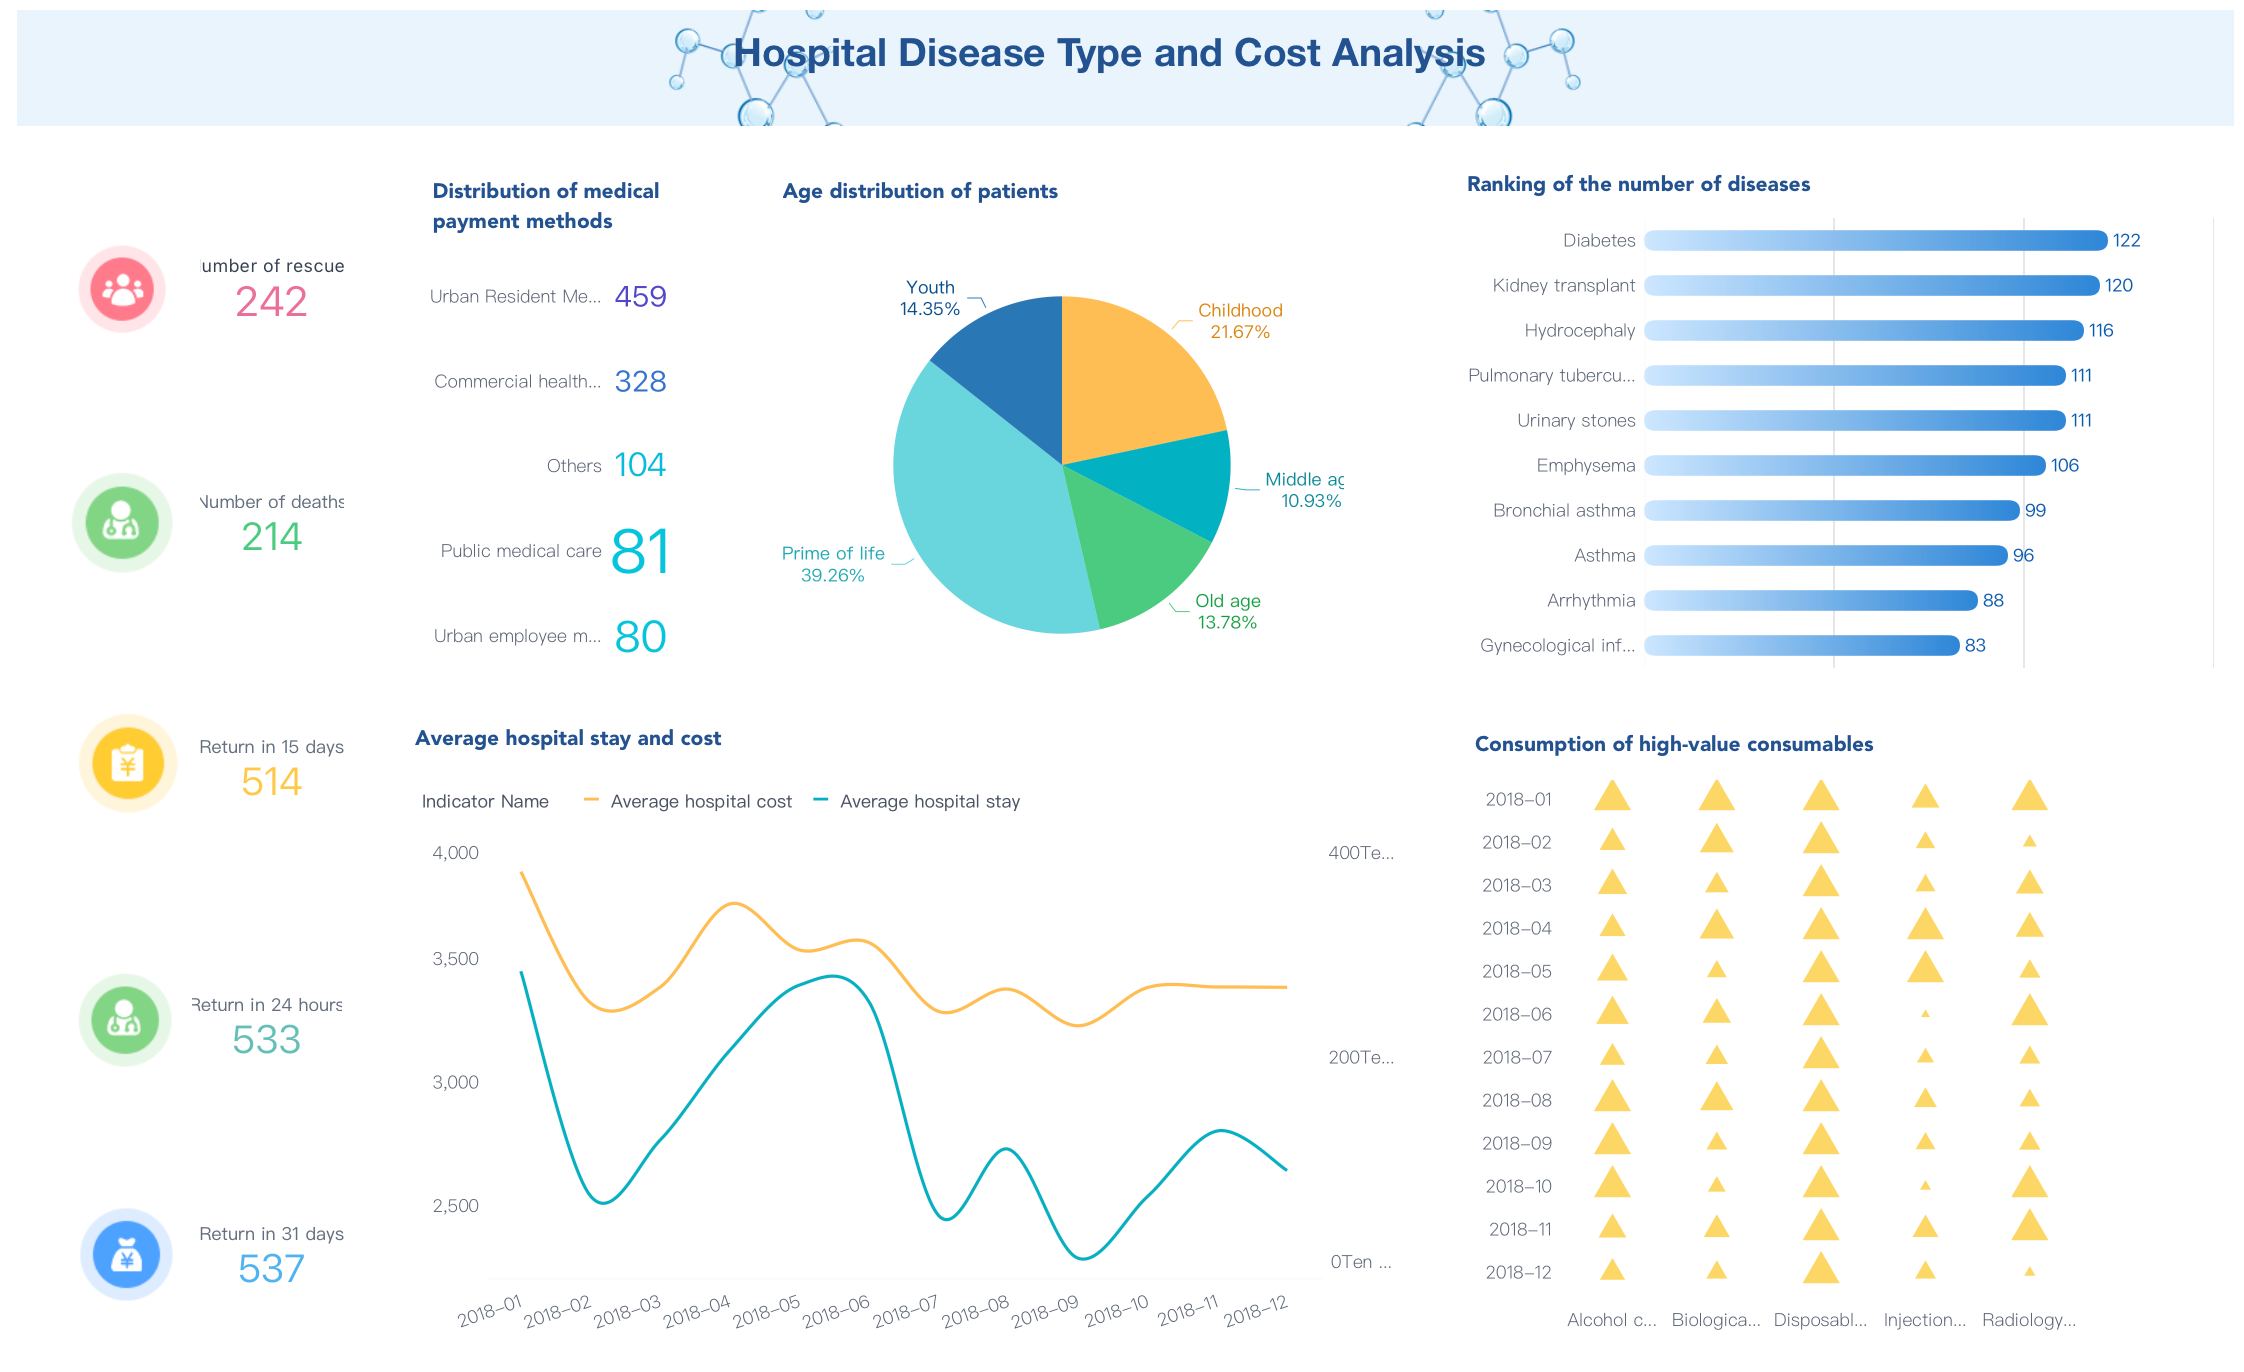
Hospital Disease Type and Cost Analysis Dashboard Created By FineBI
The rise of cloud-based business intelligence services
Cloud-based BI services are gaining traction due to their scalability and accessibility. These platforms eliminate the need for complex data architectures, simplifying deployment and reducing costs. FineBI and FineReport both support cloud integration, ensuring seamless access to data anytime, anywhere.
Note: The global business intelligence market is projected to grow from $30.1 billion in 2024 to $116.25 billion by 2033. This growth underscores the increasing demand for BI services that enhance decision-making and operational efficiency.
Criteria for Selecting Top Business Intelligence Services Vendors
Key Factors to Consider
Industry expertise and proven track record
When choosing a business intelligence service provider, you should prioritize vendors with extensive industry expertise and a proven track record. Look for those who have demonstrated success in real-world applications. Case studies and testimonials can provide valuable insights into their ability to deliver results. For example, FineBI has been successfully implemented across industries like manufacturing and finance, showcasing its versatility and effectiveness. Vendors with technical expertise in leading tools like Power BI, Tableau, and SAP BI also stand out, as they can tailor solutions to meet your unique challenges.
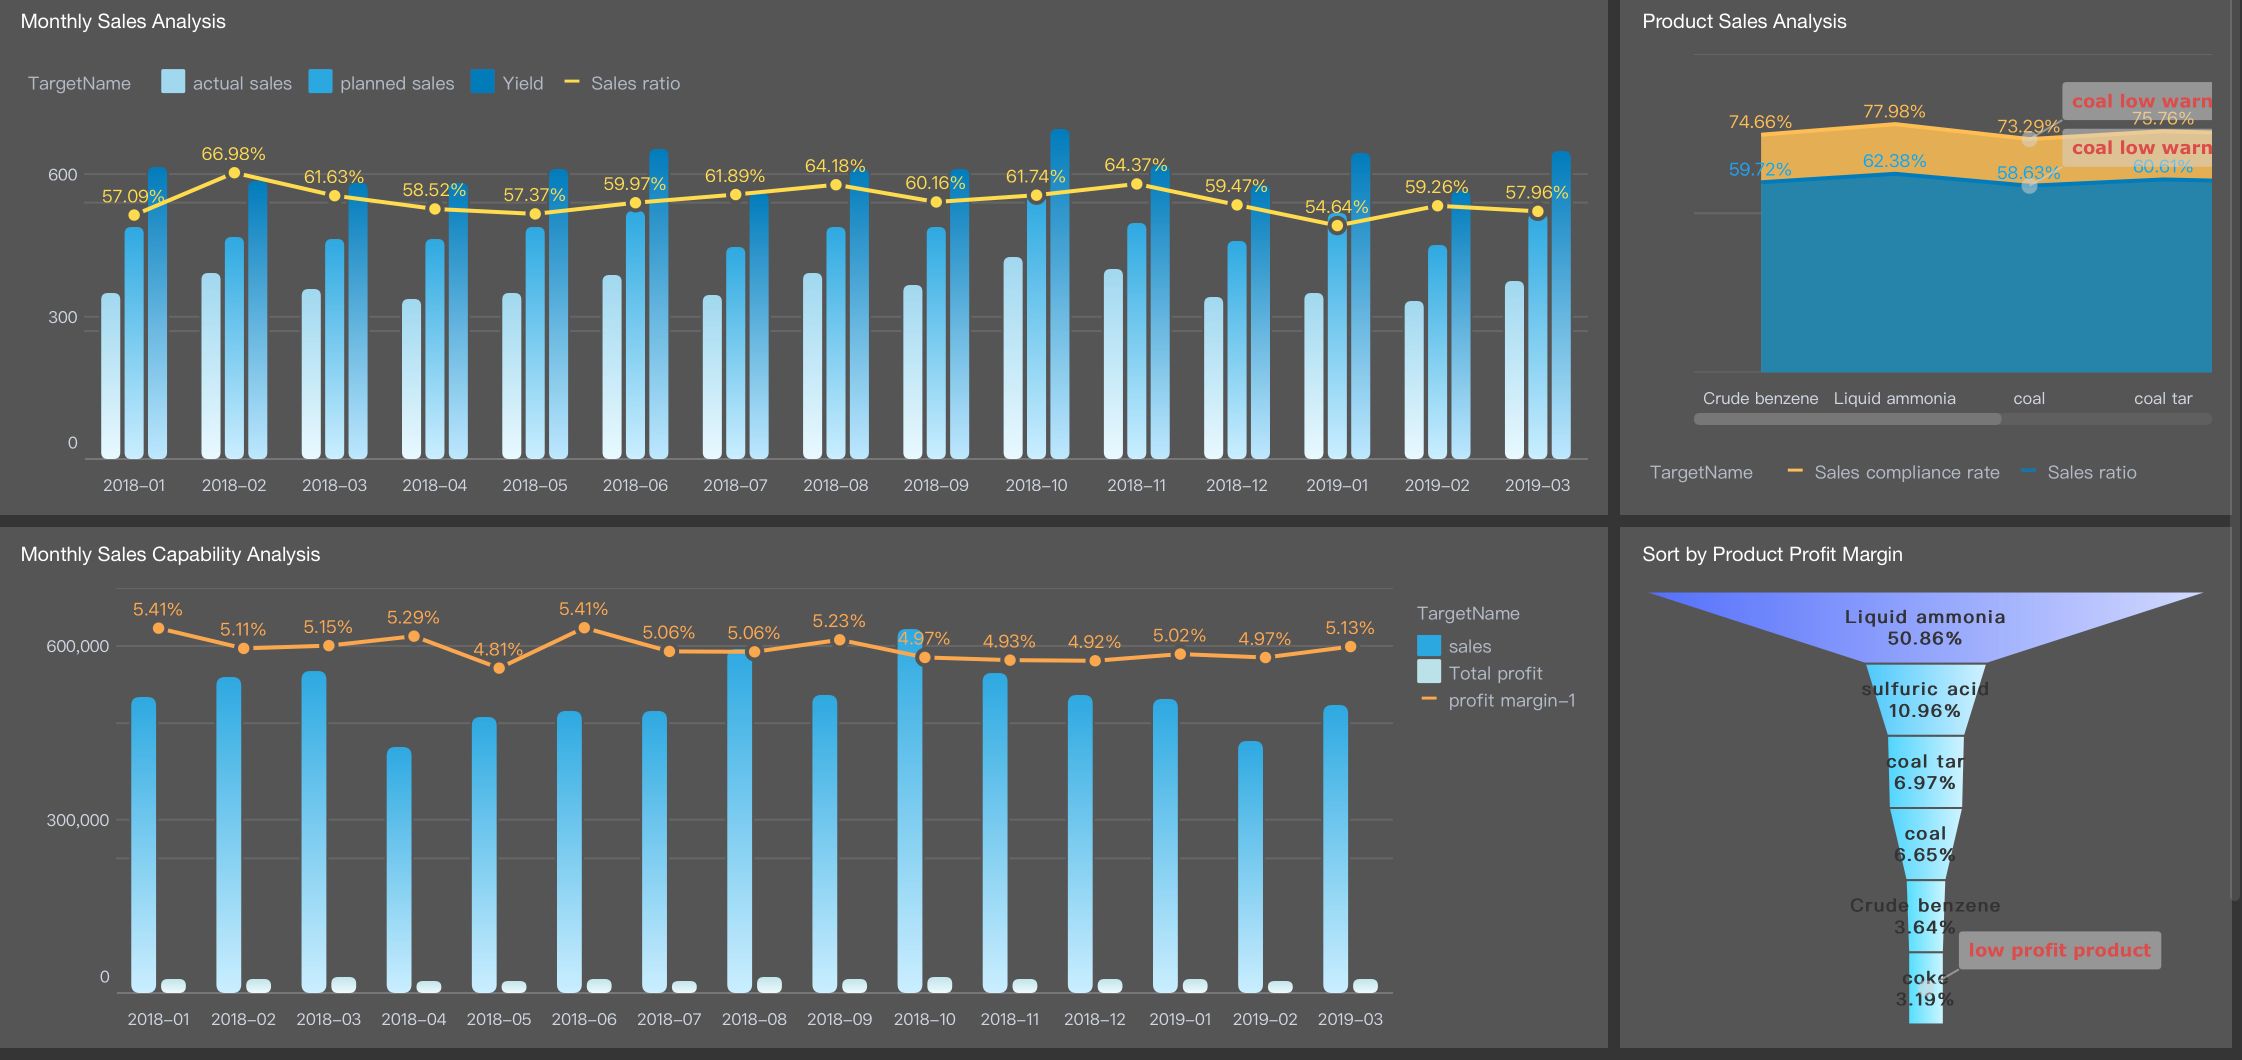
Enterprise Product Sales Analysis Dashboard Created By FineBI
Comprehensive range of services and tools
A comprehensive range of services and tools is essential for addressing diverse business analytics needs. FineBI and FineReport exemplify this by offering complementary functionalities. FineBI focuses on self-service analytics, enabling business users to independently explore data and create real-time dashboards. FineReport, on the other hand, excels in generating structured, pixel-perfect reports for IT-driven tasks. Together, they provide a holistic solution that caters to both dynamic analysis and detailed reporting requirements.
Scalability and flexibility for growing businesses
Scalability and flexibility are critical for businesses aiming to grow. Your chosen vendor should offer solutions that adapt to your evolving needs. FineBI supports seamless integration with various data sources, including big data platforms and relational databases, ensuring it can handle increasing data volumes. Its high-performance computing engine processes massive datasets efficiently, making it ideal for enterprises with expanding operations.
Quality of customer support and training
Quality customer support and training can significantly impact your experience with a business intelligence service provider. Vendors that offer hands-on assistance during implementation and ongoing support ensure you can maximize the value of their tools. FineBI provides comprehensive training programs and a user-friendly interface, making it accessible even to those with limited technical expertise. This focus on usability and support helps you achieve faster adoption and better results.
Aligning Business Intelligence Consulting with Business Goals
Aligning business intelligence consulting with your business goals ensures measurable success. A well-defined BI strategy should address your specific challenges and objectives. For instance, FineBI helps you streamline data-driven decision-making by offering real-time insights and customizable dashboards. Consulting firms often evaluate your existing tools and data to identify areas for improvement. They also recommend tailored BI tools and provide implementation support to ensure successful adoption. This approach ensures your BI strategy aligns with your goals, driving better outcomes.
Enterprise Reporting Data Analysis Dashboard Created By FineBI
Component
Description
Comprehensive Business Intelligence Strategy Development
Collaborating with leaders to create a BI strategy that aligns with business goals for measurable success.
In-depth Business Intelligence Capability Assessment
Evaluating existing data and tools to identify strengths and opportunities for improvement.
Technology Guidance
Recommending BI tools tailored to organizational needs and developing a roadmap for decision-making.
Implementation Support for Successful Adoption
Providing hands-on assistance and training during implementation to ensure effective BI strategy adoption.
Balancing Cost and Value in BI Solutions
Balancing cost and value is crucial when selecting a business intelligence service provider. While upfront costs may seem high, the long-term benefits often outweigh the investment. Recent studies show an average ROI of 112% for BI solutions, with a payback period of just 1.6 years. FineBI and FineReport offer cost-effective solutions by combining advanced features with competitive pricing. FineBI enhances productivity by over 50%, while FineReport simplifies complex reporting tasks, reducing reliance on IT teams. These benefits make them valuable investments for businesses seeking to optimize their operations.
Metric
Value
Average ROI
112%
Payback Period
1.6 years
ROI in 3 Years
127%
Tip: When evaluating vendors, focus on their ability to deliver measurable outcomes. Look for evidence of increased decision-making speed, improved operational efficiency, and enhanced data quality. FineBI and FineReport consistently deliver these results, making them reliable choices for your BI strategy.
Top Business Intelligence Services Providers in 2026
Tableau by Salesforce stands out as a leading business intelligence service provider. It offers a user-friendly interface that simplifies data visualization. You can create interactive dashboards and reports without needing advanced technical skills. Tableau supports integration with multiple data sources, including cloud-based platforms, relational databases, and spreadsheets. Its drag-and-drop functionality makes it easy to explore data and uncover insights.
Tableau also excels in advanced analytics. It incorporates AI-driven features like Explain Data, which helps you understand the "why" behind your data trends. Additionally, Tableau Prep Builder streamlines data preparation, enabling you to clean and organize data efficiently. These features make Tableau a versatile tool for businesses of all sizes.
Strengths and unique selling points
Tableau's strength lies in its ability to handle complex data visualization tasks. It offers over 200 connectors, ensuring seamless integration with various data sources. Its real-time collaboration features allow teams to work together on dashboards, enhancing productivity. Tableau's community support is another advantage, providing you with access to a vast network of users and resources.
However, while Tableau excels in visualization, it may require additional tools for comprehensive data analysis. FineBI, in comparison, offers a more balanced approach by combining self-service analytics with robust data integration capabilities. FineBI's intuitive interface and real-time insights make it a strong alternative for businesses seeking a holistic solution.
Microsoft Power BI is a cost-effective solution for small and medium-sized businesses. Its Pro version starts at just $9.99 per user per month. Power BI provides a simple user interface, especially for those familiar with Microsoft Office. This familiarity reduces the learning curve and allows you to get started quickly.
Power BI supports real-time reporting and live data connections, ensuring you have up-to-the-minute insights. Its strong data modeling tools and multiple data connectors enable flexible data formatting. The use of DAX (Data Analysis Expressions) for complex calculations gives you significant control over data handling and presentation.
Strengths and unique selling points
Power BI's affordability and ease of use make it a popular choice. Its integration with other Microsoft products, like Excel and Azure, enhances its functionality. The platform's ability to handle real-time data and provide live dashboards is crucial for businesses needing immediate insights.
While Power BI offers robust features, it may not match the scalability of FineBI for enterprise-level applications. FineBI's high-performance computing engine processes massive datasets efficiently, supporting over 10,000 users for online viewing. This scalability makes FineBI a better fit for growing businesses with complex data needs.
Qlik Sense is known for its associative data engine, which allows you to explore data relationships intuitively. Its self-service analytics capabilities empower you to create dashboards and reports without relying on IT teams. Qlik Sense supports a wide range of data sources, including big data platforms and cloud services.
The platform also offers advanced analytics features, such as predictive modeling and AI-driven insights. Its Smart Search functionality helps you find relevant data quickly, enhancing your analysis process. Qlik Sense's mobile-friendly design ensures you can access insights on the go.
Strengths and unique selling points
Qlik Sense's associative engine sets it apart, enabling you to uncover hidden data relationships. Its focus on self-service analytics aligns with the needs of modern businesses. The platform's scalability and flexibility make it suitable for organizations of various sizes.
However, Qlik Sense may require more technical expertise compared to FineBI. FineBI's user-friendly interface and drag-and-drop functionality make it accessible to users with limited technical backgrounds. Additionally, FineBI's role-based access control ensures data security, a feature that enhances its appeal for enterprises.
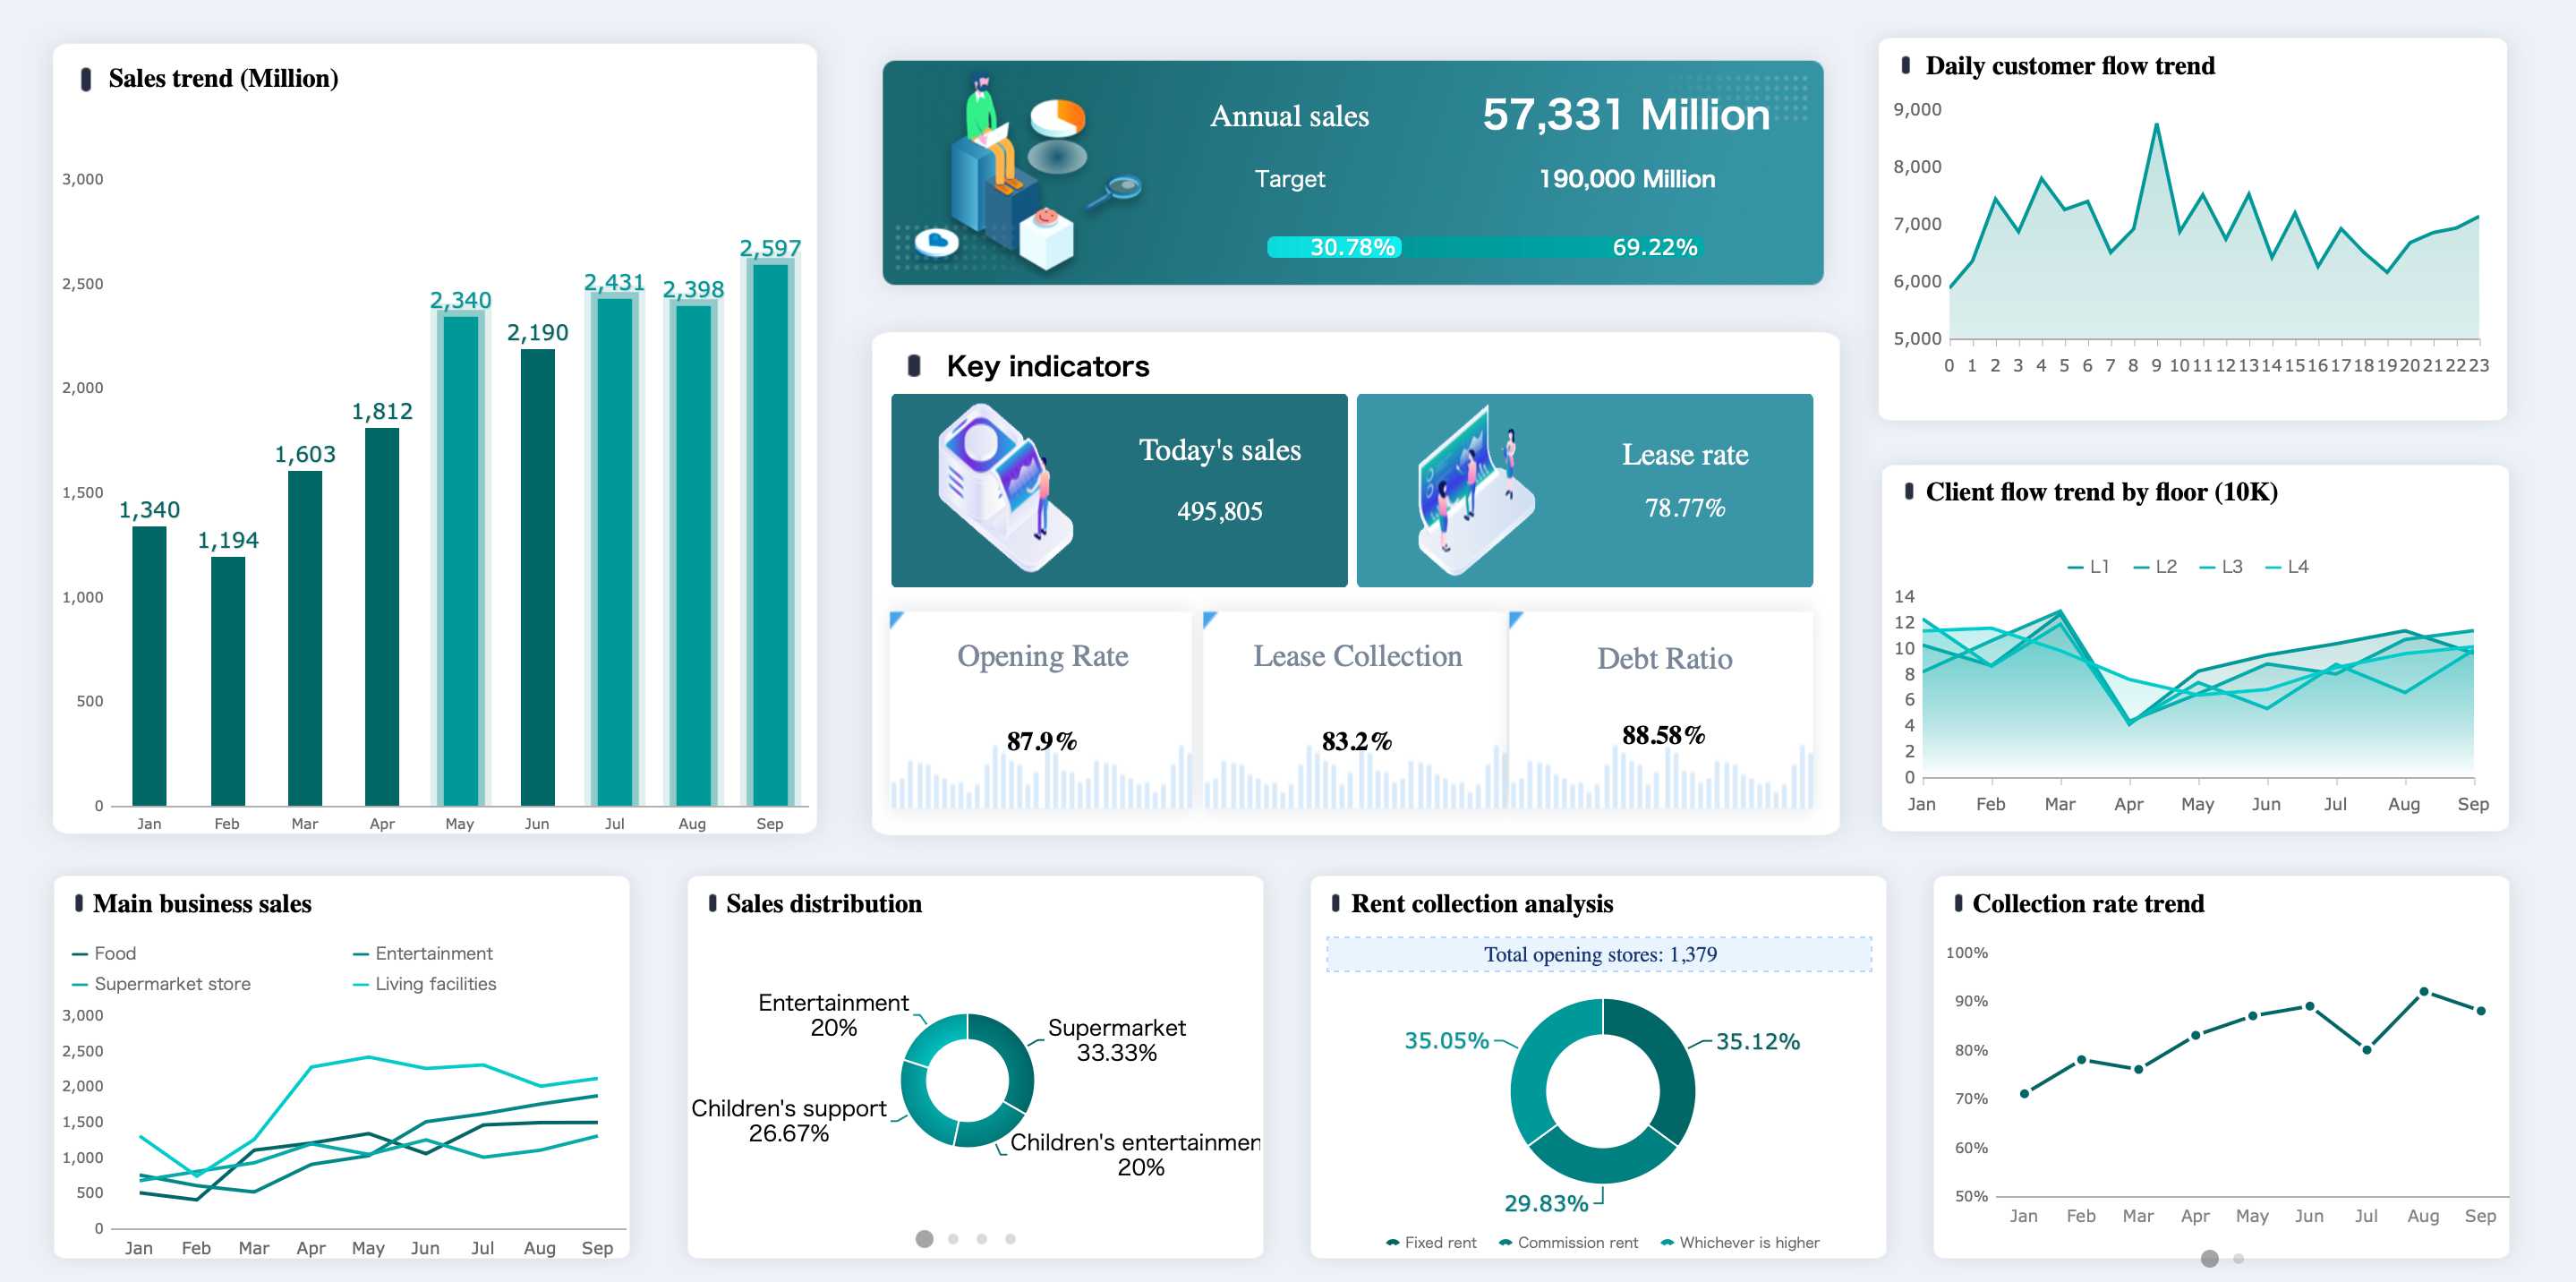
4.FanRuan: FineBI, FineReport, and FineChatBI
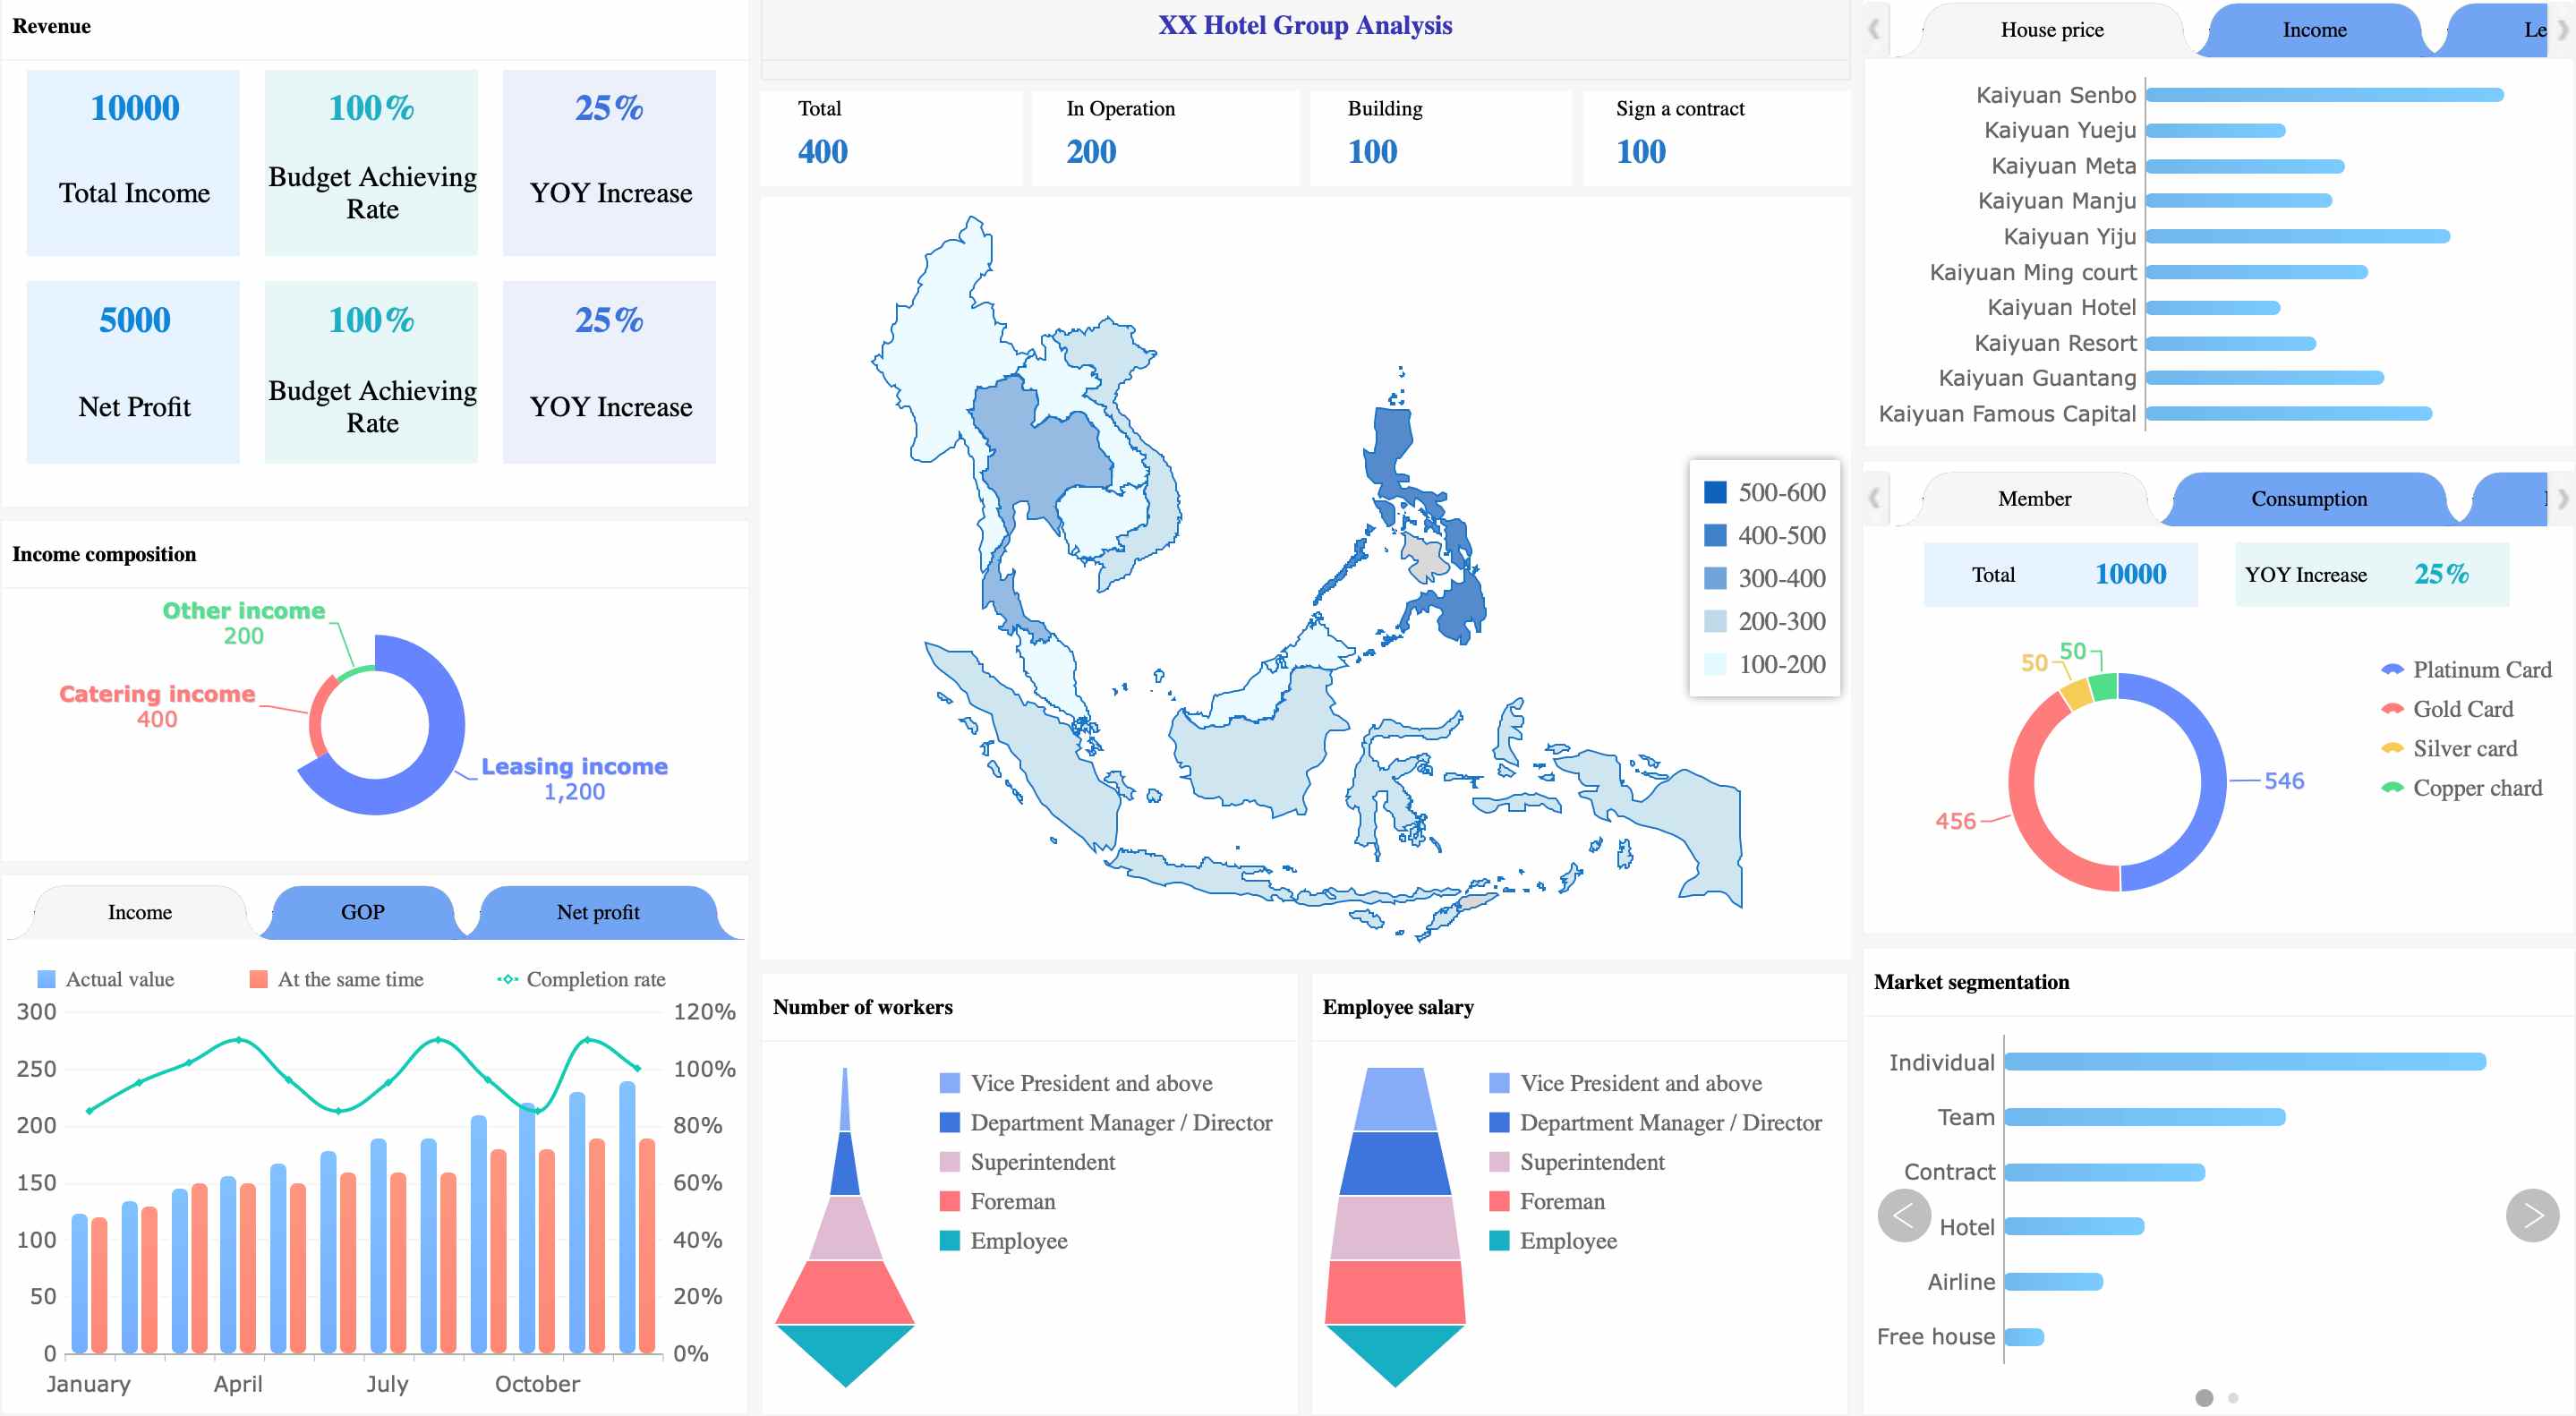
Hotel Group Analysis Dashboard Created By FineReport
FineBI is a self-service business intelligence tool designed to make data analysis accessible to everyone in your organization. Its intuitive drag-and-drop interface allows you to create dashboards and perform OLAP (Online Analytical Processing) analysis without needing technical expertise. FineBI connects seamlessly to over 100 data sources, including big data platforms like Hadoop and relational databases like MySQL and Oracle. This flexibility ensures you can unify data from multiple systems for comprehensive analysis.
FineBI also excels in real-time analytics. Its high-performance computing engine processes massive datasets efficiently, enabling you to generate insights instantly. The platform supports advanced data visualization with over 60 chart types, helping you interpret complex data effortlessly. Additionally, FineBI’s enterprise-level data permission control ensures secure access, allowing you to assign roles and permissions based on your organizational structure.
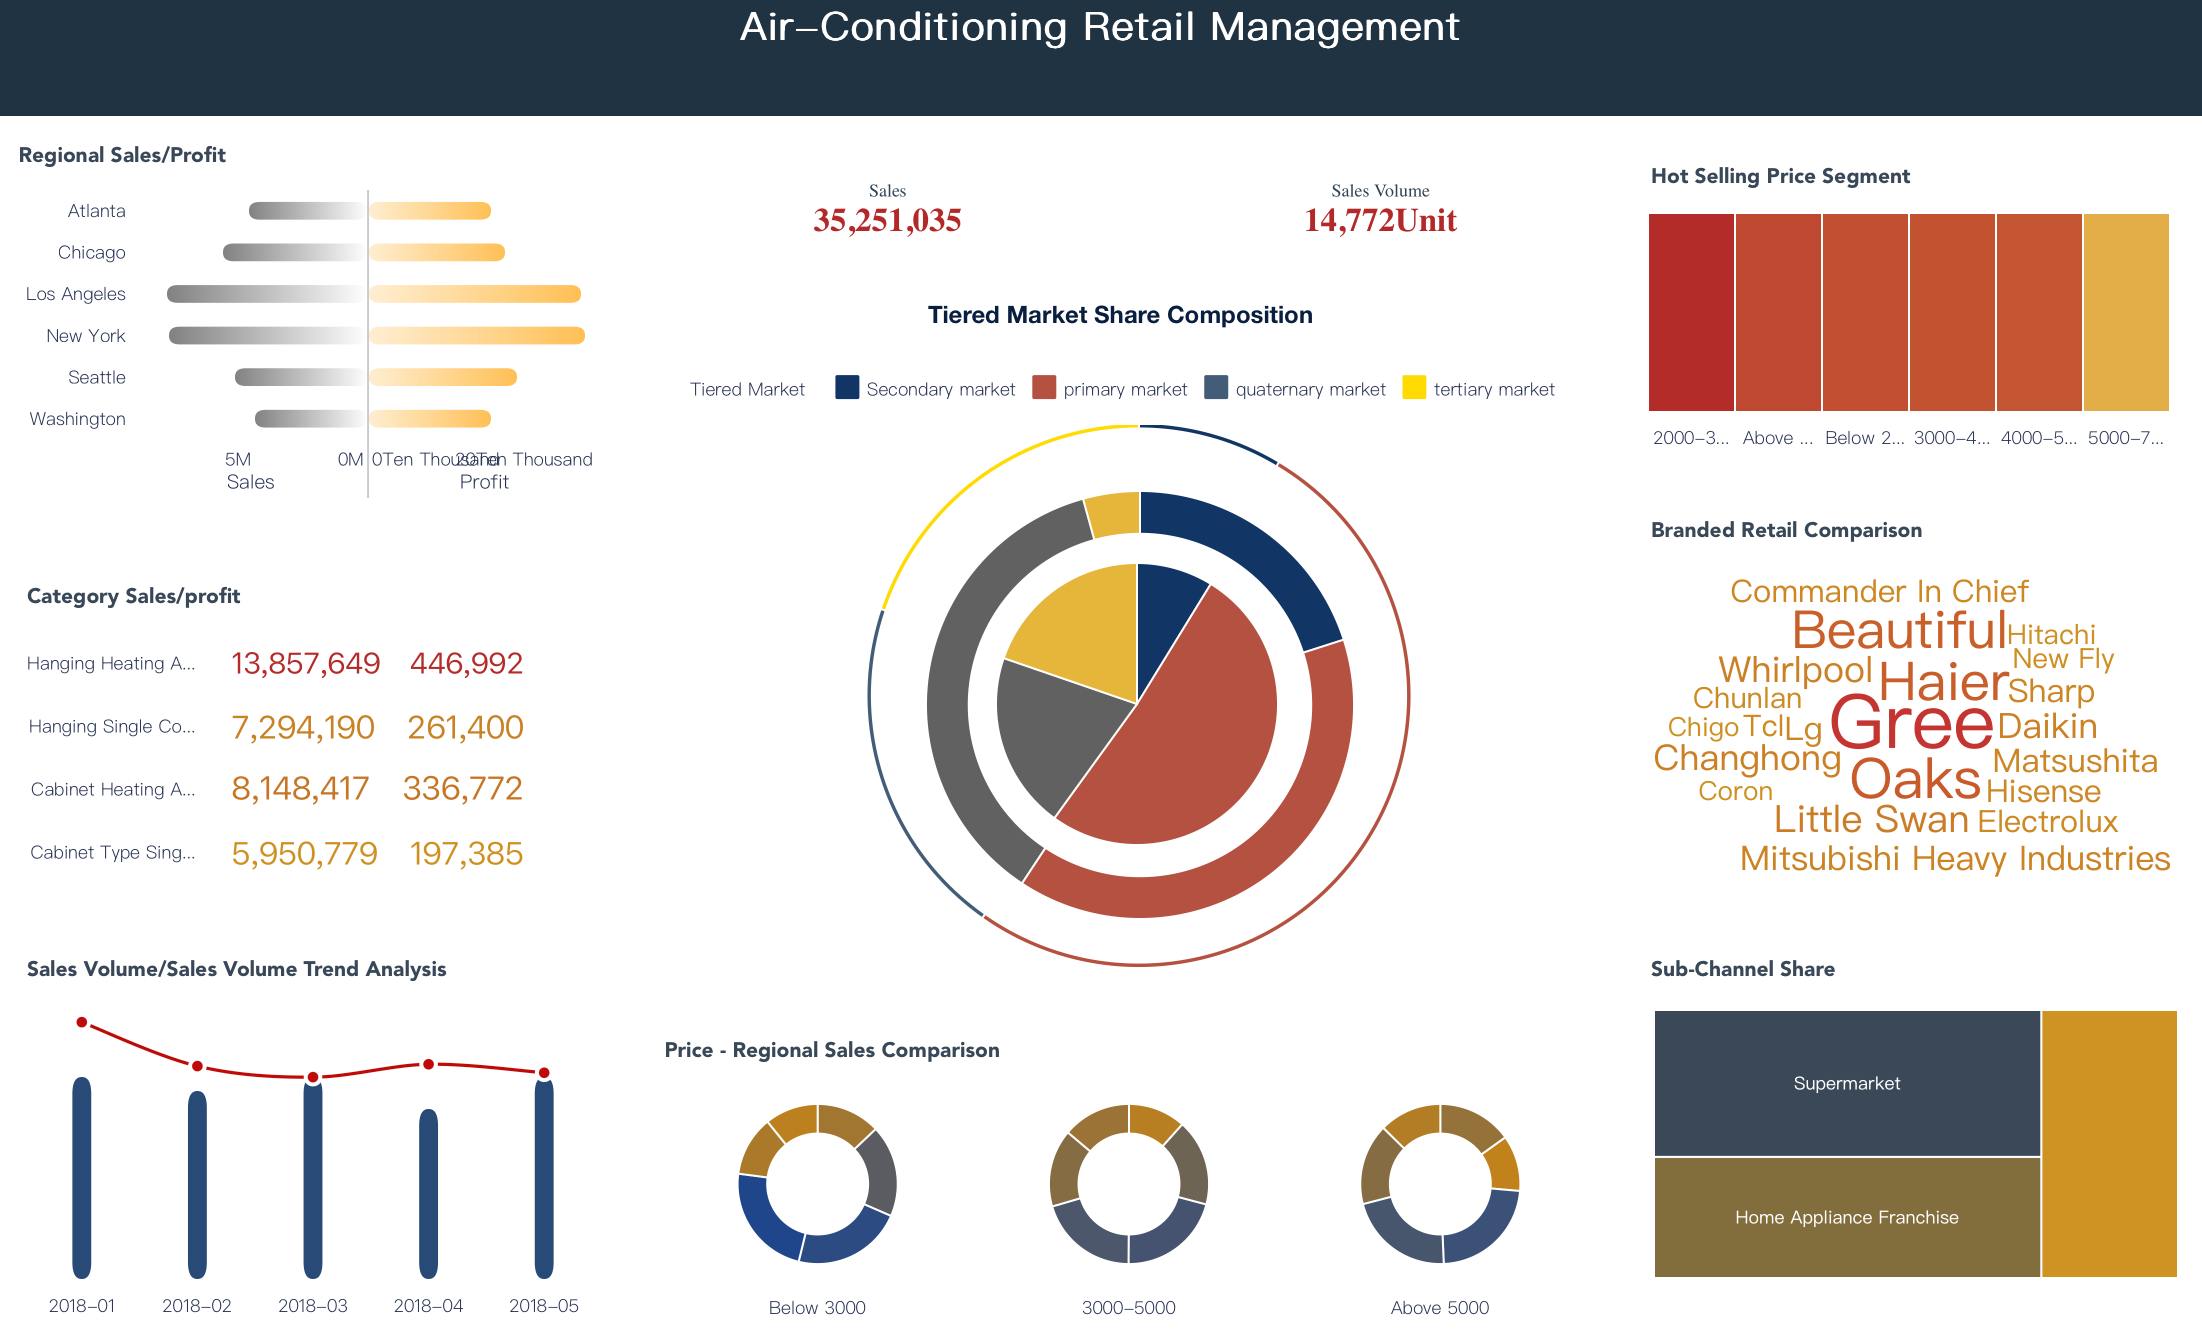
Air-Conditioning Retail Management Dashboard Created By FineBI
Strengths and unique selling points of FineReport
FineReport complements FineBI by focusing on IT-driven reporting tasks. It specializes in creating structured, pixel-perfect reports that meet the highest standards of accuracy and presentation. FineReport’s Excel-like interface simplifies report design, making it easy for IT teams to develop complex reports without extensive training.
One of FineReport’s standout features is its robust ETL (Extract, Transform, Load) capabilities. It allows you to preprocess data efficiently, ensuring high-quality inputs for your reports. FineReport also supports dynamic reporting, enabling you to update reports automatically as new data becomes available. This feature is particularly valuable for organizations that require real-time insights.
When comparing FineBI and FineReport, the distinction lies in their focus areas. FineBI empowers business users with self-service analytics, while FineReport caters to IT professionals who need to produce detailed, structured reports. Together, they provide a comprehensive solution for all your business intelligence needs.
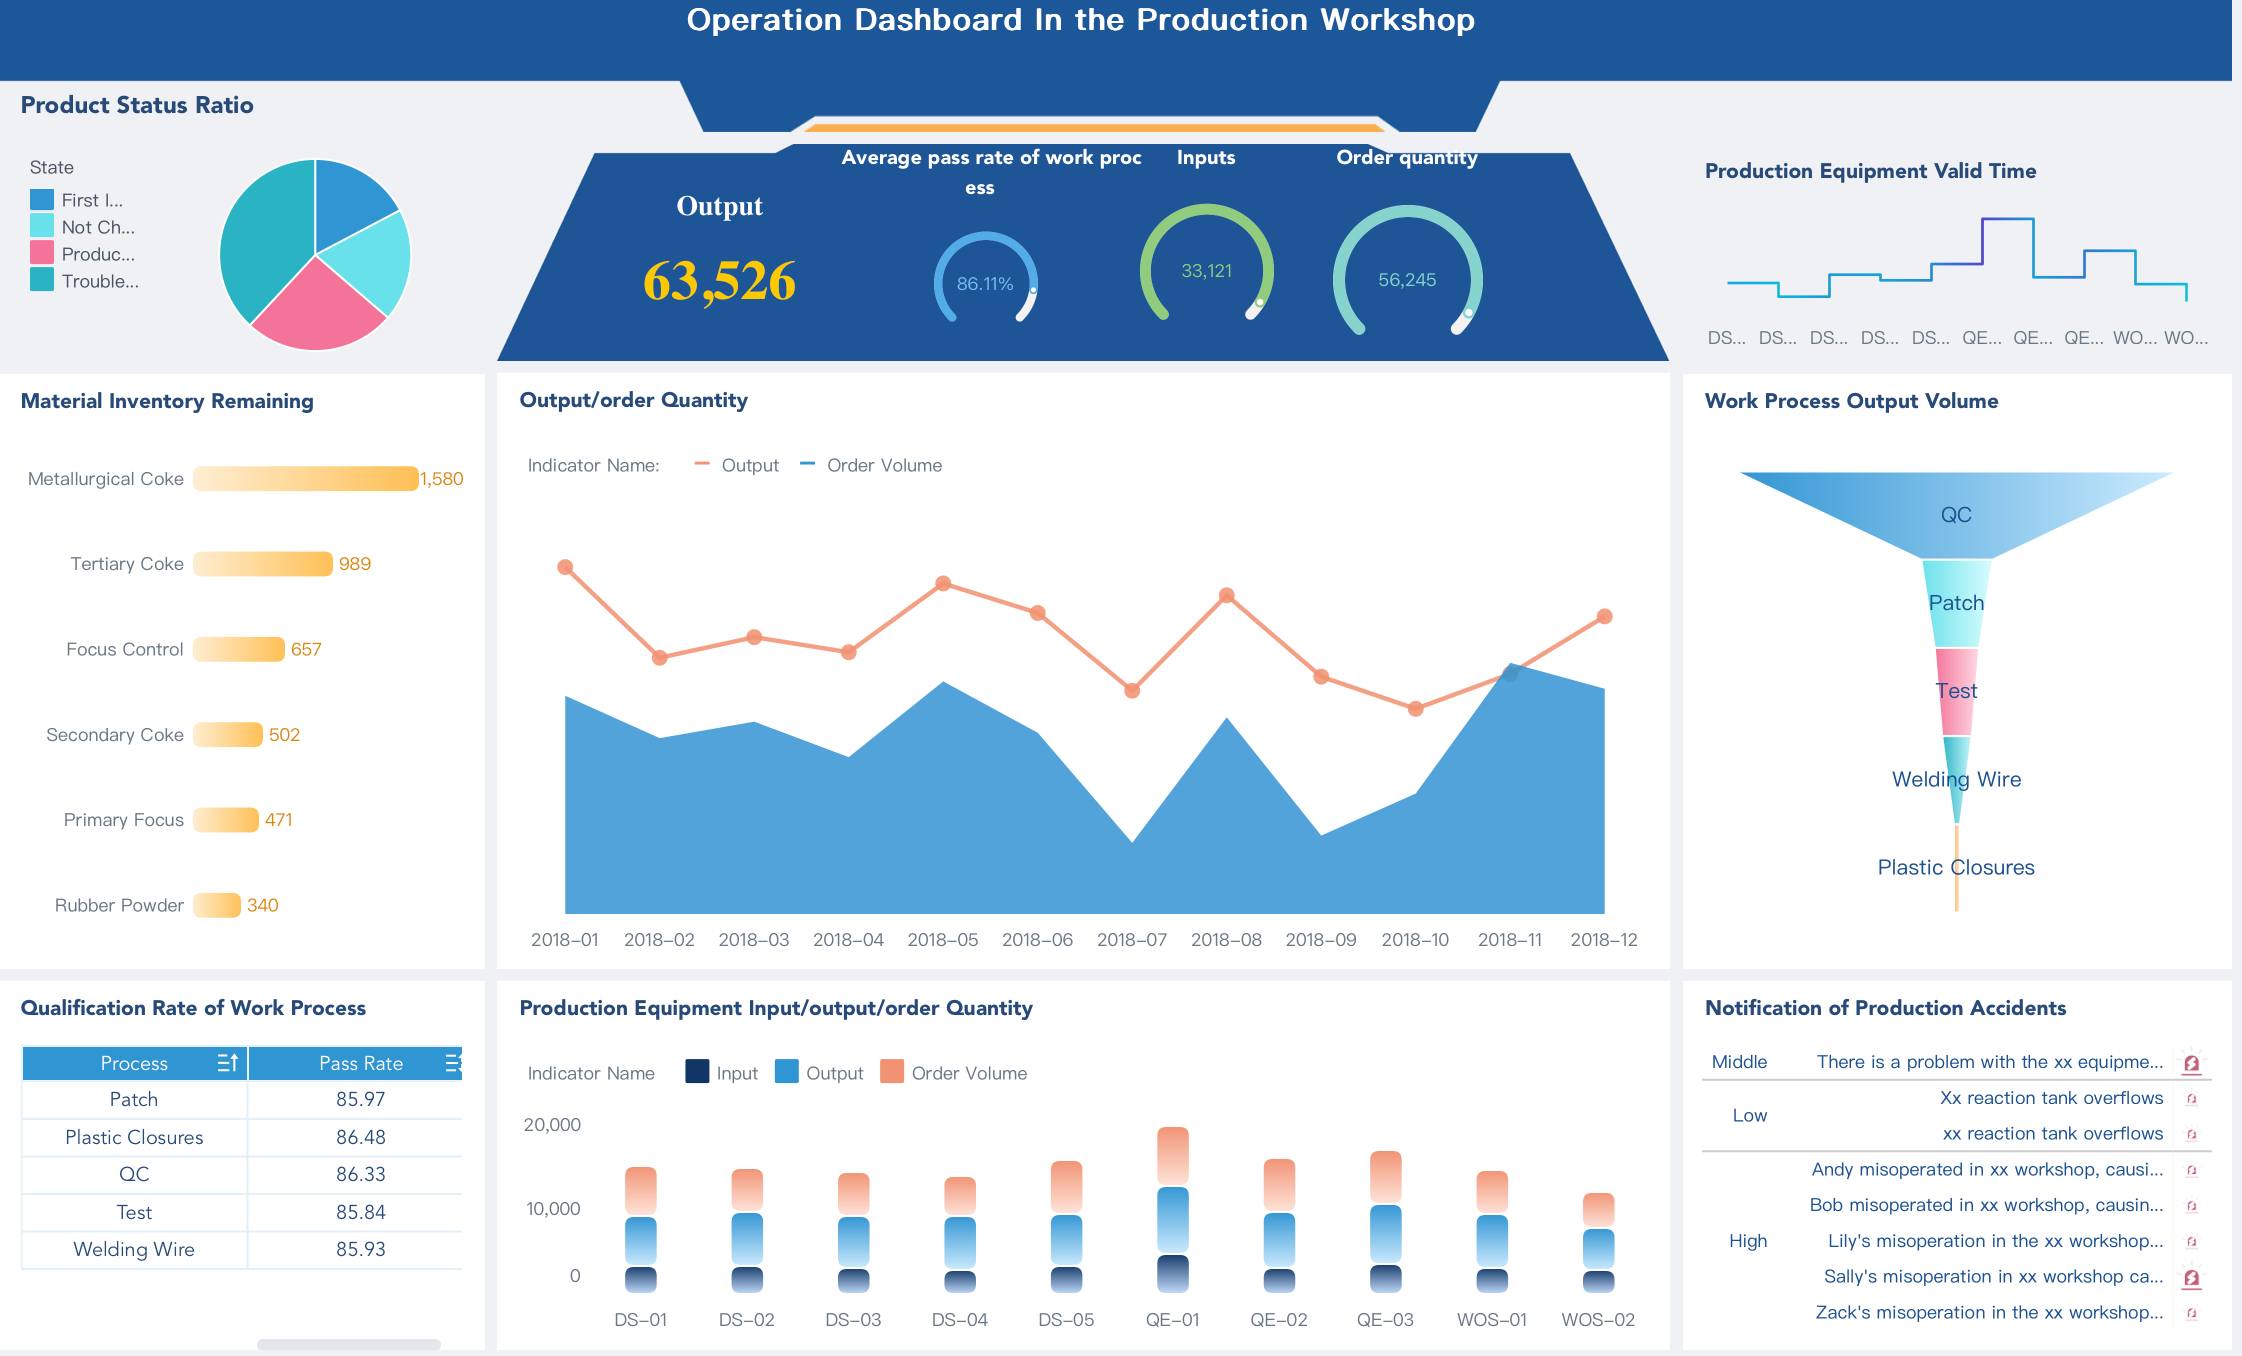
Operation Dashboard In the Production Workshop Created By FineBI
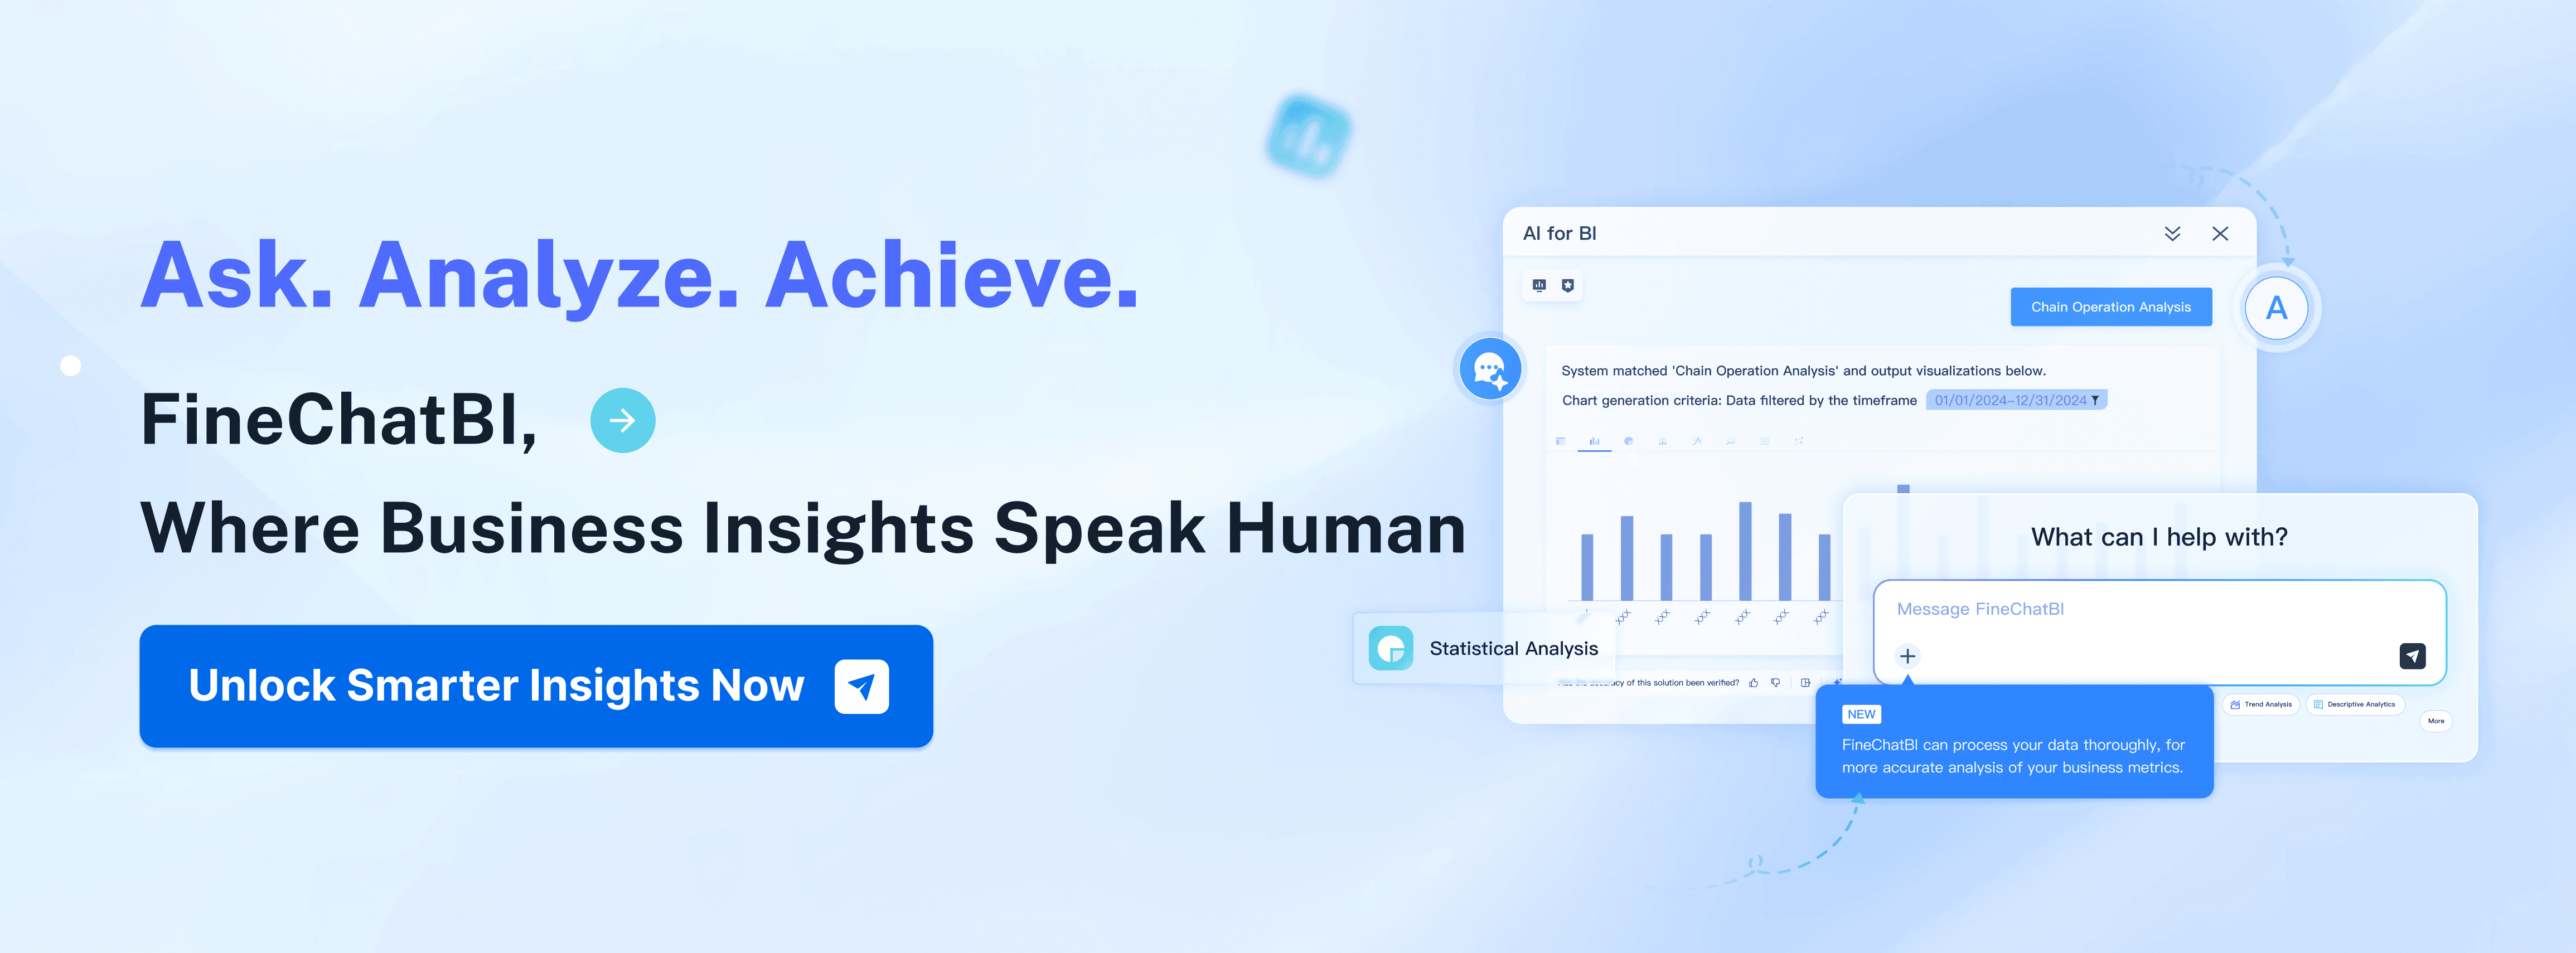
How FineChatBI enhances conversational BI
FineChatBI takes business intelligence to the next level by integrating advanced dialogue engines with robust BI capabilities. This conversational BI tool allows you to interact with your data using natural language queries. For example, you can ask, “What were last quarter’s sales trends?” and receive an instant, accurate response.
FineChatBI’s Text2DSL technology ensures precise query interpretation, converting your questions into a standard data query structure. This feature enhances trust and transparency, as you can verify the system’s understanding of your query. FineChatBI also combines rule-based and large models to handle both simple and complex queries, ensuring reliable results.
The tool’s ability to guide you through a complete analysis loop—from descriptive to prescriptive analysis—sets it apart. It doesn’t just answer your questions; it helps you understand the underlying factors and recommends actionable steps. FineChatBI’s focus on user-friendly interaction makes it an invaluable asset for organizations aiming to democratize data access.
Oracle Analytics Cloud (OAC) stands out for its robust data integration and management capabilities. It handles diverse data types from multiple sources, making it ideal for organizations with complex data environments. OAC’s advanced analytics features include predictive modeling and machine learning, enabling you to identify trends and automate decision-making processes.
The platform also excels in data visualization, offering interactive dashboards that provide real-time insights. Its user-friendly interface ensures you can explore data intuitively, even if you lack technical expertise. OAC’s scalability makes it suitable for businesses of all sizes, from startups to large enterprises.
Strengths and unique selling points
OAC’s ability to integrate and manage complex data sets gives it a significant edge. Its predictive analytics capabilities allow you to anticipate trends and make proactive decisions, enhancing your competitive advantage. The platform’s machine learning features automate routine tasks, freeing up your time for strategic initiatives.
While OAC offers powerful features, it may not match the user-friendliness of FineBI for self-service analytics. FineBI’s drag-and-drop interface and real-time data processing make it more accessible for non-technical users. Additionally, FineReport’s pixel-perfect reporting capabilities provide a level of detail that OAC’s visualization tools may not achieve. These distinctions highlight the unique strengths of FanRuan’s offerings.
Honorable Mentions
Amazon QuickSight
Amazon QuickSight is a cloud-based BI tool known for its scalability and affordability. It supports real-time analytics and integrates seamlessly with AWS services, making it a strong choice for businesses already using Amazon’s ecosystem.
SAP BusinessObjects
SAP BusinessObjects offers enterprise-level BI solutions with a focus on reporting and analytics. Its robust data integration capabilities and advanced reporting tools make it a reliable option for large organizations with complex data needs.
How to Evaluate and Choose the Right Business Intelligence Services
Assessing Your Business Needs
Identifying specific goals and challenges
Understanding your business goals and challenges is the first step in selecting the right business intelligence services. Start by defining what you aim to achieve. Are you looking to improve operational efficiency, enhance customer experiences, or gain a competitive edge? Tools like questionnaires, surveys, and focus groups can help you identify these needs. Questionnaires provide quick, surface-level insights, while surveys and focus groups offer deeper perspectives on customer experiences and organizational challenges.
For example, if your goal is to empower business users with self-service analytics, FineBI is an excellent choice. It allows users to independently explore data and create real-time dashboards, reducing reliance on IT teams. On the other hand, if your challenge involves creating detailed, structured reports for compliance or financial analysis, FineReport’s pixel-perfect reporting capabilities can address this need effectively.
Step
Description
1
Define the Business Case and Goals: Understand what you aim to accomplish.
2
Assess Technologies That Align With Business Needs: Identify required capabilities.
3
Include People and Define Processes: Ensure data quality and process clarity.
4
Evaluate and Select Technology Properly: Use criteria to match your needs.
Determining budget and resource availability
Budget and resources play a crucial role in your decision-making process. Evaluate how much you can invest in business intelligence consulting and tools. Consider both upfront costs and long-term benefits. FineBI and FineReport offer cost-effective solutions that deliver high ROI. FineBI enhances productivity by over 50%, while FineReport simplifies complex reporting tasks, saving time and resources. These benefits make them ideal for organizations seeking value without compromising on quality.
LCM Business Analysis Dashboard Created By FineReport
Comparing Providers Based on Key Criteria
Service offerings and customization options
When comparing providers, focus on their service offerings and customization options. Create a list of competitors and evaluate their strengths. For instance:
Identify Competitors: List 5-10 providers, including Tableau, Power BI, and Qlik Sense.
Define Your Parameters: Focus on elements like real-time analytics, data integration, and visualization capabilities.
Conduct Usability Testing: Compare how each provider meets your specific needs.
FineBI stands out for its user-friendly interface and robust data integration capabilities. It supports over 100 data sources, including big data platforms like Hadoop. FineReport complements this by offering advanced ETL features for data preprocessing. Together, they provide a comprehensive solution that adapts to your unique requirements.
Customer reviews and case studies
Customer reviews and case studies offer valuable insights into a provider’s performance. Look for examples of how their tools have solved real-world problems. For instance, FineBI has been successfully implemented in industries like manufacturing and finance, showcasing its versatility. Case studies highlight how organizations have used FineBI to streamline decision-making and improve operational efficiency. Similarly, FineReport’s ability to handle complex reporting tasks has made it a trusted choice for IT-driven projects.
Conducting Trials and Demos
Trials and demos are essential for evaluating a provider’s tools. They allow you to test features, assess usability, and determine if the solution aligns with your needs. A multifaceted approach, combining qualitative and quantitative methods, ensures comprehensive evaluation. Regularly monitor and adjust your strategy to stay aligned with your goals.
FineBI and FineReport offer free trials, enabling you to explore their capabilities firsthand. FineBI’s drag-and-drop interface simplifies data analysis, making it accessible even to non-technical users. FineReport’s dynamic reporting features allow you to create and update reports effortlessly. These trials provide a risk-free way to experience the benefits of these tools and make an informed decision.
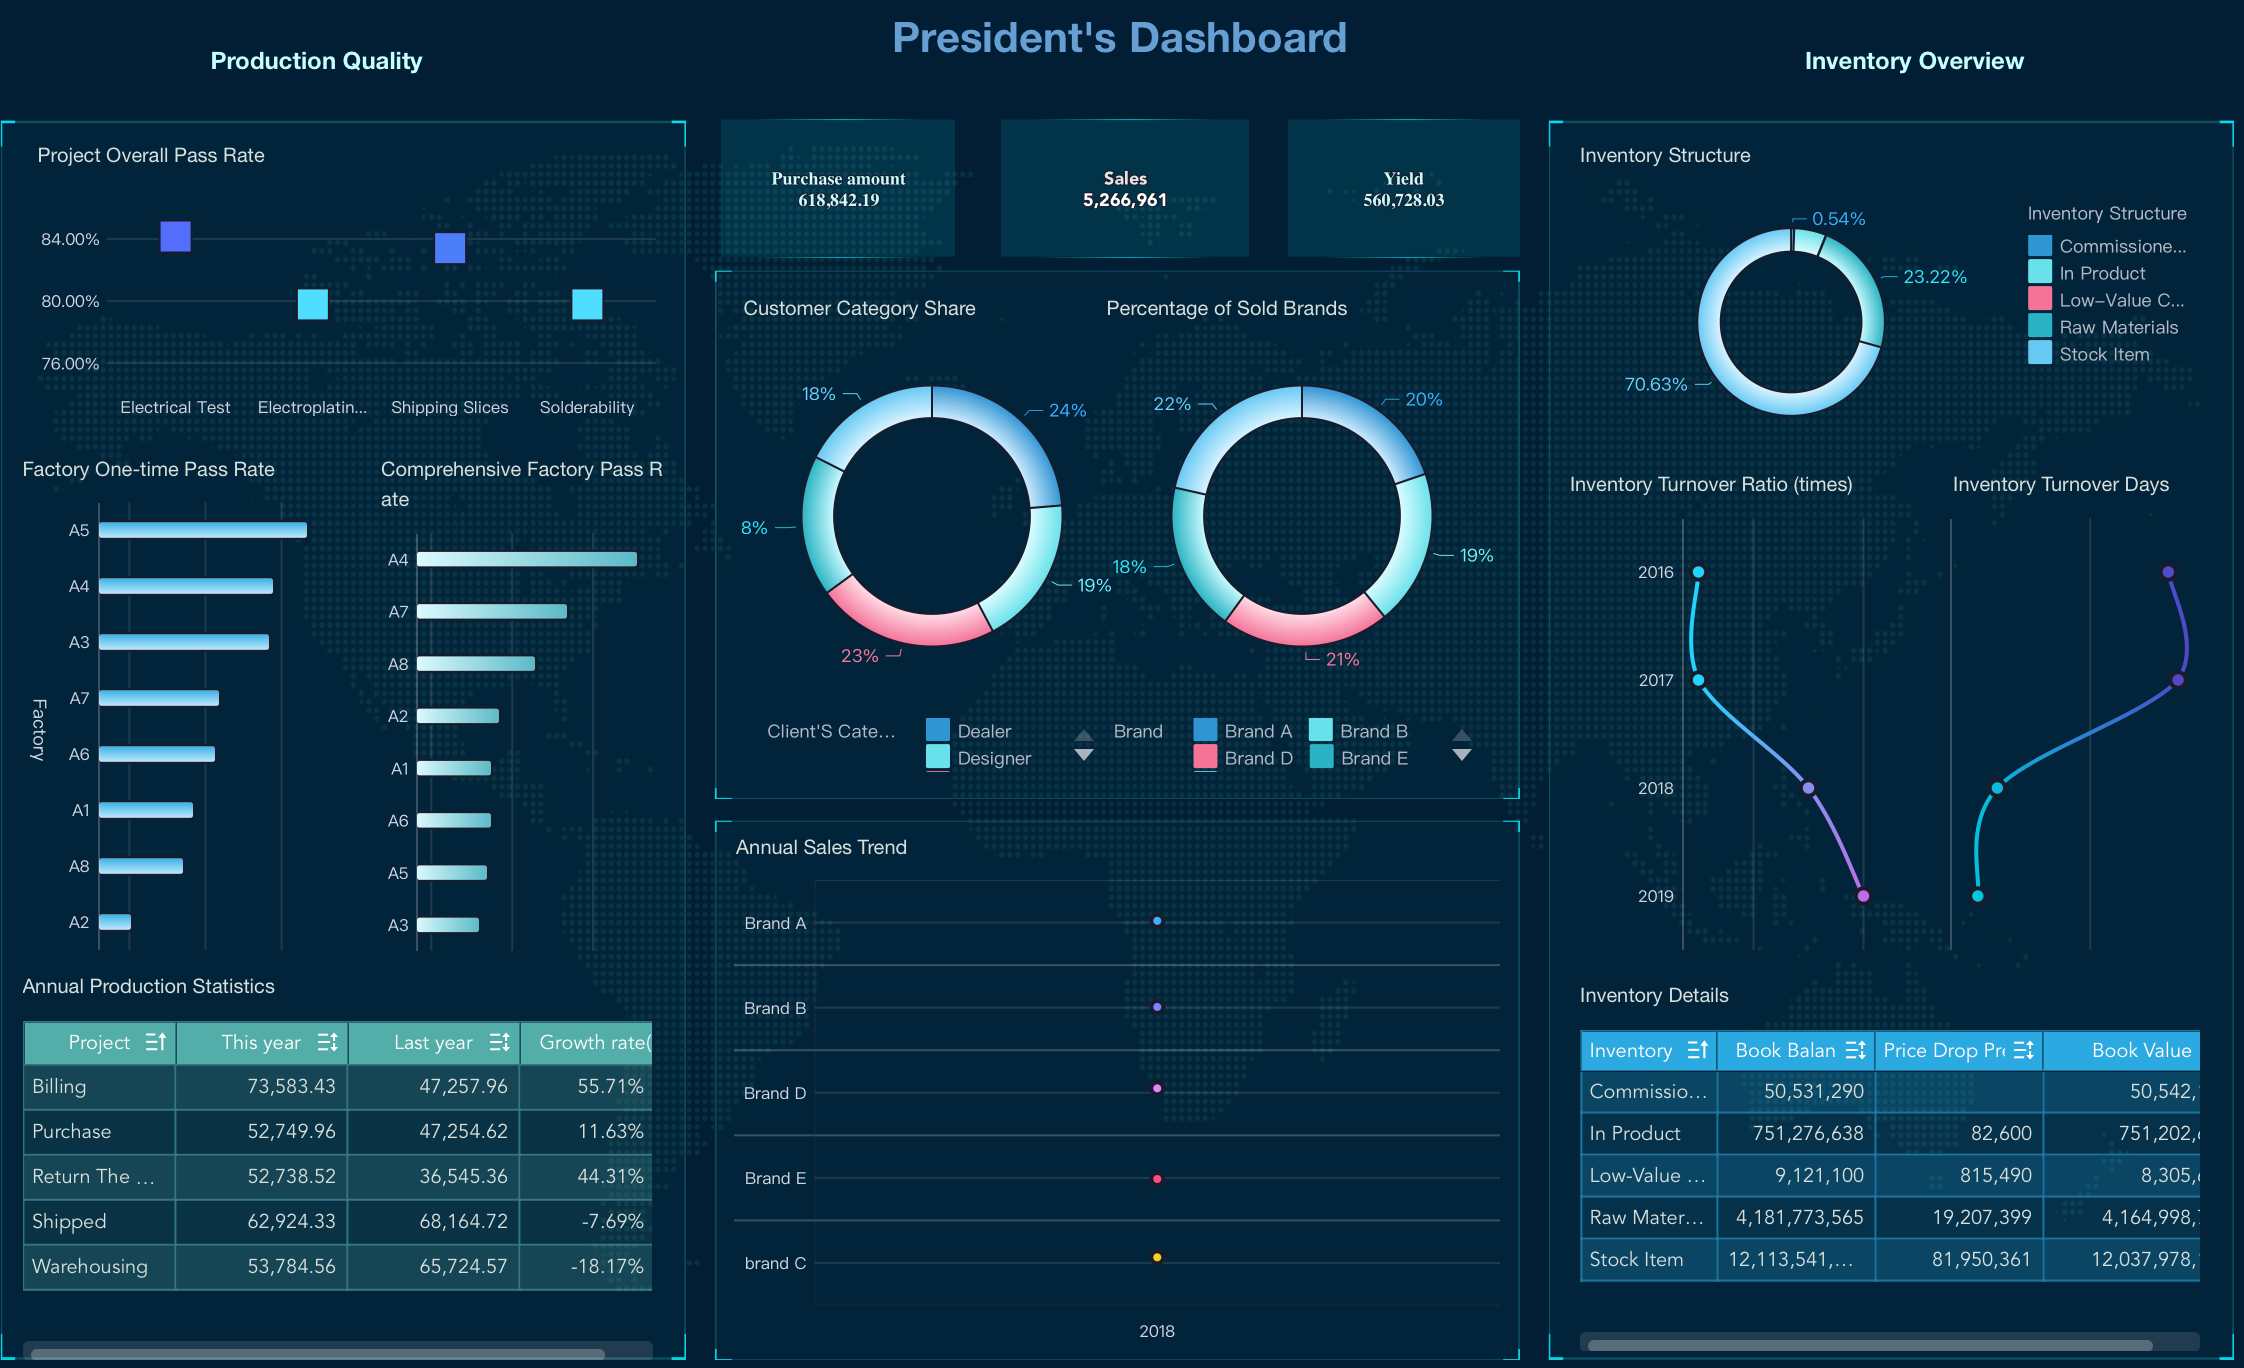
President's Dashboard Created By FineBI
Tip: During trials, focus on how well the tools integrate with your existing systems and whether they meet your scalability requirements. FineBI’s high-performance computing engine and FineReport’s robust ETL capabilities ensure seamless integration and scalability, making them reliable choices for growing businesses.
Building a Long-Term Partnership with Business Intelligence Vendors
Establishing a long-term partnership with a business intelligence (BI) vendor requires more than just selecting the right tools. It involves building trust, fostering collaboration, and ensuring mutual growth. By focusing on key strategies, you can create a partnership that delivers lasting value for your organization.
1. Delivering Consistent Value
A successful partnership thrives on trust. Vendors like FineBI and FineReport demonstrate this by consistently delivering high-quality results. FineBI empowers your team with self-service analytics, enabling faster decision-making and reducing reliance on IT. FineReport complements this by providing pixel-perfect reporting for detailed and accurate insights. Together, they ensure your organization achieves measurable outcomes, reinforcing the value of the partnership.
Tip: Regularly evaluate the performance of your BI tools. Look for improvements in decision-making speed, operational efficiency, and data accuracy. FineBI’s real-time dashboards and FineReport’s dynamic reporting capabilities make it easier to track these metrics.
2. Adapting to Changing Needs
Business conditions evolve, and your BI vendor must adapt to these changes. FineBI excels in scalability, handling massive datasets and supporting over 10,000 users for online viewing. This makes it ideal for growing businesses. FineReport’s robust ETL capabilities ensure seamless data integration, even as your data sources expand. These features allow both tools to grow with your organization, maintaining their relevance over time.
Sales Analysis Dashboard Created By FineBI
Callout: Adaptability is key to a strong partnership. Vendors who update their tools to meet your changing needs will help you stay competitive in a dynamic market.
3. Celebrating Shared Success
Acknowledging milestones strengthens your relationship with your BI vendor. Whether it’s achieving a significant ROI or completing a major project, celebrating these achievements fosters mutual respect. For example, organizations using FineBI often report a 50% improvement in data analysis efficiency. FineReport users benefit from streamlined reporting processes, saving time and resources. Highlighting these successes reinforces the value of the partnership.
Why FineBI and FineReport Stand Out
FineBI and FineReport offer unique advantages that make them ideal for long-term partnerships. FineBI’s user-friendly interface and real-time analytics empower business users to explore data independently. FineReport’s focus on structured reporting ensures IT teams can deliver high-quality outputs efficiently. Together, they provide a comprehensive solution that adapts to your needs, supports your growth, and celebrates your success.
By choosing vendors like FineBI and FineReport, you invest in tools that not only meet your current requirements but also evolve with your organization. This adaptability, combined with consistent value delivery and a focus on shared achievements, creates a foundation for a lasting and productive partnership.
Business intelligence services have become indispensable for organizations aiming to thrive in 2025. With 94% of enterprises rating BI and analytics as critical, the demand for actionable insights and data-driven strategies continues to grow. The top business intelligence vendors, including Tableau, Microsoft Power BI, and FanRuan’s FineBI and FineReport, offer unique strengths tailored to diverse business needs. FineBI empowers users with self-service analytics and real-time dashboards, while FineReport excels in creating pixel-perfect, structured reports for IT-driven tasks. Together, they provide a comprehensive solution unmatched in flexibility and efficiency.
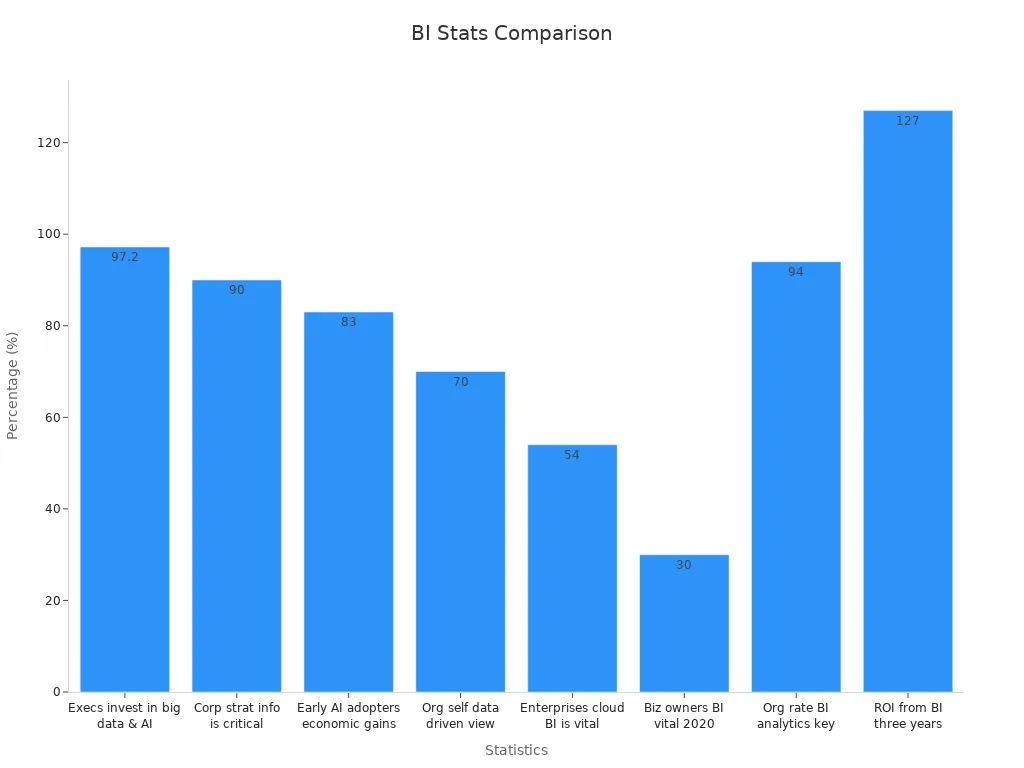
Did You Know? Data-driven organizations are 23 times more likely to acquire customers and achieve a 127% ROI from BI solutions within three years.
Statistic
Value
Executives investing in big data and AI
97.2%
Corporate strategies mentioning information as a critical asset
90%
Early AI adopters achieving economic benefits
83%
Organizations considering themselves data-driven
70%
Enterprises agreeing cloud-based BI is vital
54%
Choosing the right BI tools requires careful evaluation. Consider your goals, scalability needs, and the vendor’s track record. FineBI and FineReport stand out for their user-friendly interfaces, robust data integration, and ability to deliver measurable outcomes. By partnering with the right provider, you can unlock the full potential of your data and drive your business forward.
Click the banner below to experience FineReport for free and empower your enterprise to convert data into productivity!
Access a wealth of case studies, industry insights, and solution guides to accelerate digital transformation.
FAQ
What is the difference between FineBI and FineReport?
FineBI focuses on self-service analytics, empowering business users to explore data independently. FineReport specializes in IT-driven reporting, offering pixel-perfect, structured reports. Together, they provide a comprehensive solution for both dynamic analysis and detailed reporting.
Can FineBI handle large datasets?
Yes, FineBI’s high-performance computing engine processes massive datasets efficiently. It supports over 10,000 users for online viewing, making it ideal for enterprises with growing data needs.
Does FineReport support real-time data updates?
Yes, FineReport offers dynamic reporting capabilities. Reports update automatically when new data becomes available, ensuring you always have the latest insights.
How does FineBI compare to Tableau?
FineBI offers a more balanced approach with self-service analytics and robust data integration. Tableau excels in visualization but may require additional tools for data analysis. FineBI’s drag-and-drop interface and real-time insights make it more accessible for non-technical users.
Is FineBI suitable for small businesses?
Yes, FineBI’s user-friendly interface and cost-effective pricing make it suitable for small businesses. It simplifies data analysis, reducing reliance on IT teams and enabling faster decision-making.
What industries benefit most from FineBI and FineReport?
FineBI and FineReport cater to diverse industries, including manufacturing, finance, retail, and healthcare. FineBI supports real-time analytics for operational efficiency, while FineReport ensures compliance with detailed reporting.
Can FineBI and FineReport integrate with existing systems?
Yes, both tools support integration with over 100 data sources, including big data platforms like Hadoop and relational databases like MySQL. This flexibility ensures seamless compatibility with your existing systems.
How does FineChatBI enhance business intelligence?
FineChatBI uses natural language processing to answer your data queries conversationally. It combines rule-based and large models for precise results, guiding you from descriptive to prescriptive analysis.