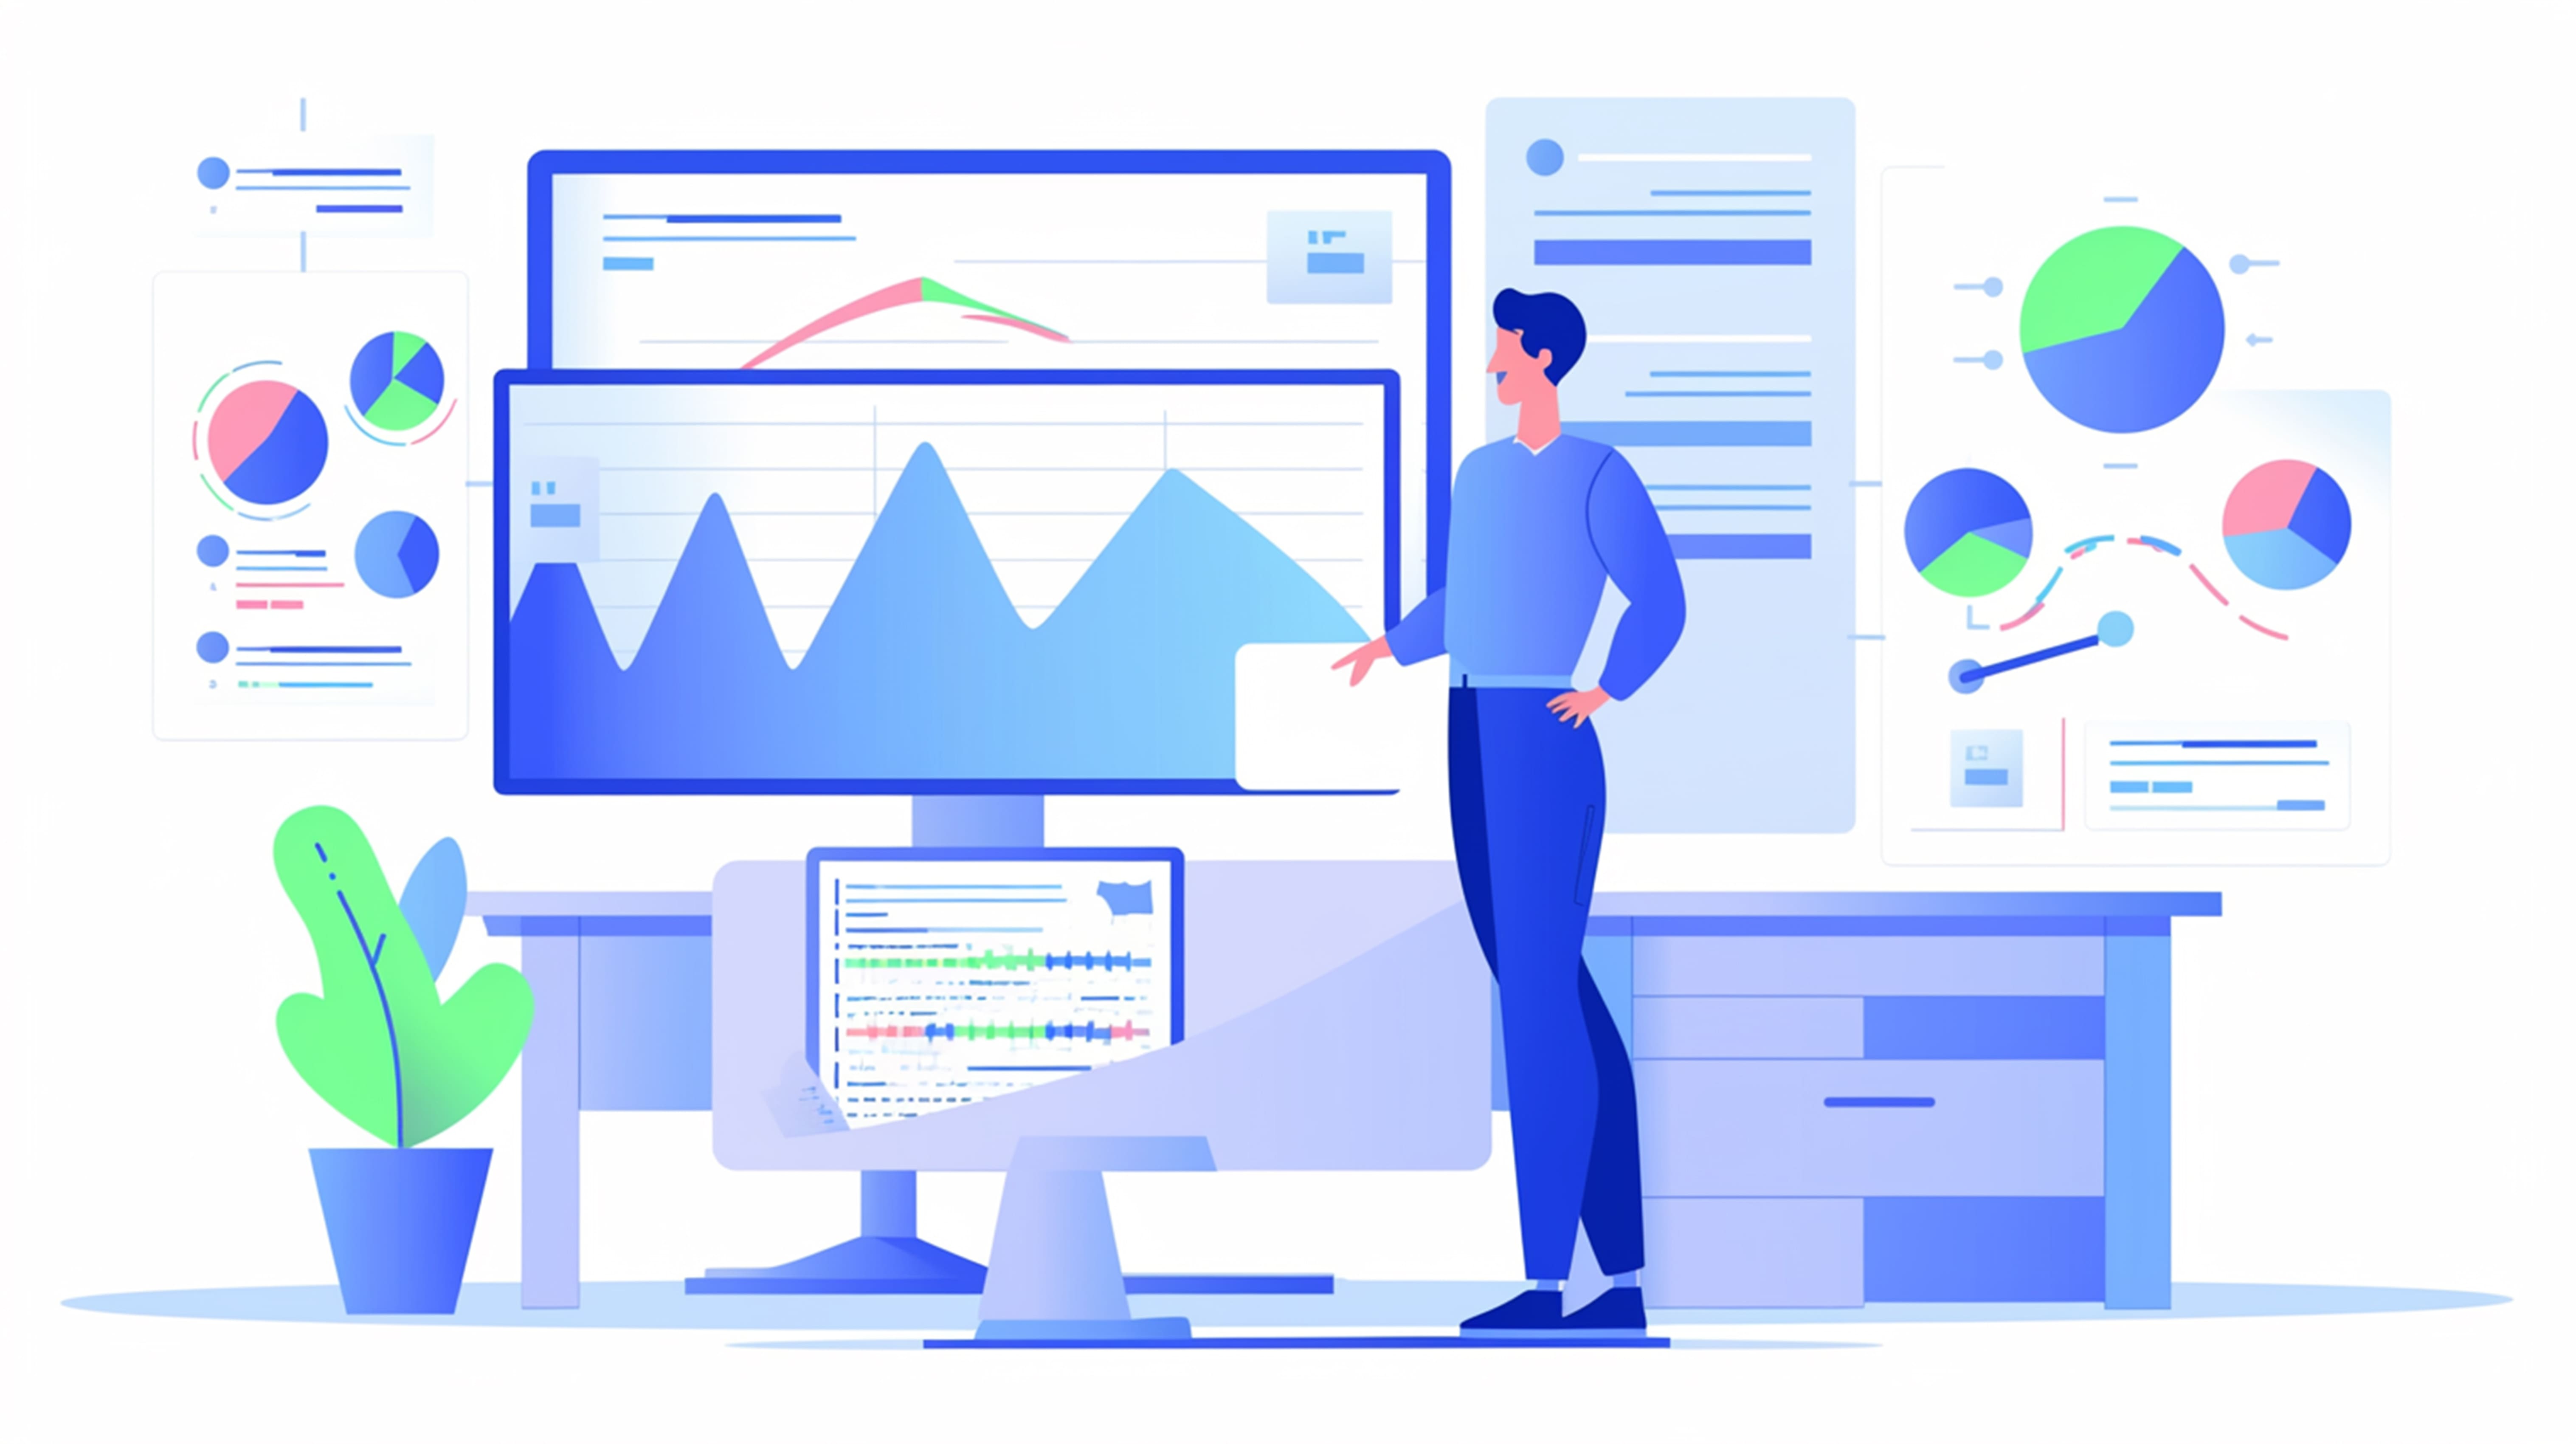
In today’s fast-paced business environment, staying ahead requires you to make decisions based on facts, not guesses. Data reporting tools empower you to do just that by transforming raw data into actionable insights. These tools aggregate information from multiple sources, offering real-time dashboards and reports that help you monitor key performance indicators (KPIs) and identify trends.
Here are 11 data reporting tools that help you save time, reduce errors, and collaborate seamlessly across teams:
FineReport
Microsoft Power BI
Tableau
Looker
Qlik Sense
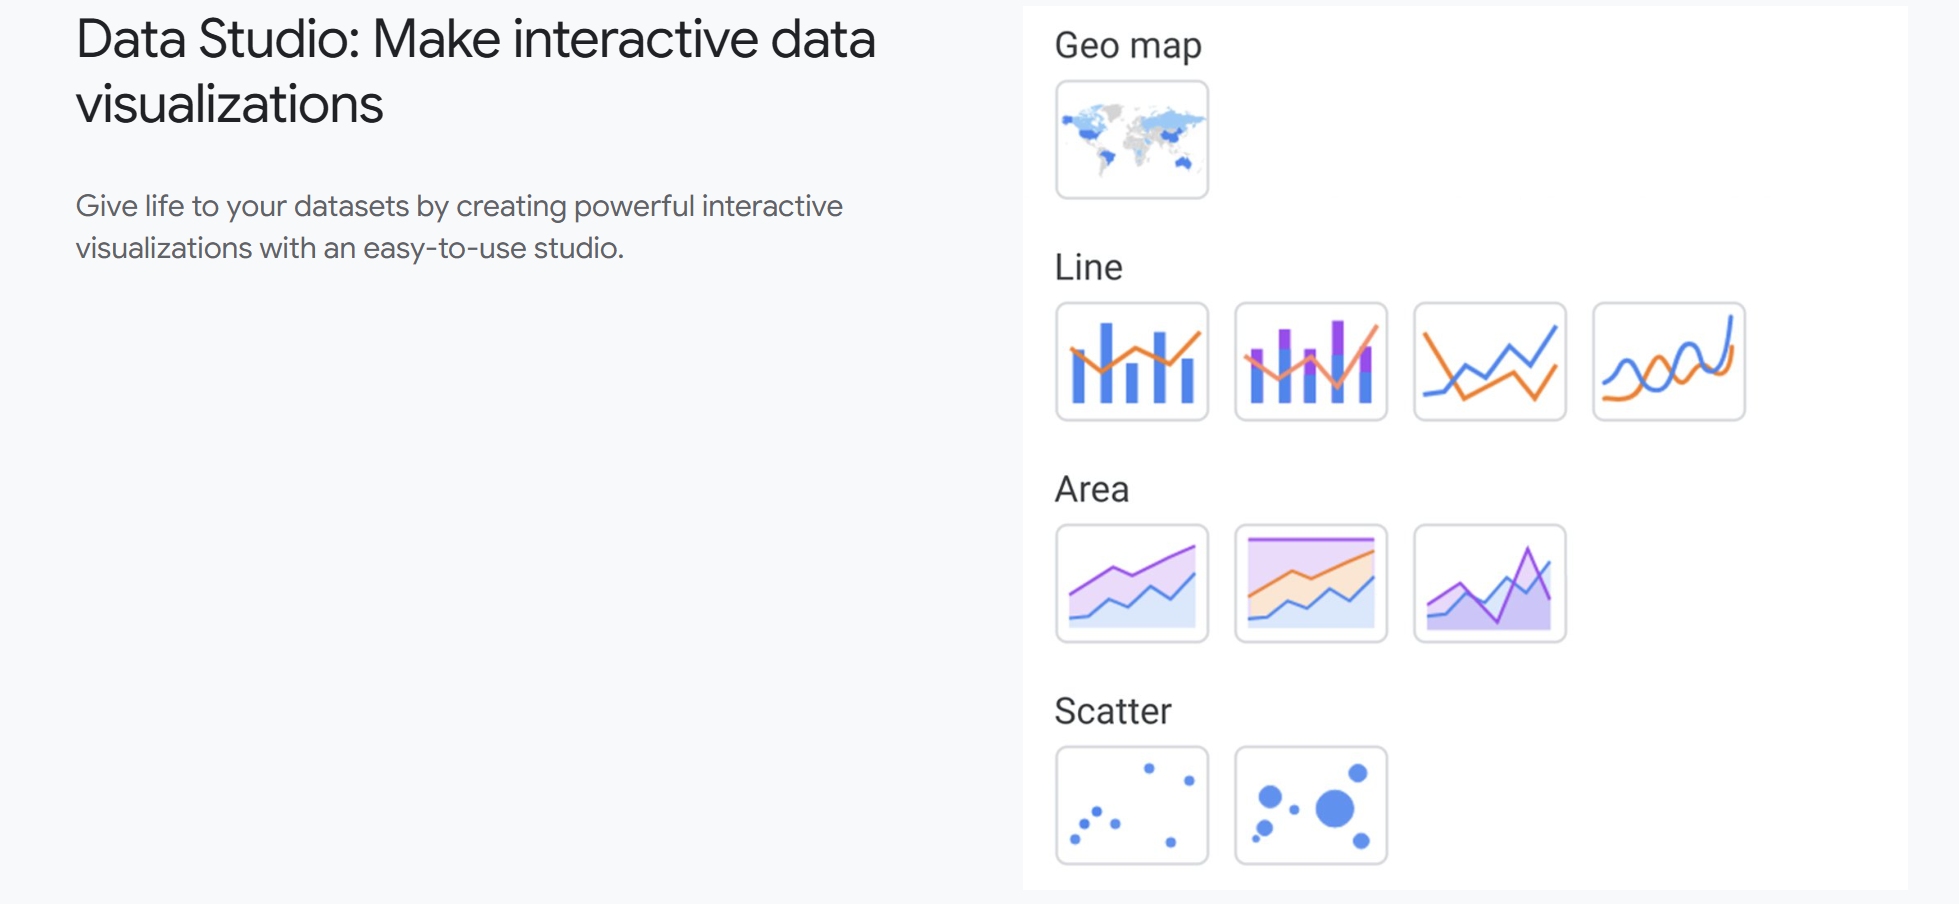
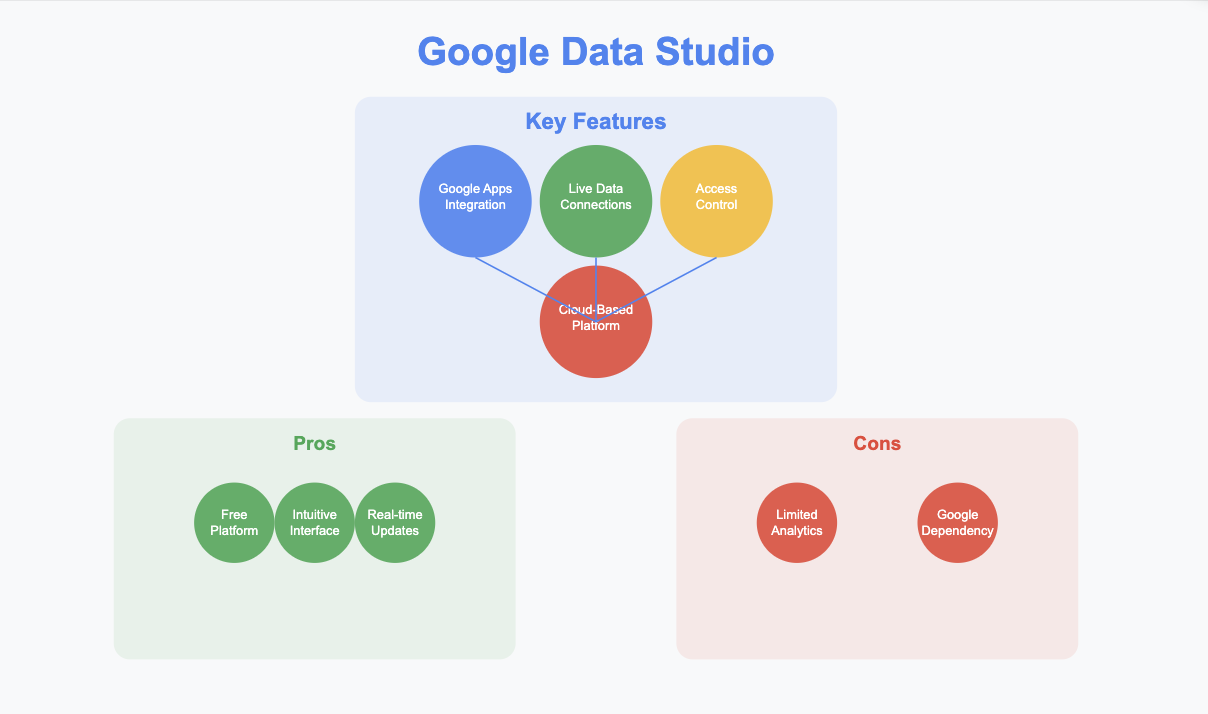
Google Data Studio
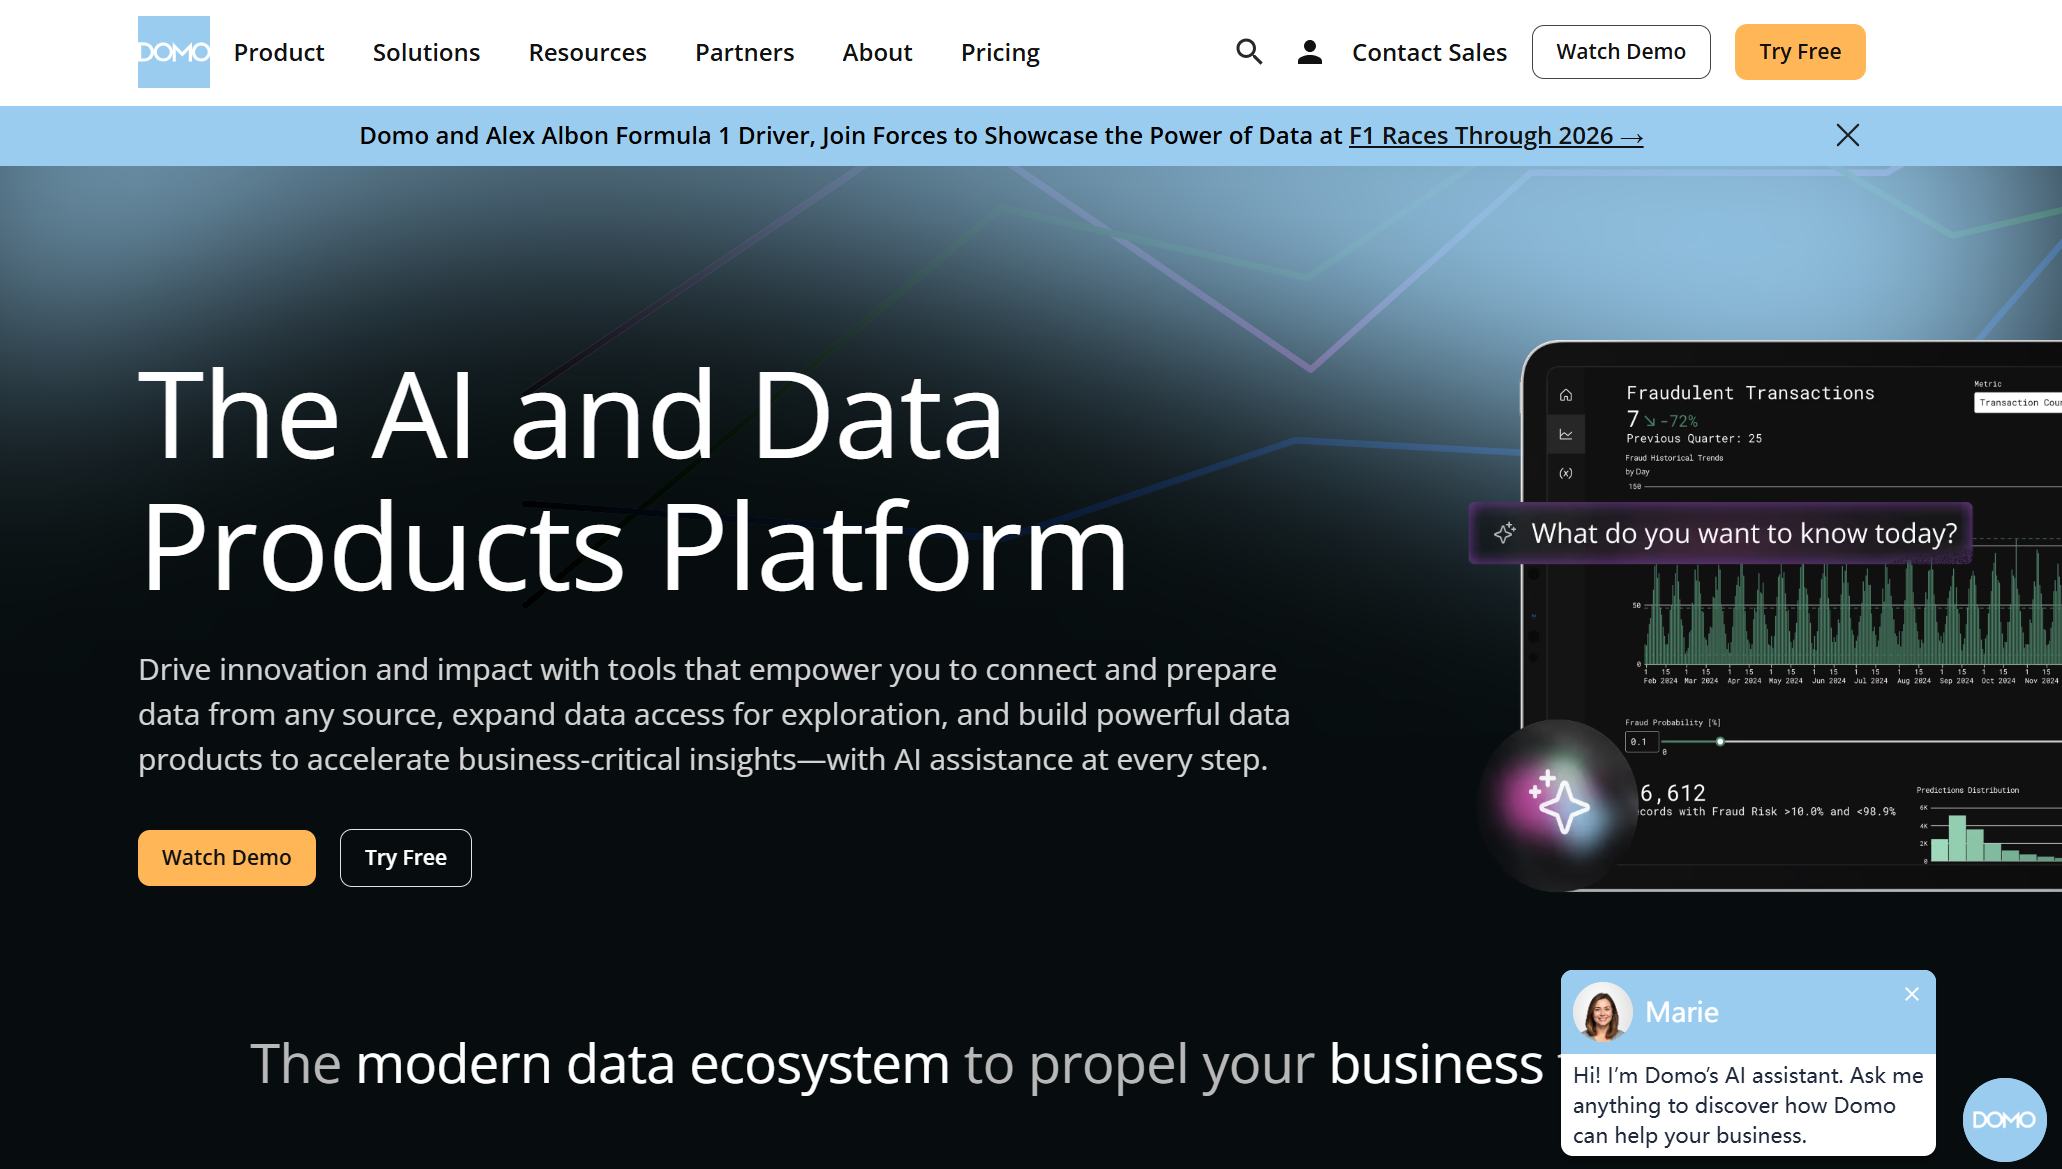
Domo
Sisense
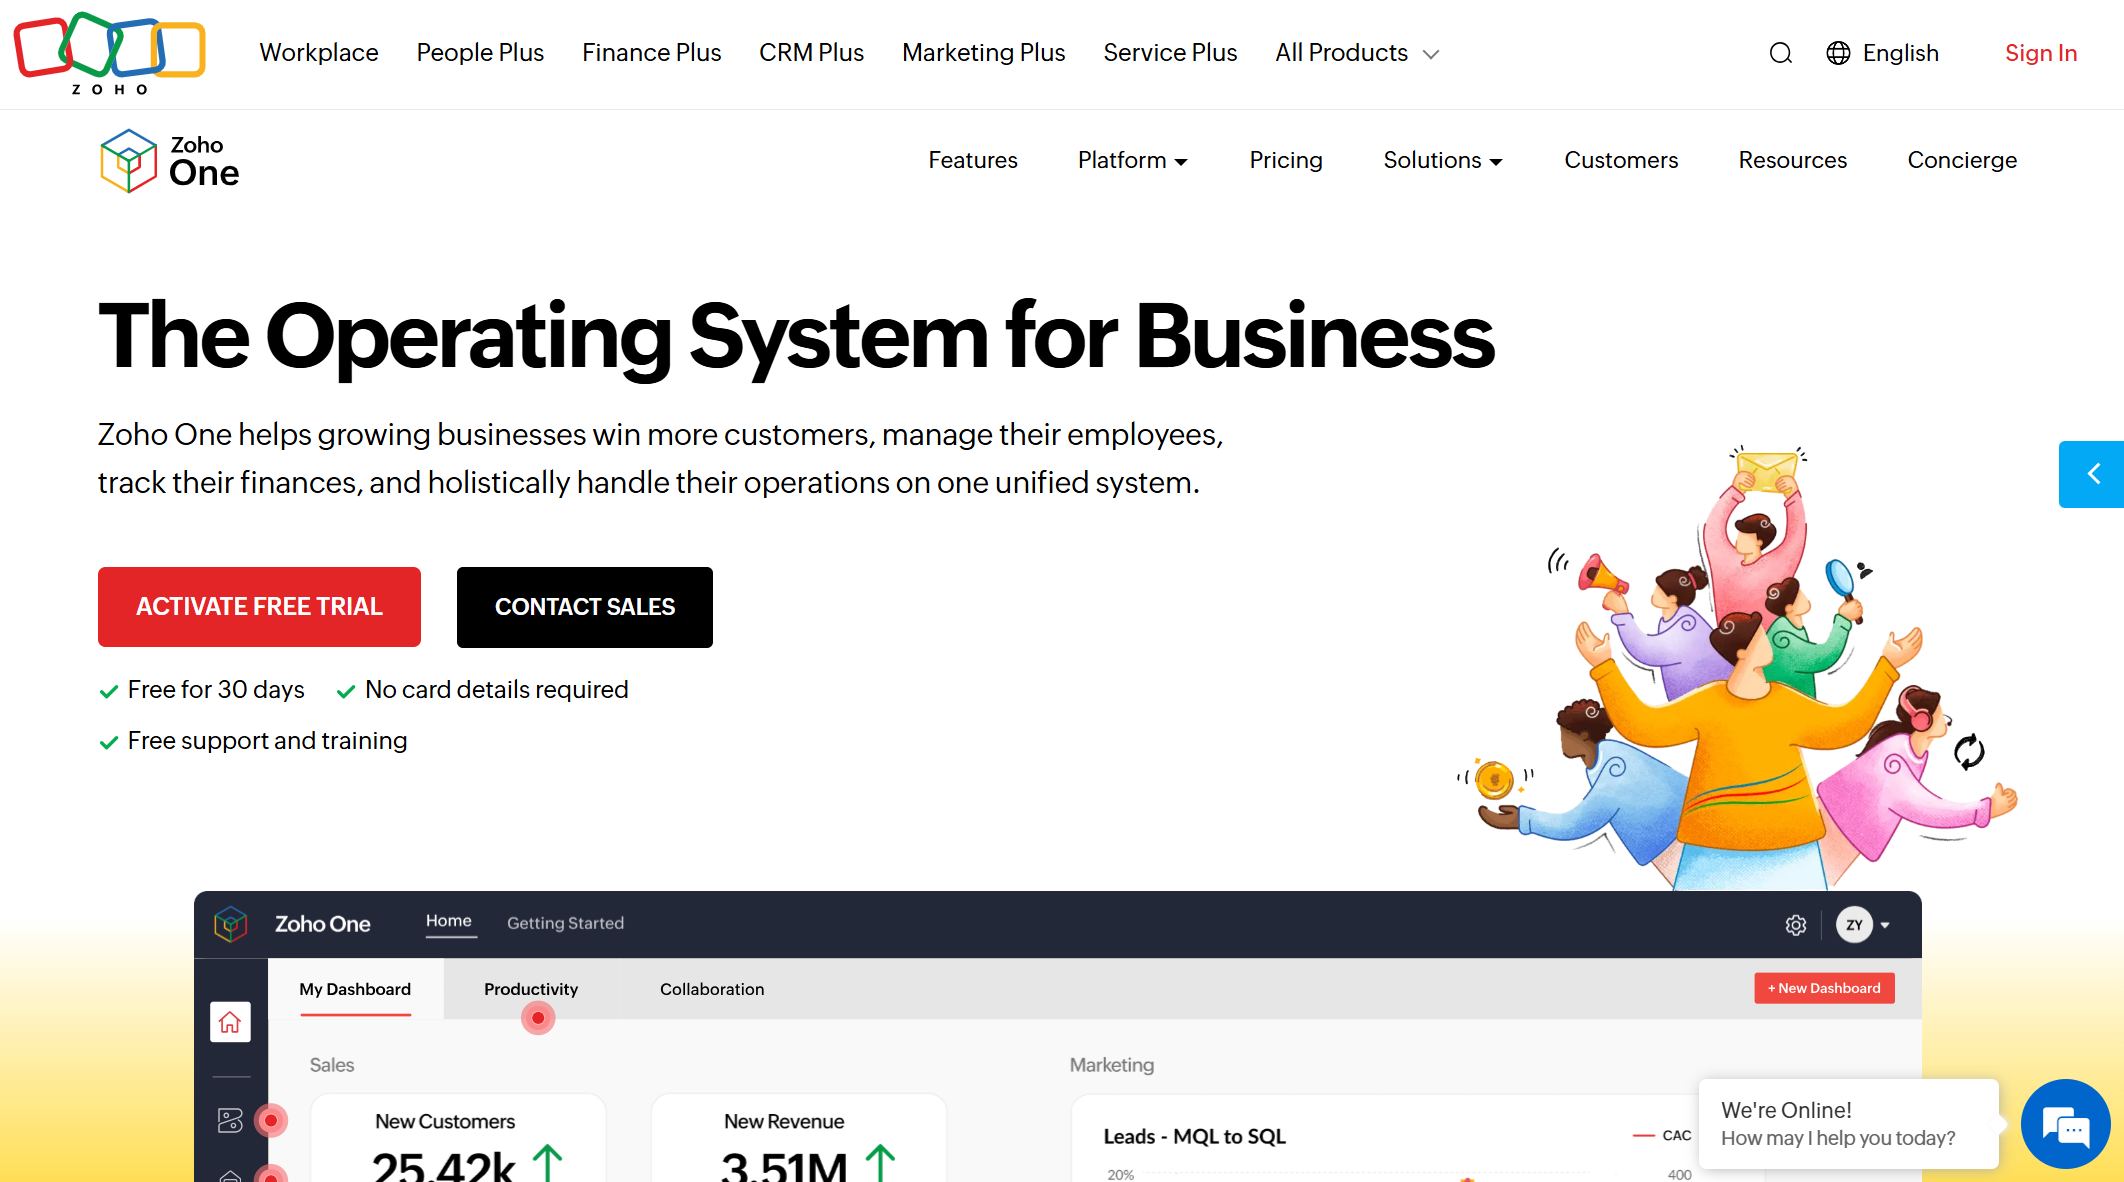
Zoho Analytics
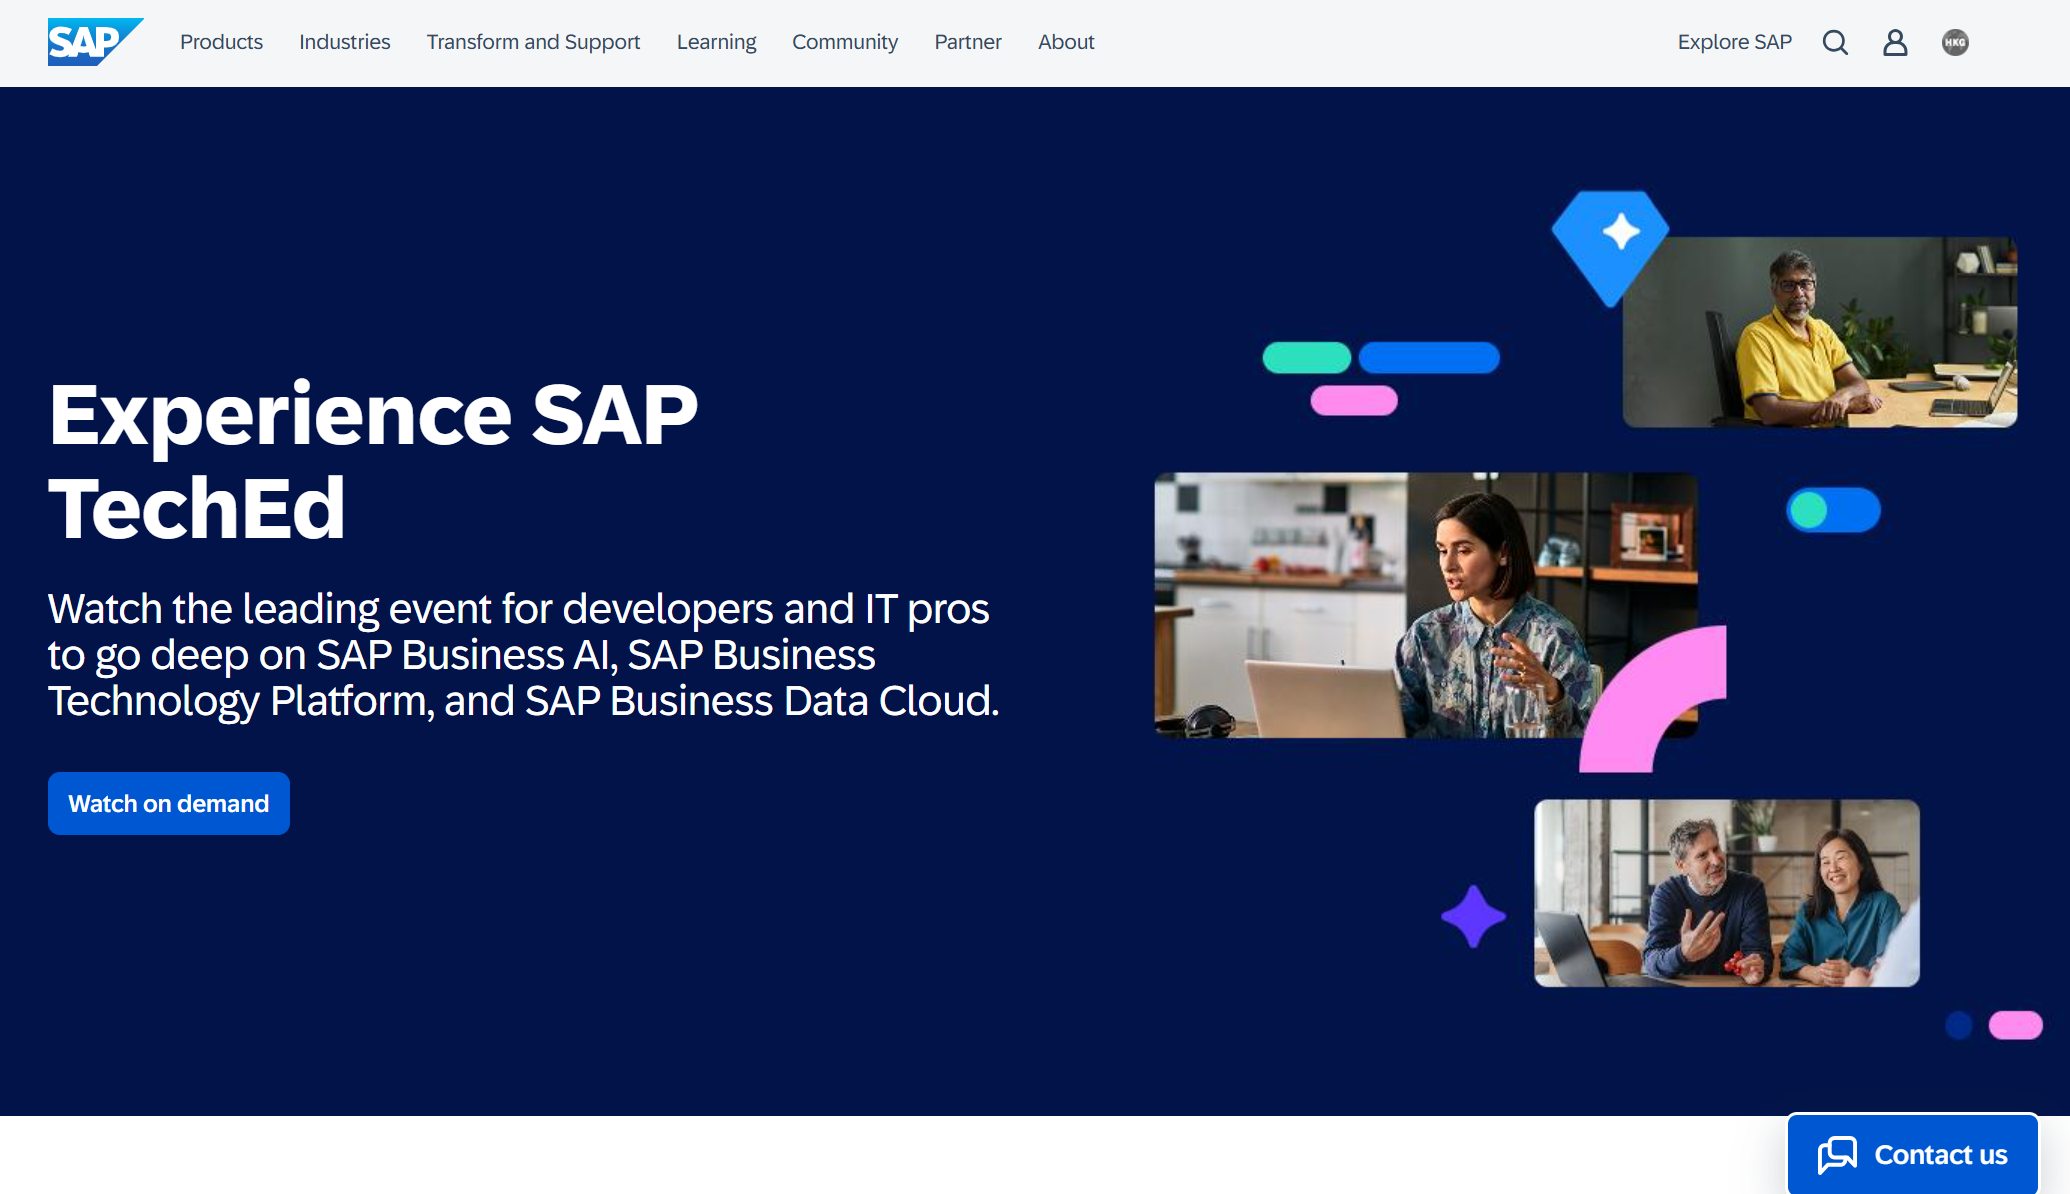
SAP Analytics Cloud
IBM Cognos Analytics
The future of business intelligence is evolving rapidly. Trends like augmented analytics and self-service BI are reshaping how you interact with data. By integrating artificial intelligence, these tools simplify complex analyses, enabling you to make faster, smarter decisions. As competition intensifies, leveraging high-quality data and collaborative platforms will give your business the edge it needs to thrive.
Understanding Data Reporting Tools
What Are Data Reporting Tools?
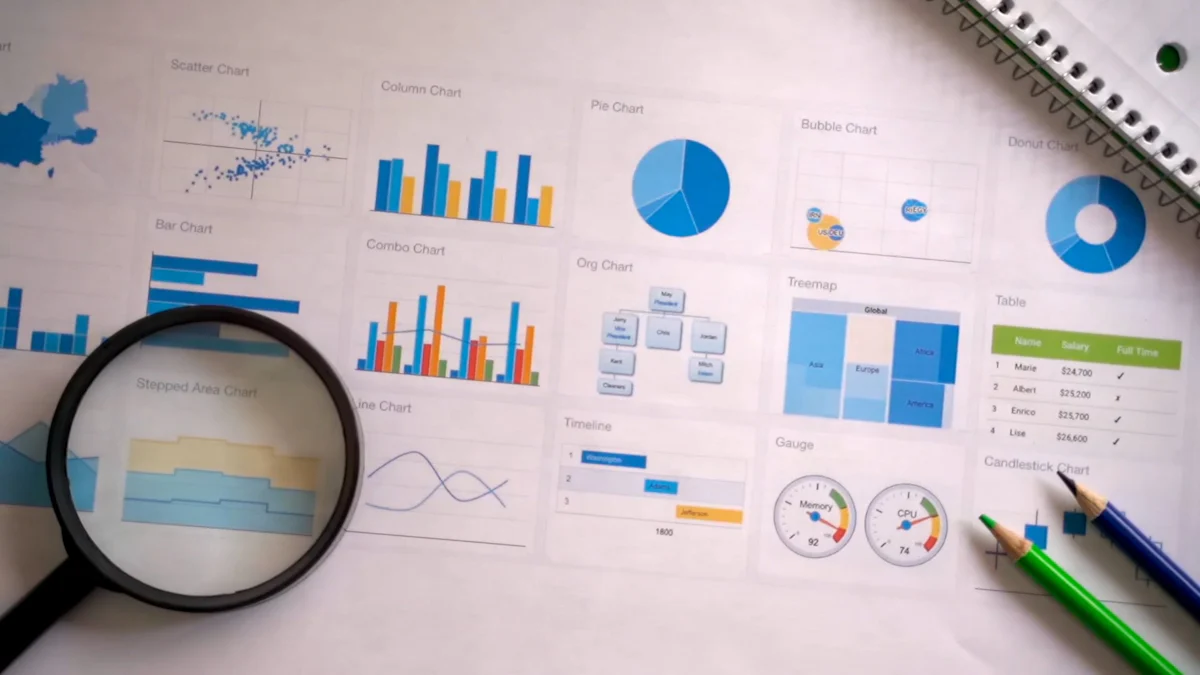
Data reporting tools are software solutions that help you transform raw data into meaningful insights. These tools allow you to create visualizations, generate real-time reports, and monitor performance metrics through interactive dashboards.
By using them, you can explore data dynamically, uncover trends, and make informed decisions. They also enable ad-hoc queries, letting you dive deeper into specific areas of interest without relying on technical teams. A retail giant reduced reporting errors by 30% after adopting Tableau’s self-service analytics. Their operations team now generates real-time inventory dashboards without IT assistance, cutting decision-making time by 50%. Whether you're analyzing sales figures or tracking operational efficiency, these tools simplify complex data analytics processes.
Why Are Data Reporting Tools Essential for Business Intelligence?
In today's competitive landscape, business intelligence tools are no longer optional—they're essential. As noted by Bernard Marr, a leading expert in business analytics, 'Business intelligence tools have become indispensable in the modern data-driven enterprise, allowing organizations to leverage their data for competitive advantage.
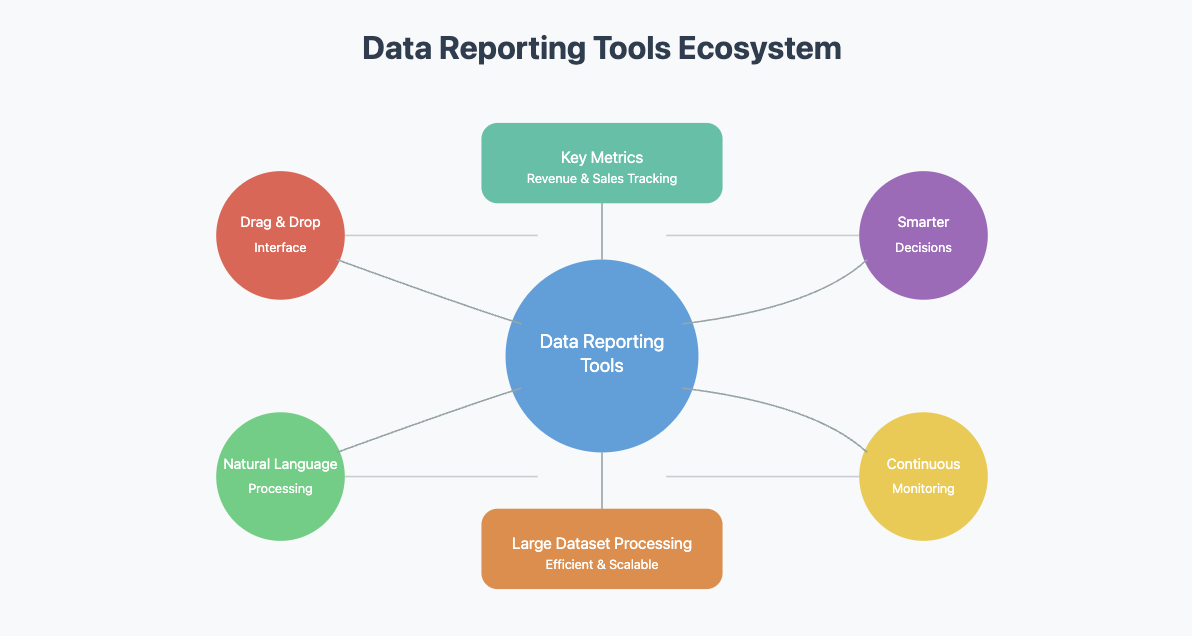
Data reporting tools empower you to identify key metrics like revenue and sales, which are critical for shaping your strategies. Many of these tools offer intuitive drag-and-drop interfaces, making it easy for anyone to create reports and dashboards. Advanced features like Natural Language Processing (NLP) let you query data using everyday language, making self-service data analytics accessible to all. Unlike traditional methods, these tools handle large datasets effortlessly, improving productivity and decision-making. They also support continuous monitoring, ensuring your business intelligence platform evolves with changing conditions.
You can make smarter decisions by analyzing data insights.
Adjustments to your reporting tools ensure relevance as new data emerges.
Key Benefits of Using Reporting Tools
Using reporting tools offers several advantages that directly impact your business's success. First, they save time by automating data collection and report generation. Second, they reduce errors, ensuring your decisions are based on accurate information. Third, they provide advanced data visualizations, making complex data easier to understand. With customizable dashboards, you can tailor reports to meet your unique needs. These tools also facilitate collaboration by enabling teams to share real-time analytics and actionable insights seamlessly. By leveraging dynamic reporting tools, you can stay agile and adapt quickly to market changes.
Tip: Choose reporting tools that integrate well with your existing systems to maximize efficiency and ROI.
Factors to Consider When Choosing the Best Data Reporting Tools
Ease of Use and User Interface
The ease of use of a reporting tool plays a critical role in its adoption within an organization. A 2025 survey by the International Data Corporation (IDC) found that 78% of businesses prioritize intuitive interfaces, making usability a key factor in the decision-making process. A tool that is easy to navigate allows your team to quickly get up to speed, minimizing frustration and ensuring smooth usage. Research highlights that usability issues contribute to 70% of software project failures, and 65% of users stop using tools after a frustrating experience. By focusing on user-friendly design, organizations can enhance both user satisfaction and overall productivity.
Statistic
Implication
70% of software projects fail due to usability issues
Highlights the critical role of usability in successful tool integration.
65% of users stop using a tool after one frustrating experience
Emphasizes the importance of intuitive design for user retention.
$1 invested in usability yields up to $100 return
Demonstrates the economic benefits of prioritizing usability in tool adoption.
When evaluating tools, look for features like drag-and-drop functionality, clear navigation, and customizable dashboards. A survey by Forrester (2025) revealed that 78% of businesses prioritize tools with pre-built connectors. For example, FineReport’s seamless integration with SAP and Salesforce has been praised by enterprises for reducing data silos. These elements simplify workflows and reduce the learning curve for your team. By choosing a user-friendly tool, you empower your employees to focus on insights rather than struggling with the software.
Integration with Existing Systems
Your reporting tool should seamlessly connect with your current systems to maximize efficiency. Integration ensures that data flows smoothly between platforms, eliminating the need for manual data entry. This saves time and reduces errors. Whether you use CRM software, ERP systems, or cloud storage, the right tool should support these integrations effortlessly.
Tip: Before selecting a tool, list all the systems your business relies on. Ensure the reporting tool you choose supports these integrations to avoid compatibility issues.
Additionally, integrated tools enable real-time data updates, keeping your reports accurate and up-to-date. This capability is crucial for making timely decisions in fast-paced business environments.
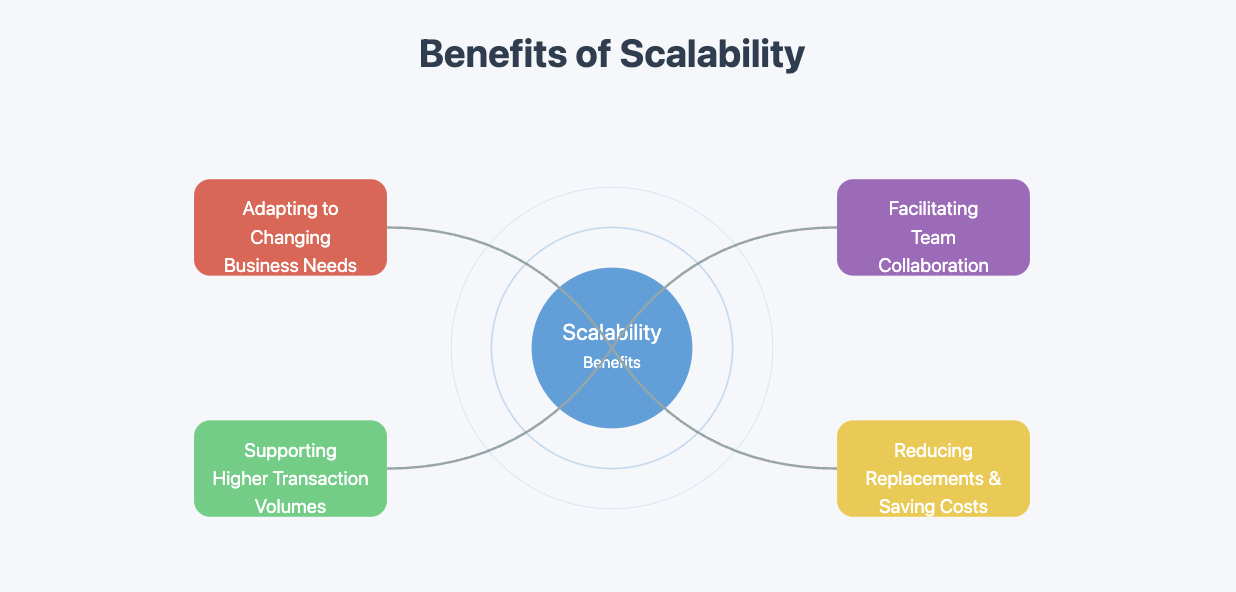
Scalability for Growing Businesses
As your business grows, your reporting needs will evolve. A scalable tool adapts to these changes without compromising performance. Scalable solutions handle increased transaction volumes, support multiple users, and accommodate new locations. They also streamline system upgrades, minimizing disruptions during updates.
Benefits of scalability include:
Adapting to changing business needs.
Supporting higher transaction volumes.
Facilitating collaboration across teams and locations.
Reducing the need for frequent replacements, saving costs.
Investing in a scalable tool future-proofs your business intelligence systems. It ensures your reporting capabilities remain relevant as your organization expands, giving you a competitive edge in the market.
Investing in a cost-effective tool doesn’t mean choosing the cheapest option. Instead, focus on tools that offer long-term value. A well-chosen reporting tool can streamline processes, reduce errors, and save time, all of which contribute to a stronger bottom line.
💡 Tip: Compare the upfront cost with the potential savings and revenue growth to make an informed decision.
Customization and Flexibility
Every business has unique needs, and a one-size-fits-all solution rarely works. Customization ensures your reporting tool adapts to your specific requirements, making it more effective and user-friendly. Flexible tools allow you to tailor dashboards, reports, and workflows to match your business processes.
Evidence
Explanation
Customization options are crucial factors to consider when selecting a reporting tool.
This highlights the importance of customization in enhancing usability for specific business needs.
The ability to customize the tool to meet specific needs is important to ensure maximum utility.
This supports the idea that tailored tools improve data access and analysis.
With customizable tools, you can focus on the metrics that matter most to your business. For example, you might prioritize sales performance, customer retention, or operational efficiency. Flexible tools also grow with your business, allowing you to add new features or integrations as needed.
🔧 Note: A tool with robust customization options ensures you can adapt to changing market demands without switching platforms.
By choosing a reporting tool that offers both customization and flexibility, you empower your team to work smarter, not harder. Tailored solutions make data more accessible, actionable, and aligned with your goals.
Top 11 Data Reporting Tools for Business Intelligence in 2026
FineReport is a comprehensive reporting tool that specializes in creating professional reports and interactive dashboards. It supports a wide range of data sources and allows seamless integration with databases, Excel files, and cloud platforms. The platform is known for its report customization capabilities and user-friendly design features. Additionally, FineReport provides powerful data visualization and real-time data analytics for decision-making.
Pros
Highly customizable reports and dashboards to meet specific needs.
User-friendly interface that simplifies report creation.
Robust integration with various data sources and platforms.
Real-time data analytics and reporting, making it ideal for dynamic business environments.
Microsoft Power BI stands out as one of the best reporting tools for its robust features:
Feature
Description
Artificial intelligence
Leverage AI for image recognition, text analytics, and machine learning models. Natural language processing enhances data interaction.
Hybrid deployment support
Connect seamlessly with various data sources, including Microsoft and Salesforce, using built-in connectors.
Quick Insights
Automatically analyze subsets of data to uncover actionable insights rapidly.
Common data model support
Use standardized data schemas for consistent and efficient data management.
Customization
Modify visualizations and import new tools to create tailored dashboards.
APIs for integration
Embed Power BI dashboards into other software products using sample code and APIs.
Self-service data prep
Transform and enrich data independently with Power Query, sharing across models and reports.
Modeling view
Organize complex data models into separate diagrams for better clarity and management.
Pros
User-friendly interface simplifies data visualization and reporting.
Seamless integration with Microsoft products enhances productivity.
AI-driven features provide deeper insights without technical expertise.
Cons
Advanced features may require additional training.
Performance can slow with extremely large datasets.
Power BI’s AI features saved us hours in data prep, but scaling beyond 10M rows required upgrading to premium tiers." — Tech Lead, Fortune 500 Company.
Tableau excels in delivering powerful data visualization capabilities. Its drag-and-drop interface allows you to create interactive dashboards effortlessly. The tool supports integration with multiple data sources, enabling you to analyze data from various platforms. Tableau’s advanced analytics features, such as forecasting and trend analysis, empower you to make data-driven decisions.
Pros
Intuitive interface makes it accessible for non-technical users.
Exceptional data visualization capabilities enhance understanding.
Strong community support provides resources for troubleshooting and learning.
Cons
Higher cost compared to other business intelligence tools.
Limited customization options for certain visualizations.
Qlik Sense empowers you to explore and analyze data with advanced tools designed for flexibility and efficiency. Its standout features include:
Associative Data Model: This model lets you explore data in a non-linear way, uncovering hidden relationships and insights that traditional systems might miss.
Self-Service Analytics: You can create and modify reports independently, reducing reliance on IT teams and speeding up analysis.
Data Visualization: Qlik Sense offers customizable visualizations, helping you present data in a clear and impactful manner.
Pros
Flexible data exploration reveals deeper insights.
Self-service capabilities save time and resources.
Customizable visualizations enhance communication of insights.
Sisense is a powerful tool designed to handle large-scale data analytics with ease. It integrates artificial intelligence and machine learning to deliver advanced analytics capabilities. You can manage massive datasets efficiently on a single server, making it an excellent choice for scalability. Sisense also allows you to create customizable dashboards quickly, helping you visualize data insights effectively. Its ability to combine data from multiple sources ensures you get a comprehensive view of your business performance.
Pros
Handles large datasets without compromising performance.
Offers AI-driven insights for smarter decision-making.
Customizable dashboards make data visualization simple and impactful.
Scalable design supports growing businesses.
Cons
Advanced features may require technical expertise.
Pricing can be a barrier for smaller organizations.
Zoho Analytics is a versatile tool that simplifies data reporting and analysis. It offers a drag-and-drop interface, making it easy for you to create reports and dashboards. The platform supports integration with over 500 business apps, ensuring seamless data flow. Its AI-powered assistant, Zia, lets you query data using natural language, making analytics accessible to everyone. Zoho Analytics also provides pre-built templates and widgets, saving you time in report creation.
Pros
User-friendly interface reduces the learning curve.
Extensive integrations ensure compatibility with existing systems.
AI-powered assistant simplifies data queries.
Affordable pricing makes it accessible for small businesses.
Cons
Limited advanced analytics features compared to premium tools.
Performance may slow with extremely large datasets.
Use Case
Description
Understanding Data
Enhances comprehension of business data through visualization and trend identification.
Analyzing Business Performance
Facilitates detailed measurement and monitoring of business performance with actionable insights.
Business Growth
Supports scaling of business through forecasts, timely decisions, and strategic planning.
SAP Analytics Cloud combines analytics and planning in a single platform, making it a comprehensive solution for business intelligence. It integrates seamlessly with SAP's S/4HANA ERP system and other SAP tools, allowing you to analyze data within a broader business context. This integration helps you understand how different decision points fit into your overall workflow. The platform also offers predictive analytics, enabling you to forecast trends and make proactive decisions.
Pros
Unified platform for analytics and planning.
Seamless integration with SAP tools enhances reporting capabilities.
IBM Cognos Analytics offers a comprehensive suite of features tailored for enterprise-level reporting. You can rely on its batch execution capabilities to generate and distribute large volumes of reports efficiently. The tool’s report bursting feature ensures personalized report delivery to individual users, saving time and improving accuracy. Its multi-node deployment with load balancing optimizes performance, even during peak usage.
Cognos Analytics supports both relational databases and OLAP data through its multi-layered architecture, giving you flexibility in data management. The platform also includes a granular multi-tiered security model, addressing complex security requirements. You can distribute reports in multiple formats, such as PDFs or emails, making it easier to share insights across your organization. Additionally, integration with IBM Decision Optimization enhances decision-making by combining analytics with optimization techniques.
Pros
Strong enterprise reporting capabilities make it ideal for large organizations.
Personalized report distribution improves user experience and efficiency.
Multi-layered architecture supports diverse data sources, offering flexibility.
Integration with IBM Decision Optimization provides advanced decision intelligence.
The ability to create budgets, strategic plans, and monitor KPIs streamlines business processes.
Cons
The interface may feel outdated compared to modern tools.
Advanced features require technical expertise, which could slow adoption.
Licensing costs may be prohibitive for smaller businesses.
How to Choose the Right Data Reporting Tools for Your Business
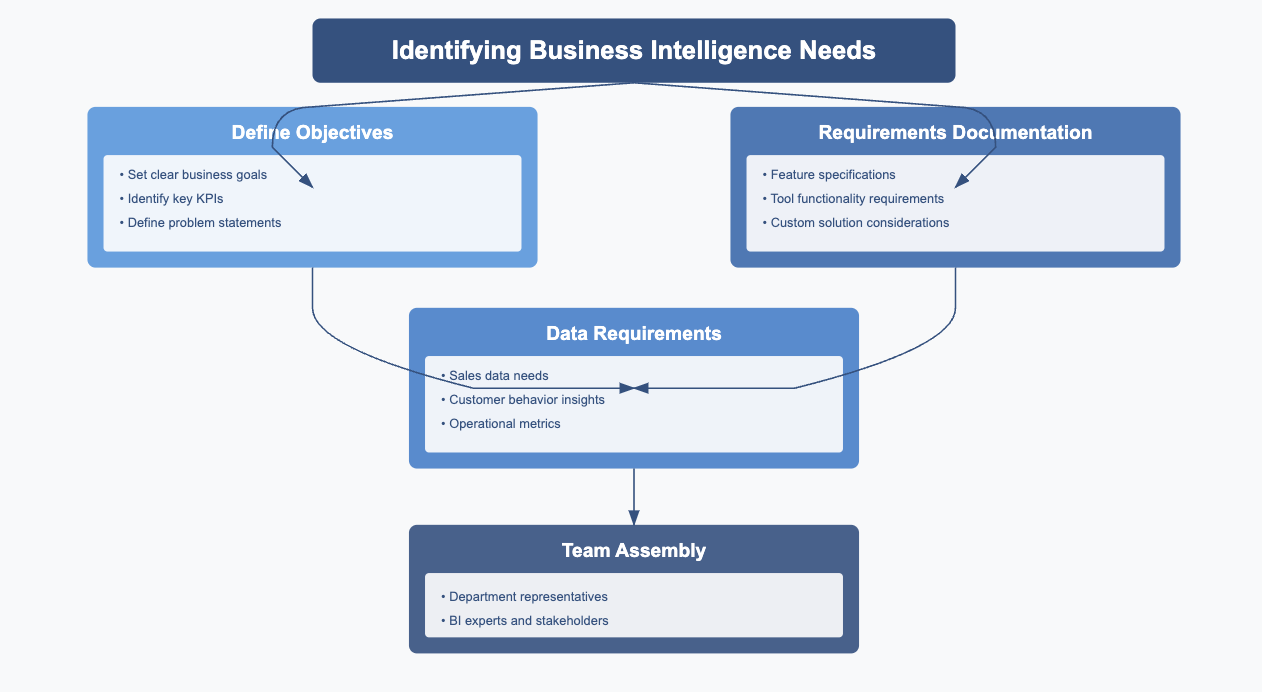
Identifying Your Business Intelligence Needs
Before selecting a tool, you must clearly define your business intelligence needs. Start by setting objectives and identifying the key performance indicators (KPIs) you want to track. Determine the problems you aim to solve with business intelligence and outline the types of data you need. For example, decide whether you require sales data, customer behavior insights, or operational metrics. Specify how you want to access this data, the types of reports you need, and the evaluation metrics to measure success.
Next, compile a requirement document. This document should detail the necessary features and functionalities of the tools you’re considering. If your needs are highly specific, you might explore custom solutions tailored to your business. Finally, assemble a team to guide your strategy. Include representatives from different departments and business intelligence experts to ensure the tool aligns with your goals.
Comparing Features of Reporting Tools
Not all reporting tools are created equal. To find the right one, compare their features based on your organization’s structure and reporting needs. Look for tools that generate consistent reports for various audiences, such as executives or team leads. Ensure the tool integrates seamlessly with your existing systems to streamline data collection and reporting processes.
Customization is another critical factor. A tool that allows you to tailor dashboards and visualizations to your unique requirements will provide more value. Additionally, evaluate the level of customer support offered by the vendor. Reliable support ensures you can resolve issues quickly and keep your operations running smoothly.
Evaluating Scalability and Long-Term Usability
Your business will grow, and your reporting needs will evolve. Choose a tool that scales with your organization. Scalable tools handle increasing data volumes, support more users, and adapt to new business requirements without compromising performance. They also simplify system upgrades, minimizing disruptions.
Long-term usability is equally important. Opt for tools with intuitive interfaces and regular updates to stay relevant. A user-friendly design ensures your team can use the tool effectively, while updates keep it aligned with the latest trends in business intelligence and analytics.
Tip: Prioritize tools that combine scalability with ease of use to future-proof your business intelligence strategy.
Industry Benchmark:
A 2025 Dresner Advisory study ranked FineVis as a top tool for scalability, with 89% of users citing its ability to handle 10x data growth without performance lag.
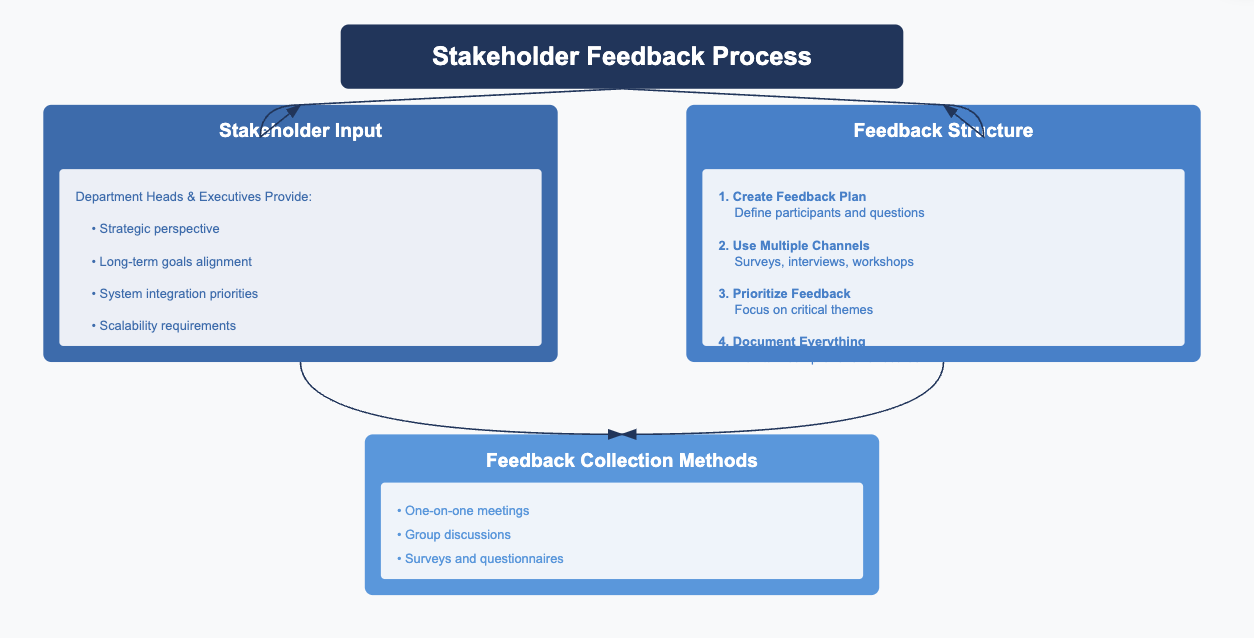
Gathering Feedback from Teams and Stakeholders
When choosing a data reporting tool, you can’t afford to overlook the insights of your teams and stakeholders. Their feedback ensures the tool aligns with your business needs and daily workflows. By involving them early, you increase adoption rates and reduce resistance to change.
Start by organizing feedback sessions with key team members. Ask them about their current challenges with data reporting. For example, do they struggle with accessing real-time data? Or do they need more intuitive dashboards? These insights will help you identify must-have features for your tool.
💡 Tip: Use surveys or polls to gather input from larger teams. Keep questions simple and focused on specific pain points.
Stakeholders, such as department heads or executives, bring a strategic perspective. They can highlight long-term goals and ensure the tool supports broader business objectives. Schedule one-on-one meetings or group discussions to understand their priorities. For instance, they might prioritize scalability or integration with existing systems.
Here’s how you can structure your feedback process:
Create a Feedback Plan: Define who to involve and what questions to ask.
Use Multiple Channels: Combine surveys, interviews, and workshops for comprehensive input.
Prioritize Feedback: Focus on recurring themes and critical needs.
Document Everything: Keep a record of all feedback for reference during decision-making.
📋 Note: Transparent communication is key. Share how you’ll use the feedback to build trust and encourage honest input.
By gathering feedback, you ensure the tool meets both operational and strategic needs. This collaborative approach not only improves tool selection but also fosters a sense of ownership among your team.
Data reporting tools are essential for driving success in business intelligence. They empower you to make informed decisions, identify areas for improvement, and adapt to market trends. These tools also help you discover opportunities and predict future outcomes with accuracy.
Don’t underestimate the importance of aligning your tool selection with your business goals. The right tool ensures seamless integration, accurate insights, and ease of use, while the wrong one can hinder progress.
Explore demos and trials to find a solution tailored to your needs. Take the first step toward smarter, data-driven strategies today.
Access a wealth of case studies, industry insights, and solution guides to accelerate digital transformation.
FAQ
What is the best way to evaluate a data reporting tool before purchasing?
You should start by exploring free trials or demos. Test the tool’s features, ease of use, and compatibility with your systems. Involve your team to gather feedback. Focus on how well it meets your business needs and whether it aligns with your long-term goals.
Can small businesses benefit from data reporting tools?
Absolutely! Many tools, like Google Data Studio and Zoho Analytics, offer affordable or free options. These tools help you track performance, identify trends, and make data-driven decisions. Even with limited resources, you can gain valuable insights to grow your business.
How do I ensure my team adopts a new reporting tool?
Provide training sessions and resources to help your team learn the tool. Choose a user-friendly platform with an intuitive interface. Involve your team in the selection process to ensure the tool meets their needs. Highlight how it simplifies their work and improves efficiency.
Are free data reporting tools reliable for professional use?
Yes, free tools like Google Data Studio can handle many professional tasks. However, they may lack advanced features or scalability. If your needs are basic, free tools work well. For complex analytics, consider investing in premium options that offer more robust capabilities.
How often should I update my data reporting tools?
You should review your tools annually or whenever your business needs change. Look for updates or new features from your vendor. If your current tool no longer meets your requirements, consider upgrading to a more scalable or feature-rich solution.