A ramp dashboard is the operational view finance teams use to monitor company spend, policy compliance, approvals, reimbursements, and payment activity in one place. For controllers, AP managers, finance directors, and budget owners, its value is simple: faster answers, fewer manual reconciliations, and tighter control over cash leaving the business.
If your team is still pulling card transactions from one system, invoices from another, reimbursements from spreadsheets, and budget updates from static reports, you already know the pain points. Month-end becomes a scramble. Policy violations are found too late. Department leaders ask for budget status and finance has to patch together exports. A ramp dashboard solves that by centralizing the most important finance operations signals into a single reporting layer.
Just as important, the dashboard is not the same thing as the spend management platform itself. The platform handles the workflows behind the scenes: card issuance, expense capture, approvals, bill pay, policy rules, accounting sync, and access controls. The dashboard is the visibility layer that helps users interpret what is happening across those workflows.
This matters because different stakeholders use the same environment for different reasons:
At its core, a ramp dashboard gives finance teams a live operating picture of spend across cards, reimbursements, bills, and vendor payments. Instead of reviewing activity only after period-end, teams can see spending patterns as they develop and act before they create close issues or budget overruns.
That shift from retrospective reporting to active monitoring is where the business value compounds. Finance can move from transaction processing to spend governance. Teams can catch duplicate charges, missing receipts, unusual merchant activity, or approval bottlenecks earlier. Managers get budget clarity without waiting for finance to build another manual report.
A practical way to think about it:
The platform runs the process.
The dashboard exposes the signals.
The finance team uses those signals to make decisions and enforce discipline.
For enterprise environments, this distinction is critical. A pretty dashboard without integrated controls becomes a reporting layer on top of fragmented operations. A well-designed spend management dashboard, by contrast, reflects real workflow status and supports direct action.
Key Metrics (KPIs)
Below are the most important KPIs a ramp dashboard should surface for finance operations:
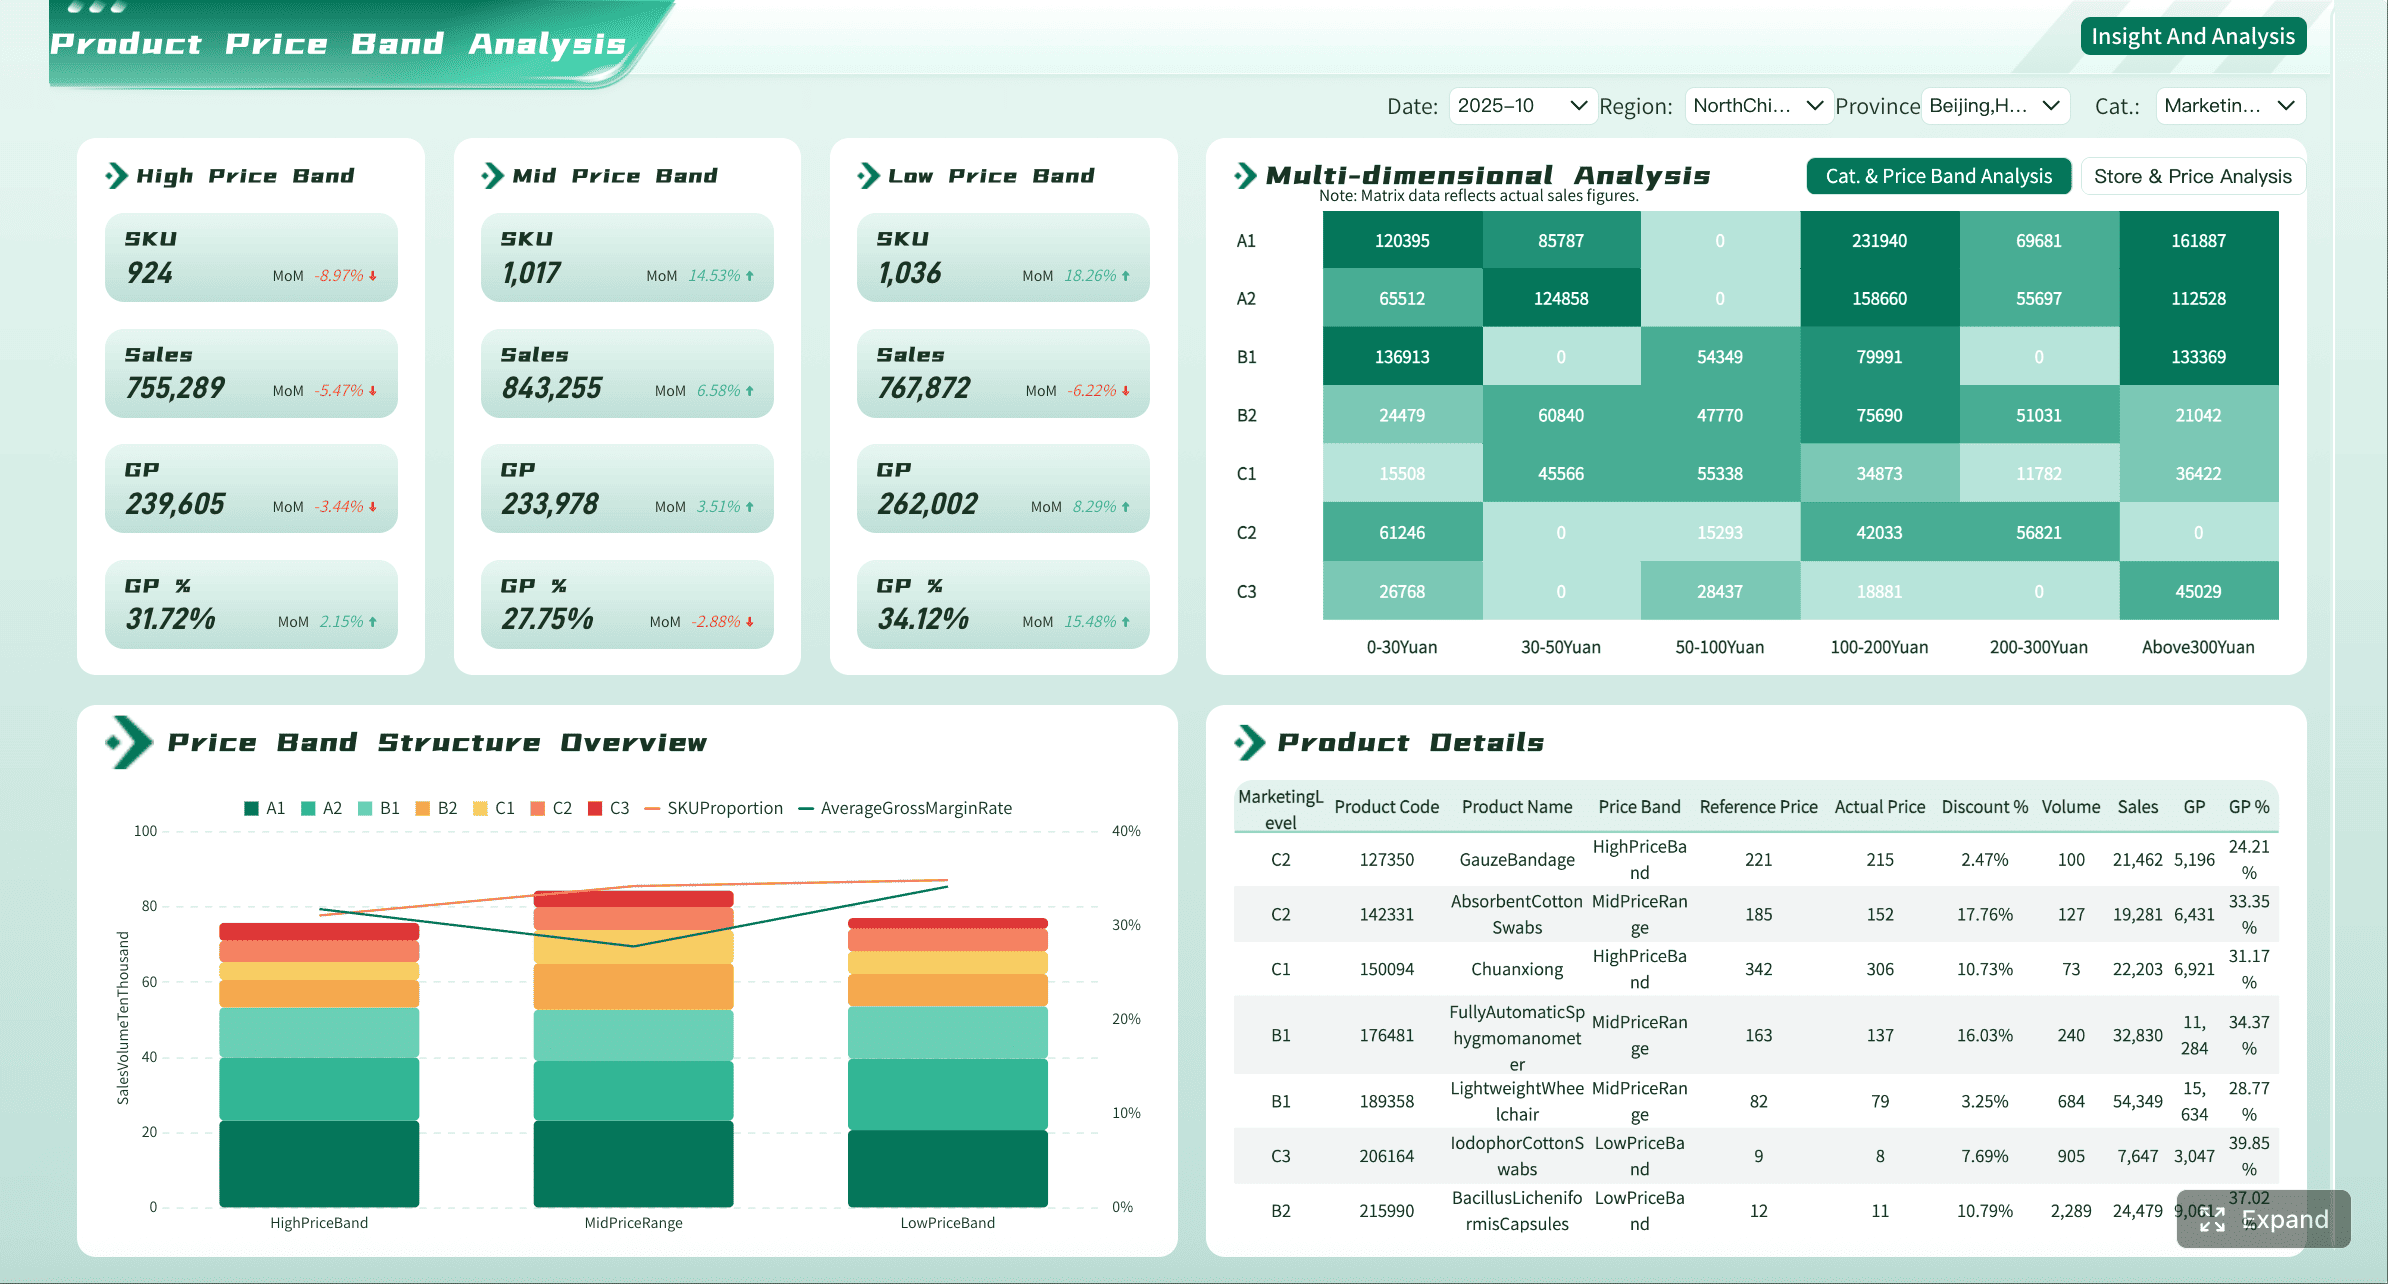
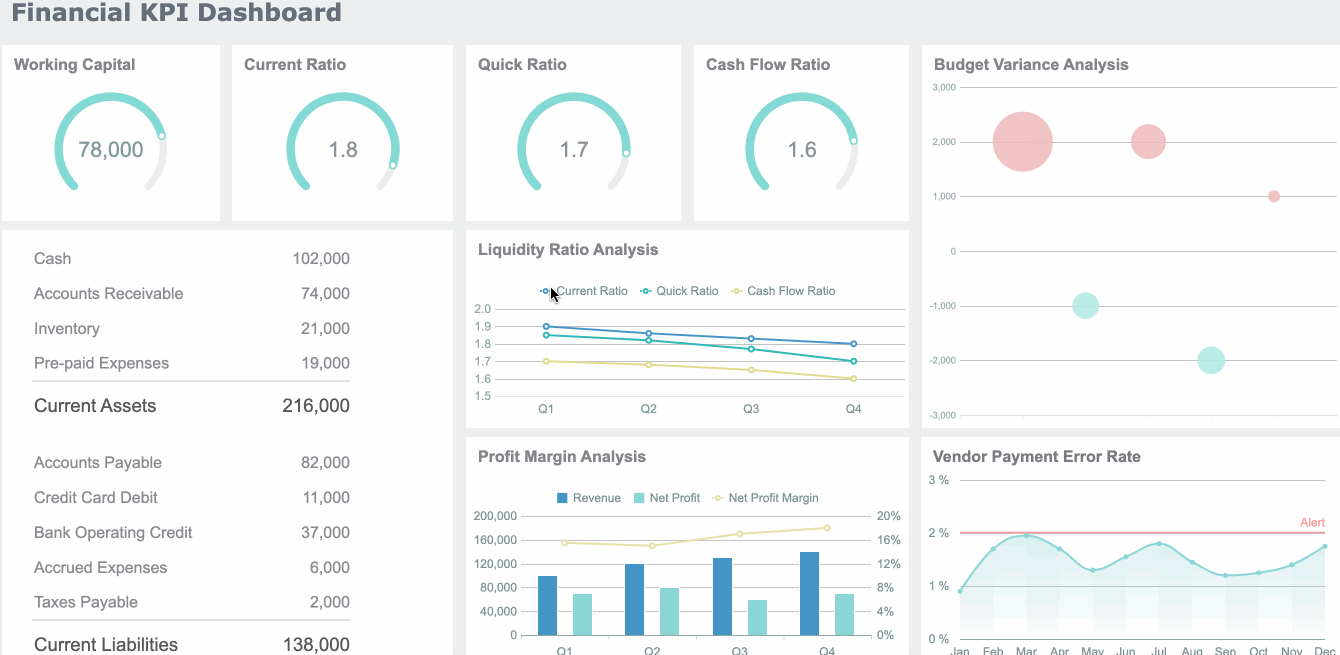
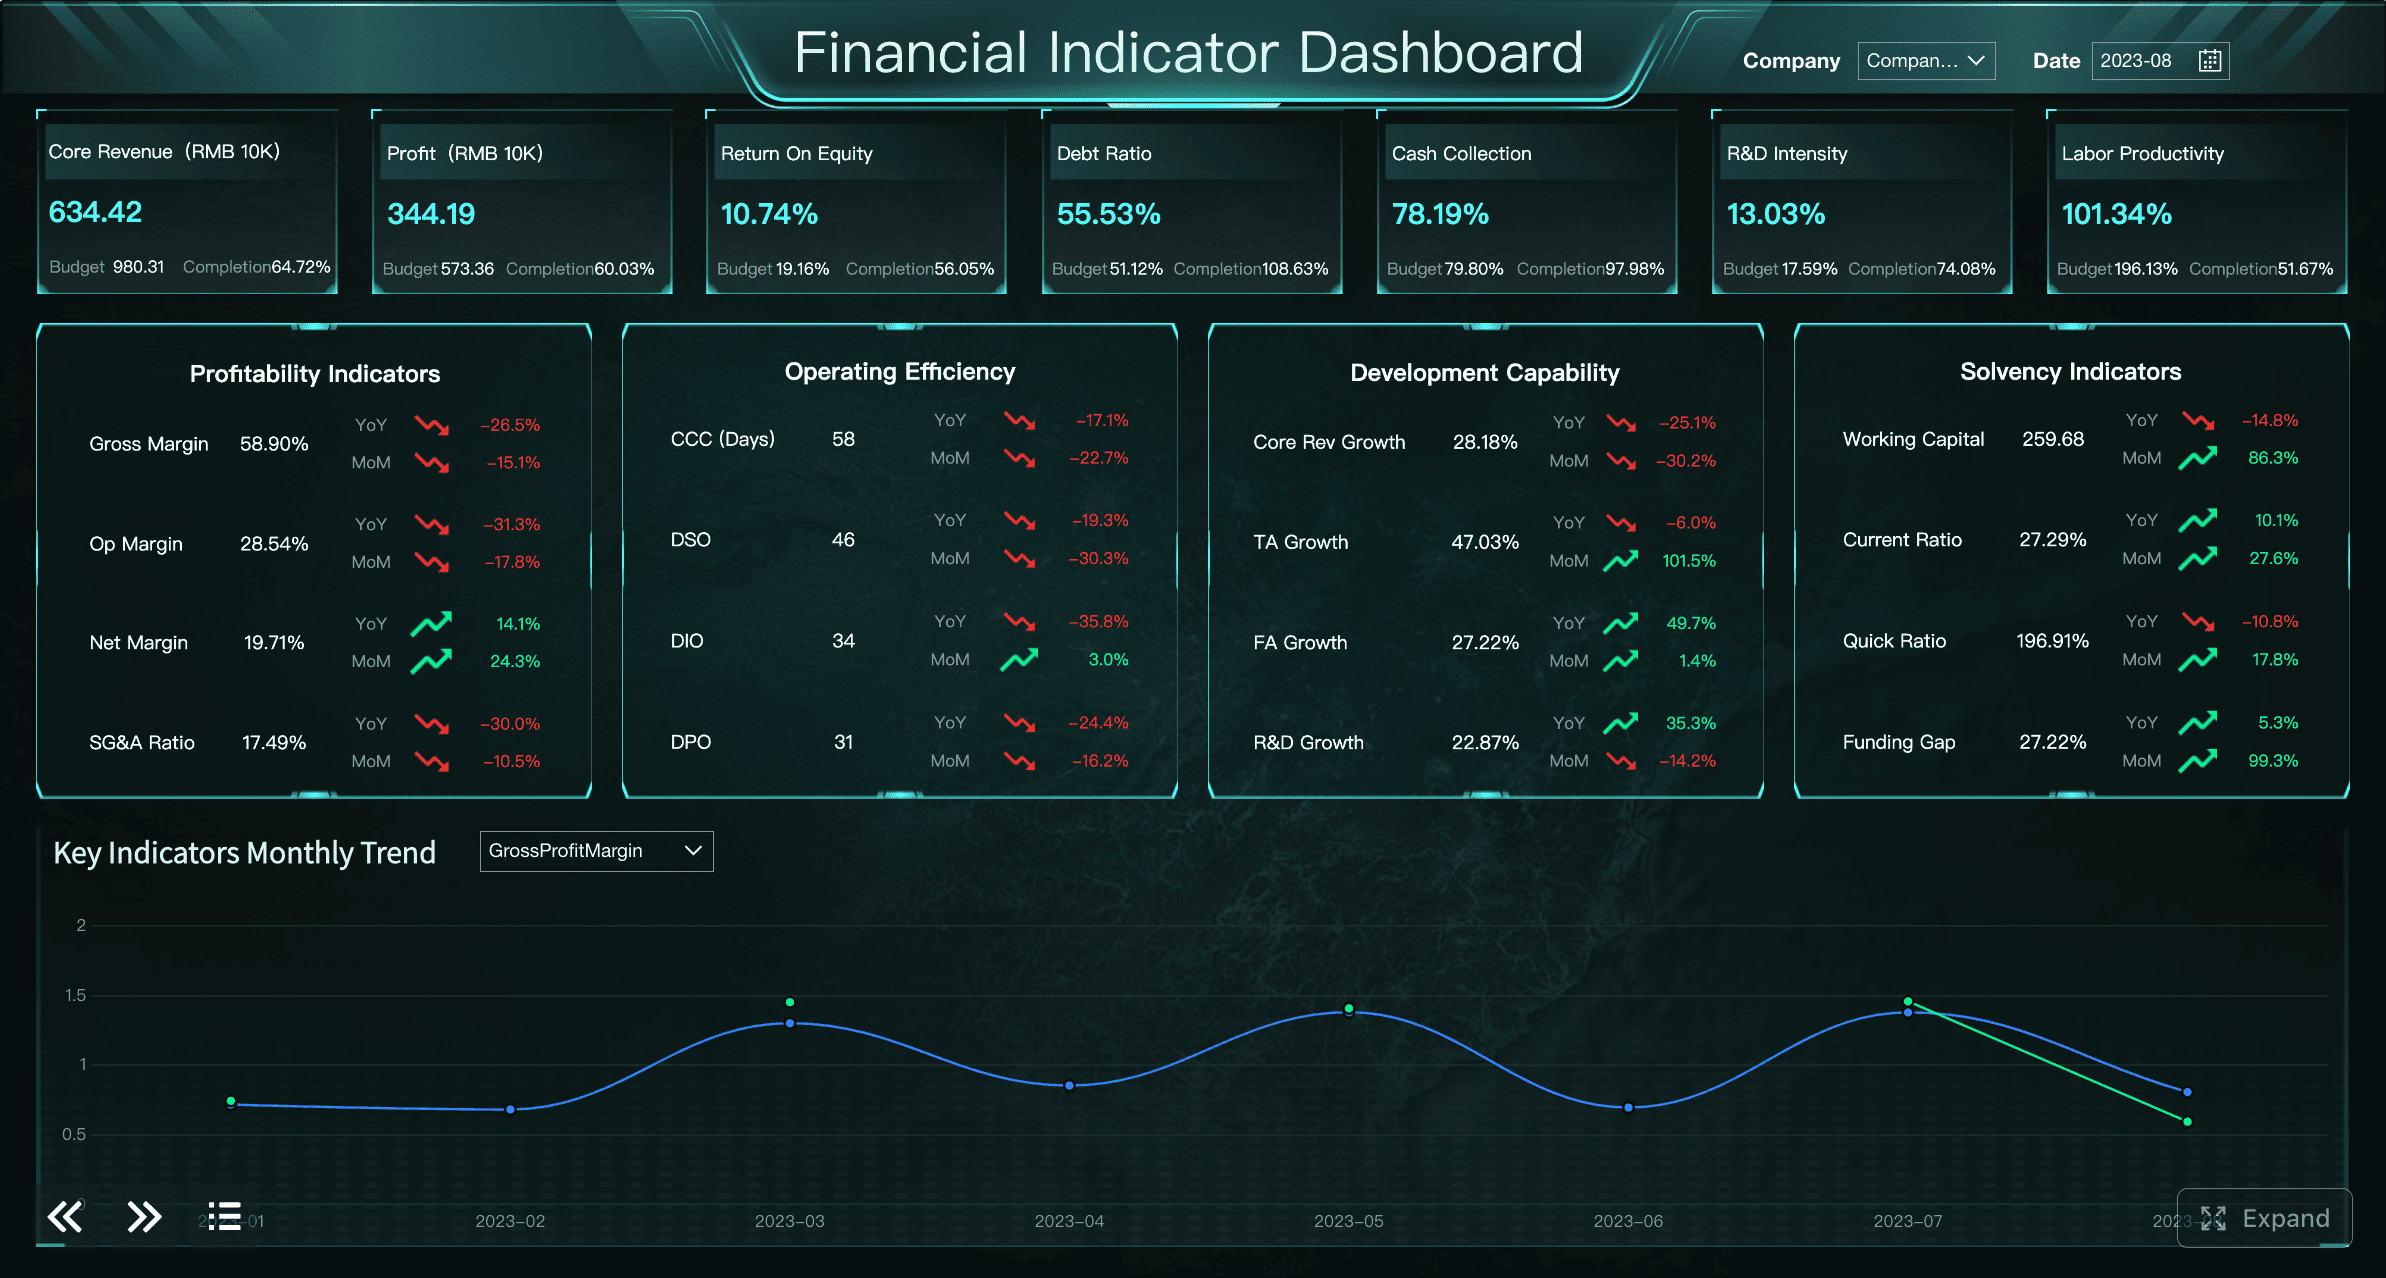
Total spend: Overall company spend for a selected period across cards, reimbursements, bills, and payments.
Spend by department: Tracks which teams are consuming budget and where overspend risk is emerging.
Spend by merchant/vendor: Highlights concentration, contract leakage, or unusual vendor growth.
Policy exception rate: Percentage of transactions flagged as out of policy, missing documentation, or requiring review.
Approval turnaround time: Measures how quickly managers or approvers act on requests, expenses, or invoices.
Reimbursement cycle time: Time from employee submission to reimbursement completion.
Receipt completion rate: Share of transactions with required documentation attached.
GL coding accuracy: Monitors whether transactions are mapped correctly for downstream accounting and close.
Budget pacing: Compares current spend against budget over time to identify early overrun trends.
Vendor concentration: Shows how dependent spend is on a small number of suppliers or merchants.
Exception volume: Counts transactions needing intervention, such as duplicates, policy flags, or missing fields.
Close readiness status: Indicates how much spend data is complete, coded, approved, and ready for reconciliation.
Core Views and Data You Can Expect in a Ramp Dashboard
A useful ramp dashboard is not one giant summary page. It is a set of connected views that serve different operational decisions. The strongest dashboards balance executive simplicity with drill-down detail for finance operators.
Spend visibility across cards, reimbursements, bills, and vendor payments
The first expectation is unified spend visibility. Finance should be able to review all major outgoing spend categories without moving across multiple systems or exports.
Transactions are typically grouped and filtered by:
Employee
Merchant
Spend category
Department or cost center
Legal entity
Location
Vendor
Time period
This structure matters because the same transaction can answer different questions depending on the user. A department manager may want to know how much their team spent on software this month. A controller may want to isolate all transactions from one merchant across entities. An AP lead may want to review vendor payment volume by due date.
A unified view reduces manual reporting because the finance team no longer needs to stitch together separate card, expense, and bill payment reports. It also improves anomaly detection. When all spend types sit in one environment, unusual patterns stand out faster, such as sudden vendor spikes, duplicate subscriptions, or spending shifts in a specific team.
Controls, approvals, and policy monitoring
Visibility without controls is incomplete. A strong ramp dashboard should make policy enforcement measurable, not just configurable.
Control-focused views often include:
Approval workflow status
Outstanding approval queues
Missing receipts or documentation
Out-of-policy transaction alerts
Budget threshold warnings
Spend limit usage
Duplicate or suspicious transaction flags
These views help finance teams prevent issues before they land in month-end close. Instead of discovering noncompliant transactions after posting, teams can intervene when documentation is missing, approvals are delayed, or policy limits are breached.
This is especially important in lean finance organizations. If your team cannot review every transaction manually, the dashboard should help you work by exception. That means surfacing only the activity that requires human judgment while routine, in-policy activity flows through.
Real-time reporting for faster decisions
Static monthly reporting is too slow for modern spend operations. A ramp dashboard becomes materially more valuable when it reflects current activity rather than outdated snapshots.
Real-time or near-real-time metrics support:
Cash planning
Budget pacing
Department spend checks
Approval escalation
Vendor payment timing decisions
Detection of spend spikes before they become a problem
Leaders also need drill-down reporting. High-level trends are useful, but operational questions rarely stop at the summary layer. When a CFO sees a rise in software spend, they need to identify the merchants, teams, entities, and approvers behind that increase without asking analysts to prepare a separate report.
That self-service capability saves time across finance and reduces reporting bottlenecks for the rest of the business.
How Finance Teams Use the Dashboard in Day-to-Day Operations
The real test of a ramp dashboard is whether it improves recurring finance work. Good dashboards are not just for board meetings. They should reduce friction in daily execution.
Month-end close and reconciliation support
During close, finance teams need to clear exceptions quickly. A well-configured dashboard helps them review:
Missing receipts
Unapproved transactions
Incorrect or incomplete coding
Account mappings
Entity assignments
Duplicate entries
Reimbursement status
Bill payment timing
This reduces back-and-forth because issues are visible earlier and assigned to the right owners. Instead of sending broad reminder emails, controllers can work from exception queues. Instead of waiting for spreadsheets from business teams, AP can review pending invoices and documentation status directly in the dashboard flow.
The operational payoff is a shorter, cleaner close cycle with fewer surprises.
KPI tracking for finance ops
Finance operations teams need more than transaction lists. They need process KPIs that show whether spend management is becoming more efficient and more controlled over time.
Common finance ops KPIs include:
Spend by department to compare budget consumption and identify outliers
Policy exception rate to measure compliance and find training or policy gaps
Approval turnaround time to identify manager bottlenecks
Reimbursement cycle time to improve employee experience and back-office efficiency
Vendor concentration to assess supplier dependency and negotiation leverage
Trend analysis matters here. A single month may show noise. A dashboard that tracks these metrics over time helps teams spot whether policies are improving behavior, whether approvals are slowing as headcount grows, or whether one vendor is becoming a concentration risk.
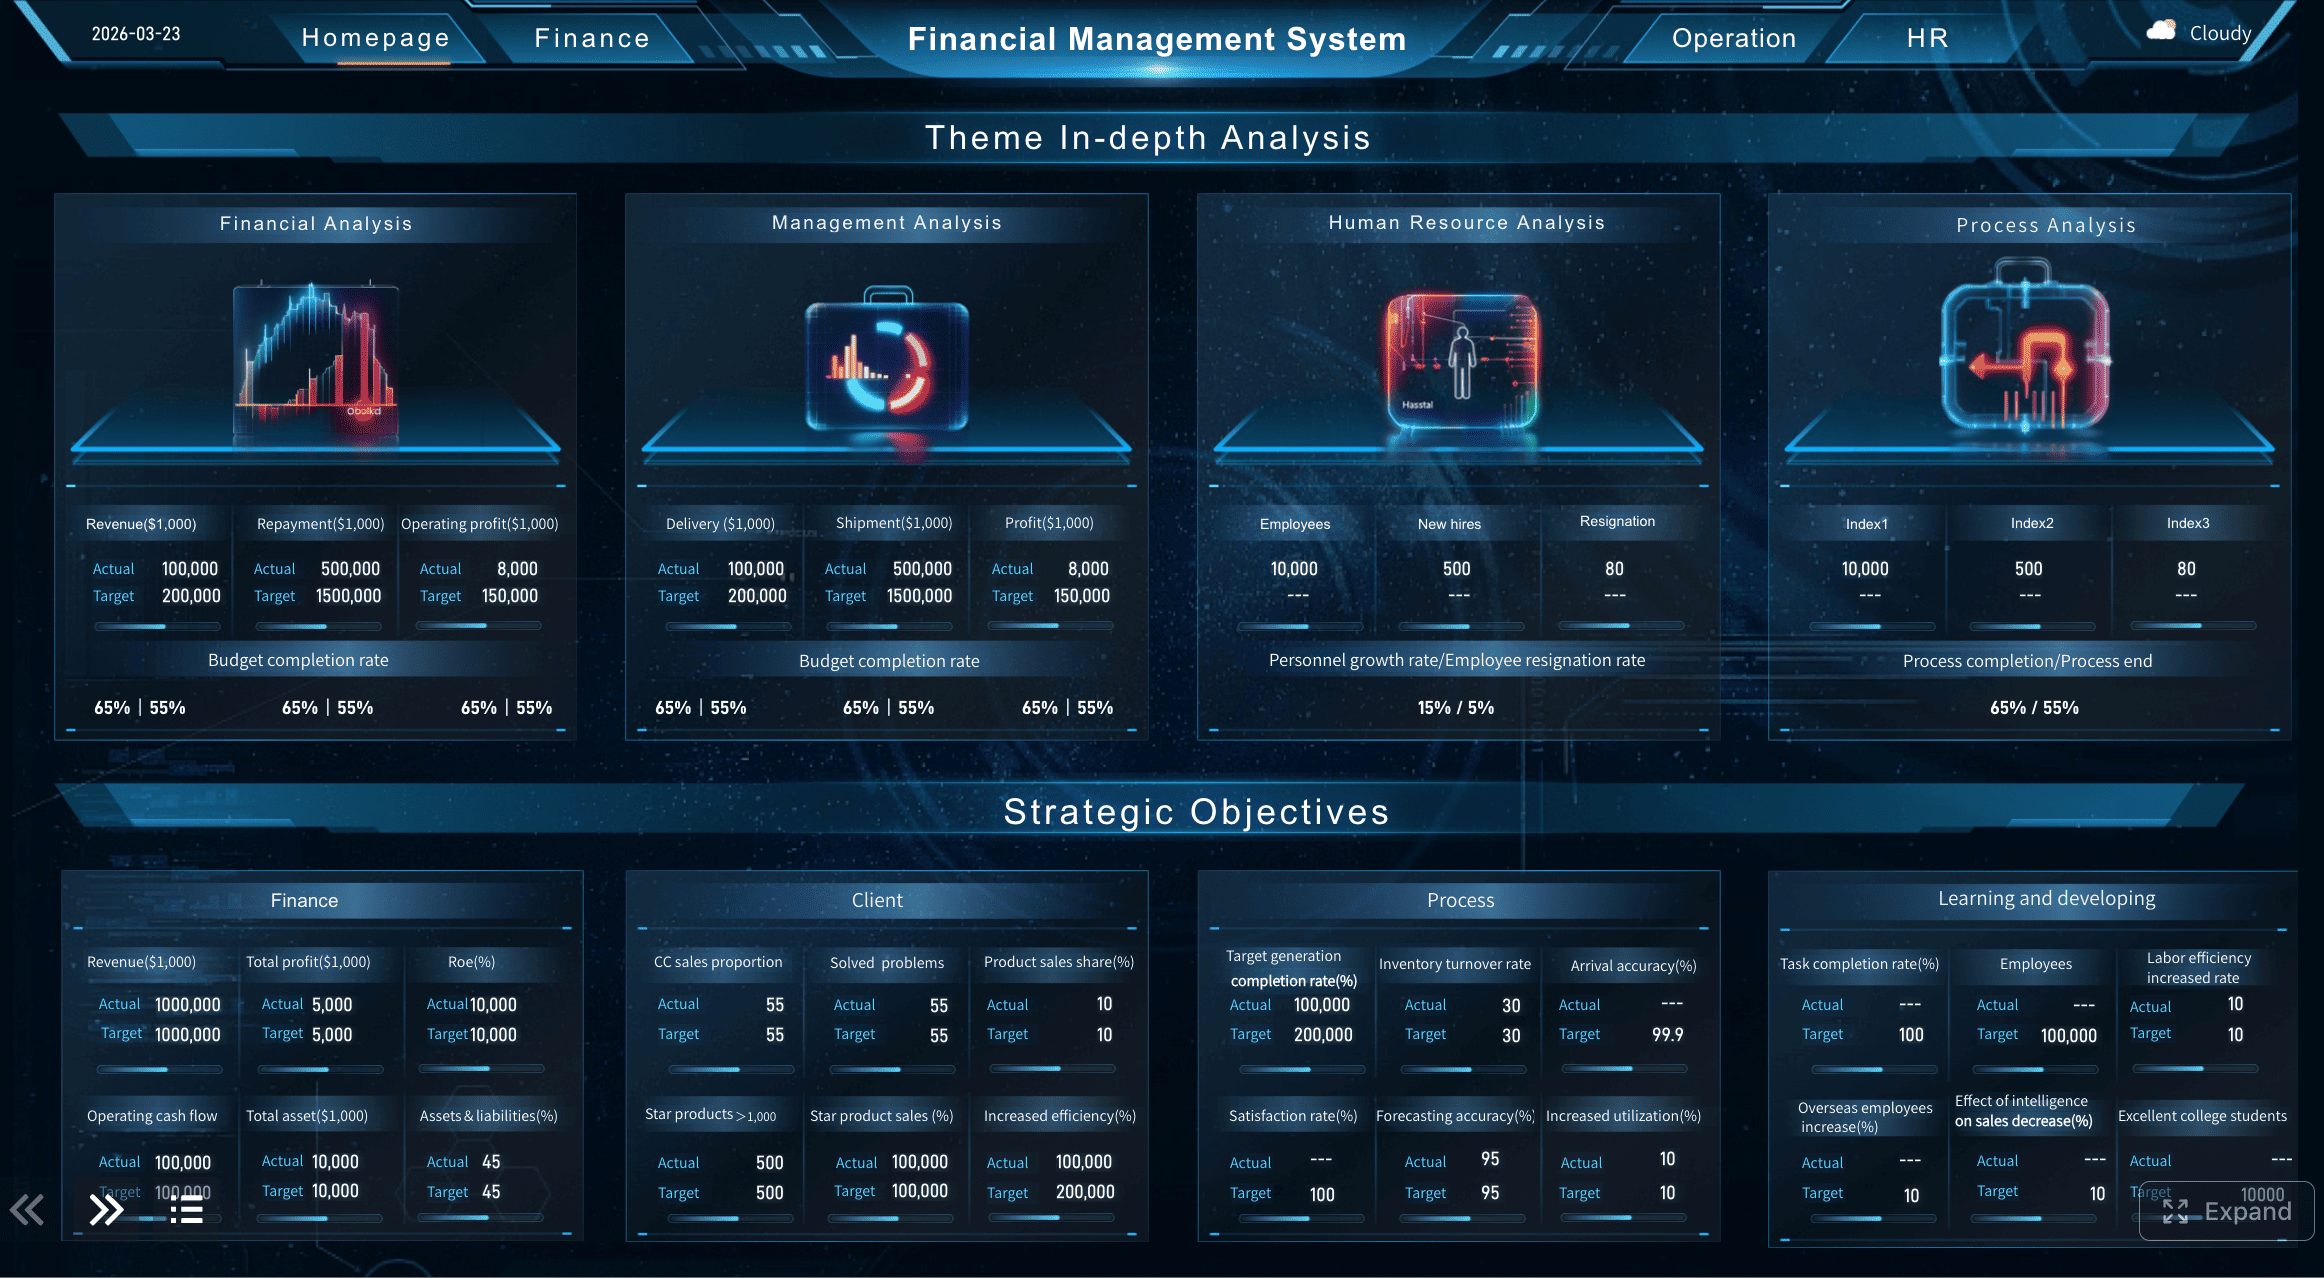
Cross-functional reporting for managers and executives
Finance does not own spending alone. Department leaders need enough visibility to manage their budgets, but not necessarily the same detail as finance operators.
That is why dashboard customization matters. Different audiences need different levels of abstraction:
Executives need concise summaries, trends, risk indicators, and budget pacing.
Department managers need budget usage, team-level spend, and actionable exceptions.
Finance operators need transaction-level detail, workflow status, and correction queues.
If all users receive the same dashboard, adoption tends to drop. Executives see too much noise. Operators lack detail. Managers get confused by accounting fields they do not control. Tailored dashboard views improve both trust and actionability.
What to Look For When Evaluating a Spend Management Dashboard
Not every ramp dashboard is equally useful. Some tools look polished but break down under real finance requirements. Enterprise buyers should assess the dashboard as part of the operating system around it, not as a reporting screen alone.
Usability, access, and login experience
Adoption starts with access. If first-time setup is confusing or recurring login is inconsistent, non-finance stakeholders will avoid the tool and finance will end up back in email and spreadsheets.
Evaluate whether the platform supports:
Straightforward user onboarding
Clear employee and admin setup flows
SSO or identity provider support
Reliable authentication controls
Simple recurring access across finance and non-finance users
A unified login experience can be especially important for companies with multiple entities or users who need access across business units. If people can sign in once and reach the data they need without friction, dashboard adoption improves significantly.
Integrations, data accuracy, and audit readiness
The dashboard is only as trustworthy as the data behind it. Enterprise finance teams should scrutinize the quality of integrations and synchronization behavior before relying on any reporting layer.
Look closely at:
Accounting system integrations
ERP sync quality and frequency
Chart of accounts mapping
Multi-entity support
Role-based permissions
Export flexibility
Historical audit trails
Data refresh reliability
Clean audit trails are non-negotiable. Finance teams need to know who approved what, when coding changed, whether a transaction was overridden, and what source system fed the dashboard. Without that traceability, reporting confidence erodes fast.
Alerts, automation, and exception handling
The best dashboards do not just display information. They prioritize action.
Look for automation that flags:
Unusual transactions
Missing receipts
Duplicate spend
Out-of-policy purchases
Approval delays
Incomplete coding
Payment exceptions
Exception-focused workflows are how lean teams scale. Instead of reviewing every line item manually, finance should focus only on the transactions that need intervention. This is one of the clearest markers separating a basic spend report from a true operational dashboard.
Common Misunderstandings and How to Avoid Them
One of the biggest search and evaluation problems around the term ramp dashboard is ambiguity. Not every dashboard or login page with the word “Ramp” relates to corporate spend management.
That leads to common mistakes:
Assuming any “Ramp” portal is finance software
Comparing unrelated tools with similar names
Landing on government, education, or industry systems that have nothing to do with spend management
To avoid wasted evaluation time, confirm three things before comparing tools or searching for access:
Product context: Is this a corporate spend management and finance operations platform?
Feature set: Does it include cards, expenses, bill pay, approvals, controls, and reporting?
Intended users: Is it built for finance teams, AP, controllers, and department owners?
This sounds basic, but it prevents poor benchmarking. Teams often compare screenshots, pricing pages, or sign-in portals without confirming whether they are looking at the same product category.
How to Get the Most Value From a Ramp Dashboard
Most finance teams underuse dashboards by trying to track too much too early. The smarter approach is to start with a few high-impact KPIs, assign clear owners, and evolve the configuration over time.
Best practices for implementation
Here is the practical approach I recommend as a consultant:
Start with three KPI themes
Focus first on visibility, control, and process speed.
Example starter set: total spend, policy exception rate, and approval turnaround time.
This keeps reporting aligned to operational value rather than vanity metrics.
Assign ownership for every exception workflow
Define who owns approvals, policy updates, missing receipts, and coding corrections.
A dashboard without owners becomes a passive report instead of a control mechanism.
Design role-specific views
Give executives summary dashboards.
Give operators transaction and workflow detail.
Give managers budget and exception summaries for their teams.
Review dashboard configuration quarterly
Vendors change.
Teams reorganize.
Budgets shift.
Policies evolve.
If the dashboard is not updated, it gradually stops reflecting the business.
Use trends to drive process improvement
Track whether approval times are improving.
Watch whether exception rates fall after policy changes.
Measure whether reimbursement cycles are getting shorter.
Dashboards should shape operating behavior, not just report history.
Simple checklist for choosing, implementing, and improving a dashboard over time
Use this checklist to keep your rollout disciplined:
Define the top finance decisions the dashboard must support
Choose a dashboard tied to actual spend workflows, not just reporting overlays
Confirm ERP and accounting integrations before rollout
Standardize roles, permissions, and approval ownership
Launch with a small KPI set
Create executive, manager, and operator views separately
Establish exception review routines weekly, not just at month-end
Review data quality and mappings regularly
Reassess KPIs and dashboard layout each quarter
Build the Workflow Faster With FineBI
Building this manually is complex; use FineBI to utilize ready-made templates and automate this entire workflow.
That is the practical reality for most enterprises. Even if you have the raw spend data, turning it into a reliable ramp dashboard requires data modeling, KPI definitions, permission logic, refresh management, exception monitoring, and stakeholder-specific views. Done manually, this becomes another ongoing finance reporting project.
FineBI helps streamline that effort by giving teams a faster path to:
Build finance dashboards with ready-made templates
Combine spend, reimbursement, AP, and ERP data into one reporting layer
Create role-based dashboard views for executives, managers, and operators
Automate refreshes, alerts, and recurring KPI tracking
Enable self-service drill-down without sacrificing governance
For organizations that want the outcomes of a ramp dashboard without months of custom BI work, FineBI is the more scalable route. Finance gets the visibility, controls, and KPI management it needs, while the business gets faster answers and better spending discipline.
A Ramp dashboard is the visibility layer finance teams use to track spend, approvals, reimbursements, bill payments, and policy issues in one place. It helps users monitor activity in real time instead of waiting for month-end reports.
The platform runs the workflows, such as card controls, approvals, bill pay, and accounting sync. The dashboard surfaces the key signals and KPIs so finance teams can review performance, spot issues, and take action faster.
The most useful KPIs usually include total spend, budget versus actuals, policy exception rate, approval turnaround time, reimbursement cycle time, receipt completion rate, and close readiness. These metrics help finance teams manage control, speed, and accuracy across spend operations.
Finance leaders, controllers, AP teams, and department budget owners all use it for different decisions. Executives focus on trends and budget pacing, while operators need transaction-level detail for coding, approvals, and exception handling.
A strong dashboard reduces manual reporting, improves spend visibility, and helps catch issues like duplicate charges, missing receipts, and policy violations earlier. It also supports faster reconciliations and a smoother month-end close.
Product Trial
FineReport
Pixel-perfect reports · Interactive dashboards · Easy data entry · Digital twins


 For organizations that want the outcomes of a ramp dashboard without months of custom BI work,


