A quarterly report gives you a clear look at a company’s performance every quarter. You receive updates on revenue, expenses, and profit, which help you track changes from one quarter to the next. Quarterly reports matter because they give investors in Malaysia like you timely and transparent information. When you study these reports, you spot trends and risks before they become bigger issues. Detailed quarterly report analysis, including both numbers and the tone of management’s discussion, can influence how markets react and how you make decisions. By understanding each quarter’s results, you can make smart moves as an investor in Malaysia.
Key Takeaways
Quarterly reports provide important updates on a company’s financial health every three months, helping investors in Malaysia track revenue, expenses, and profits.
Key sections like the income statement, balance sheet, cash flow statement, and management discussion give a full picture of a company’s performance and risks.
Investors in Malaysia use quarterly reports to spot trends, make informed decisions, and react quickly to market changes before others do.
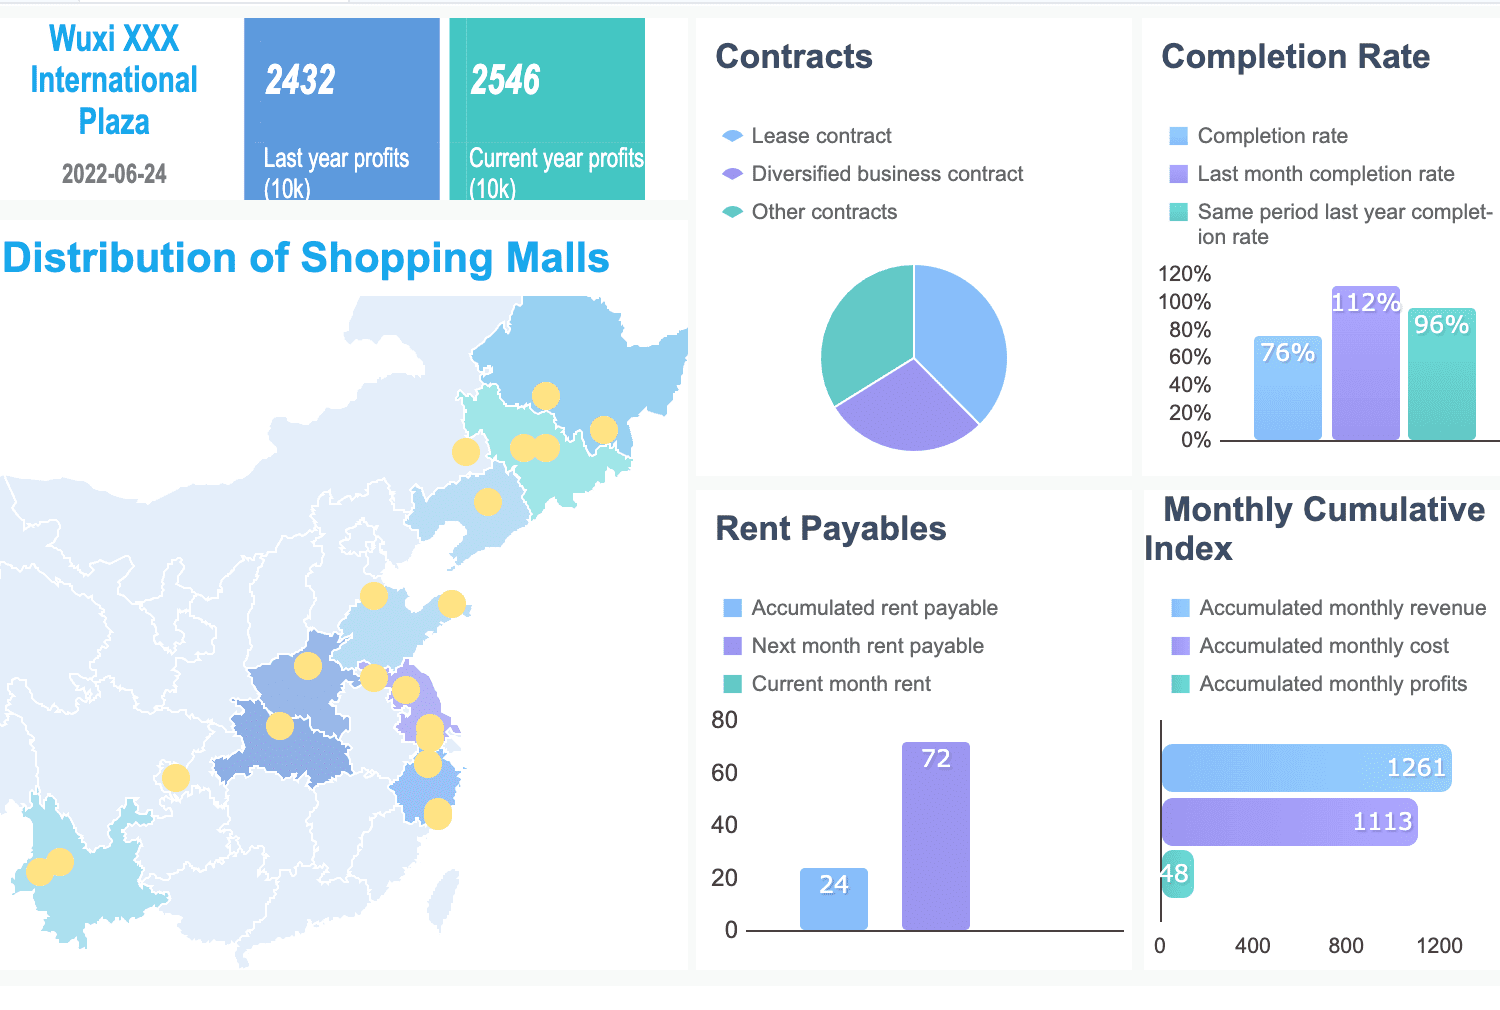
Tools likeFineReport make it easier to analyze quarterly data by automating calculations, visualizing trends, and comparing results across quarters.
Reviewing all parts of a quarterly report together helps avoid mistakes and gives a clearer understanding of a company’s true financial position.
Quarterly Report Basics
What Is a Quarterly Report?
A quarterly report is a set of financial documents that a public company releases every quarter. You receive these reports four times a year, usually at the end of March, June, September, and December. Each quarterly report gives you a snapshot of how the company performed during that specific quarter. The main goal is to keep you and other investors in Malaysia informed about the company’s financial health and business activities in Malaysia.
When you look at a comprehensive quarterly report, you find several key sections. These sections help you understand the company’s performance and position at the end of each quarter:
Income Statement: This section shows the company’s revenue, expenses, and profit for the quarter. You can see if the company made money or lost money during that period.
Balance Sheet: Here, you get a snapshot of the company’s assets, liabilities, and shareholders’ equity at the end of the quarter. This helps you judge the company’s stability.
Cash Flow Statement: This part tracks the cash coming in and going out from operating, investing, and financing activities. You learn how the company manages its cash each quarter.
Management Discussion and Analysis (MD&A): In this section, company leaders explain important events, trends, and uncertainties that affected the business in Malaysia during the quarter.
Footnotes and Disclosures: These notes give you extra details about accounting methods, risks, and other important information that might affect your view of the company.
You can use these sections to compare one quarter to another. This helps you spot patterns and changes in the company’s performance over time.
Why Are Quarterly Reports Important in Malaysia?
Quarterly reports matter because they give you timely and reliable information. As an investor, you want to make smart decisions. These reports help you do that by showing you the company’s progress every quarter.
Financial statements and disclosures in quarterly reports are objective. You can trust them to give you a clear picture of the company’s performance.
Investors in Malaysia often focus on numbers like earnings per share, dividend payout, and return on investment. These numbers appear in every quarterly report.
When you see past investment returns in these reports, you can decide if you want to keep your money in the company or look for better options.
Quarterly reports show you how well a company manages its resources. You can judge if the company is efficient and if it uses its assets wisely each quarter.
Shareholders use quarterly reports as signals. These signals help you decide when to buy, hold, or sell your shares.
Research shows that regular financial disclosures, such as quarterly reports, play a big role in shaping investor decisions in Malaysia. You get the facts you need to act quickly and confidently.
Tip: Reviewing each quarterly report as soon as it comes out helps you stay ahead of market trends. You can react to new information before most other investors in Malaysia.
A public company must release a quarterly report to keep you informed. By reading these reports every quarter, you gain a deeper understanding of the company’s strengths and weaknesses. You also learn how outside events or management decisions affect the company’s results. This knowledge helps you make better investment choices, quarter after quarter.
Key Parts of Quarterly Reports
When you review a company’s financial statements each quarter, you gain a clear understanding of its performance and financial position and stability. The main components of these reports work together to give you a complete picture. Here’s a quick overview:
Section
What You Learn
Income Statement
Revenue, expenses, and earnings for the quarter
Balance Sheet
Assets, liabilities, and equity at the end of the quarter
Cash Flow Statement
Cash inflows and outflows from operating, investing, and financing activities
Management Discussion
Insights into business trends, risks, and future plans
Income Statement Overview
The income statement shows how much money the company made and spent during the quarter. You see details like revenue, cost of goods sold, operating income, and net earnings. This statement helps you track profitability and spot trends in quarterly earnings in Malaysia. Analysts often use vertical and horizontal analysis to compare results across quarters and industries in Malaysia. Supporting schedules keep calculations organized, making the income statement easier to read and more reliable.
FineReport by FanRuanlets you create dynamic income statement reports. You can use drag-and-drop tools to visualize trends, compare quarters, and highlight key earnings metrics. Automated calculations and clear layouts help you focus on what matters most.
Balance Sheet Snapshot
The balance sheet gives you a snapshot of the company’s financial position and stability at the end of each quarter. It lists assets, liabilities, and equity. By comparing balance sheets from different quarters, you can spot growth, changes in debt, or shifts in retained earnings. Horizontal analysis helps you see trends and evaluate how the company manages its resources.
With FineReport, you can build interactive balance sheet dashboards. These dashboards make it easy to compare quarters, visualize changes, and analyze ratios that matter to investors in Malaysia.
Cash Flow Statement
The cash flow statement breaks down cash movements into operating, investing, and financing activities for the quarter. You see how much cash the company generates from its core business in Malaysia, how it invests, and how it finances operations. Reviewing several quarters helps you identify patterns, such as seasonal trends or the impact of new projects.
FineReport supports multi-period cash flow analysis. You can track cash flow trends, visualize inflows and outflows, and link data from different quarters for deeper insights.
Management Discussion
The management discussion section provides context for the numbers in the financial statements. Here, company leaders explain what happened during the quarter, discuss risks, and outline future strategies. This section often includes both qualitative and quantitative disclosures, giving you a fuller understanding of the company’s direction.
FineReport enables you to integrate narrative analysis with financial data. You can combine charts, tables, and management commentary in one report, making it easier to connect the story behind the numbers.
Tip: Use FineReport’s visualization features to turn complex quarterly data into clear, actionable insights. This approach helps you make better investment decisions based on both financial disclosure and management’s outlook.
When a company releases its quarterly reporting, you often see immediate changes in stock prices and trading activity. Investors in Malaysia pay close attention to the details in each quarter’s disclosures. If a company reports strong quarterly earnings, the stock price usually rises. If the results disappoint, the price can drop quickly. For example, when Netflix announced fewer new subscribers in one quarter, its stock price fell by 14% after hours. This shows how quickly the market reacts to new information.
Research shows that the language used in quarterly earnings press releases also matters. If management uses more optimistic words, investors in Malaysia feel more confident about the company’s future. This optimism can lead to higher returns on assets and stronger market responses. Over the years, market reactions to quarterly reporting have grown stronger. Studies found that both price changes and trading volume increase right after companies release their quarterly results. This happens because companies now include more details, such as management guidance and analyst forecasts, in their reports.
Note: The timing of quarterly reporting can affect how quickly investors in Malaysia process new information. Reports released just before the market opens may cause price drifts as investors in Malaysia need time to react.
Investment Decisions
You use quarterly reporting to make important choices about your investments. Each quarter, you review the company’s financial performance and decide whether to buy, hold, or sell your shares. Positive surprises in quarterly earnings often boost investor confidence and lead to more buying. Negative results can cause you to reconsider your position.
Statistical studies show that the frequency of reporting affects how confident you feel about your predictions. More frequent updates can sometimes make you overconfident, even if your predictions are less accurate. The diversity of investors in Malaysia, such as those from different regions, helps the market adjust prices more completely after each quarter’s results.
FanRuan solutions, like FineReport, help you analyze quarterly reporting in real time. You can visualize trends, compare quarters, and quickly spot changes in key metrics. This gives you the tools to act on new information as soon as it becomes available, supporting smarter and faster investment decisions. With better data integration and visualization, you stay ahead in investor relations and make the most of every quarter’s disclosures.
Reading a Financial Report with FineReport in Malaysia
What to Look For
When you analyze a financial report with FineReport, you want to focus on accuracy, clarity, and actionable insights. FineReport gives you tools to make this process easier and more reliable. Here are some best practices to follow:
Check that your data is correct, current, complete, and consistent. This helps you trust the numbers you see.
Use FineReport’s automated data integration to pull information from different sources. This reduces manual entry and errors.
Take advantage of real-time reporting. You can see the latest numbers and react quickly to changes.
Use data visualization features. Charts and dashboards help you spot trends and understand complex data at a glance.
Keep your reporting process simple and consistent. FineReport lets you document and improve your workflow, so you avoid confusion.
Set up scheduled reporting. This keeps your records up to date and helps you track performance over time.
Use performance analysis and benchmarking tools. Compare your results to industry standards and find areas for improvement.
Create clear summaries and explanations. FineReport allows you to add comments and notes, making your reports easy to understand.
Tip: FineReport’s drag-and-drop interface and customizable dashboards make it easy for you to tailor reports to your needs in Malaysia, even if you are not a technical expert.
Common Pitfalls
Even with the best tools, you need to watch out for common mistakes when reading a financial report. Manual processes can lead to errors and delays, but FineReport helps you avoid these issues. The table below shows how automation improves your results:
Metric
Manual Analysis Pitfall
FineReport Solution
Accuracy
Lower accuracy due to manual errors
Automated calculations boost accuracy (+19%)
Reporting Time
Slow, time-consuming processes
Scheduled reporting saves time (-58%)
Compliance Rate
Weaker compliance with standards
Automated checks improve compliance (+21%)
You should also remember that looking at only one statement can be misleading. For example:
High revenue may hide cash flow problems if customers delay payments.
A balance sheet shows assets and liabilities at one point, but may not reveal hidden risks.
Positive cash flow might mean underinvestment in future growth.
To avoid these pitfalls, always review all sections of the financial report together. Use FineReport’s integrated dashboards to compare trends, ratios, and key metrics across different periods. This approach helps you see the full picture and make better decisions in Malaysia.
The Quarterly Report Template of Different Industries in Malaysia
Quarterly reports play a vital role in helping you understand how companies perform in different sectors. Each industry faces unique challenges when preparing quarterly financial statements. Standardized templates offer consistency and efficiency, but they can limit flexibility and may not always fit specialized needs. You need to balance standardization with customization to capture the true picture of business performance in Malaysia every quarter.
Supply Chain Quarter Report Template in Malaysia
In the supply chain sector in Malaysia, quarterly report templates help you track key metrics like inventory turnover, labor productivity, and supplier delivery times. Companies use these templates to monitor quarterly financial statements and spot trends in operational efficiency. For example, labor productivity increased by 1.6% year-over-year in Q4 2024, while warehouse leasing by third-party logistics providers rose by 9%. These improvements show how companies adapt each quarter to changing market demands.
You can use dashboards to visualize KPIs such as value chain efficiency, strategic sourcing savings, and project completion times. FineReport enables companies to integrate real-time data from multiple sources, reducing errors and improving the accuracy of quarterly financial statements. This integration supports better forecasting, cost reduction, and process improvement.
Financial KPI Quarter Report Templates
Financial KPI quarterly report templates focus on tracking profitability, liquidity, and efficiency. You can monitor metrics like gross margin, cash flow, quick ratio, and return on equity. These KPIs help you evaluate quarterly earnings and understand the financial health of companies in Malaysia. For example, banks that reduced cost-to-income ratios by 5 percentage points saw an 18% increase in return on equity within two years. Companies rely on quarterly financial statements to identify risks and opportunities each quarter.
Performance Metric Category
Examples of KPIs Influenced by Financial KPI Quarterly Report Templates
Profitability
Revenue, Profit Margin, Net Income, EBITDA, Gross Profit Margin
Liquidity
Current Ratio, Quick Ratio, Cash Flow, Cash Conversion Cycle
Efficiency
Working Capital Efficiency, Accounts Receivable Turnover, Inventory Turnover
Leverage
Debt-to-Equity Ratio, Debt to Assets, Operating Leverage
Accounts Receivable Collection Period, Days Payable, Debtor Days
FineReport automates the collection and analysis of quarterly financial statements, making it easier for you to compare performance across companies and quarters.
Retail Marketing Quarterly Report Templates
Retail marketing relies on quarterly report templates to track sales, conversion rates, and customer behavior. Companies use these templates to analyze quarterly earnings, optimize marketing strategies, and improve customer retention. For instance, tracking metrics like sales per square foot and average order value helps you understand consumer trends each quarter. Studies show that over 70% of shoppers spend more during in-store visits, and 75% of retail spending is digitally influenced.
You can use FineReport to create interactive dashboards that display quarterly financial statements and marketing KPIs. This approach helps companies adjust strategies quickly, respond to seasonal changes, and maintain strong business performance in Malaysia every quarter.
Understanding financial reports helps you make better investment decisions. FineReport from FanRuan gives you the power to analyze data quickly and clearly. Advanced reporting tools automate your workflow, reduce errors, and let you focus on insights that matter. You can customize dashboards, visualize trends, and act on fresh data. Many investors in Malaysia use these tools to spot opportunities and respond to changes in earnings. Start applying these tips and explore solutions like FineReport to support your next investment move.
Click the banner below to try FineReport for free and empower your enterprise to transform data into productivity!
Real-time insights to optimize production, logistics, and decisions.
FAQ
What is the main purpose of a quarterly report?
You use a quarterly report to check a company’s financial health every three months. It helps you track revenue, expenses, and profit. This report lets you spot trends and make smart investment decisions.
How often do companies release quarterly reports?
Most public companies release quarterly reports four times a year. You usually see them at the end of March, June, September, and December. These regular updates keep you informed about the company’s progress.
Can FineReport help me compare data from different quarters?
Yes! FineReport lets you visualize and compare data from multiple quarters. You can use dashboards and charts to spot trends, track changes, and analyze key metrics side by side.
Why should I review all sections of a quarterly report?
Each section gives you different insights. The income statement shows profit, the balance sheet reveals stability, and the cash flow statement tracks money movement. Reviewing all sections helps you see the full picture.
What features make FineReport useful for investors?
FineReport offers automated data integration, real-time reporting, and customizable dashboards. You can schedule reports, visualize trends, and add comments. These features help you analyze financial data quickly and accurately.