
If you are searching for power bi report builder, you are probably trying to answer one practical question: Do I need this tool, or can I build everything in regular Power BI?
The short answer is simple. Power BI Report Builder is Microsoft’s tool for creating paginated reports—reports designed to print cleanly, follow exact layouts, and display detailed rows across multiple pages. It is not the same thing as the interactive reports and dashboards most people associate with Power BI.
For beginners, that distinction matters. Many teams start in Power BI Desktop expecting it to handle every reporting scenario, then discover they also need invoices, statements, operational listings, compliance documents, or scheduled PDF outputs. That is where Power BI Report Builder enters the picture.
Quick Comparison Table
| Criteria | Power BI Report Builder | Power BI |
|---|---|---|
| Best for | Paginated, print-ready, fixed-layout reports | Interactive dashboards and exploratory analysis |
| Ease of use | Better for structured reporting, but more technical for beginners | More approachable for visual analytics and self-service exploration |
| Dashboard design | Limited compared with interactive BI dashboards | Strong for interactive charts, dashboards, and storytelling |
| Data preparation | Works with datasets and report definitions for formal reporting | Strong visual modeling and analysis workflows in Power BI Desktop |
| Enterprise reporting | Well suited for pixel-perfect operational and formal documents | Well suited for monitoring, KPI tracking, and business analysis |
| Collaboration | Commonly consumed as published or exported reports | Strong for shared dashboards, filtering, and live exploration |
| Deployment | Useful when teams need scheduled distribution and formal outputs | Useful for ongoing analysis in the Power BI ecosystem |
| Learning curve | Higher if you are new to paginated report design | Easier for many business users starting with visual analysis |
| Recommended users | IT teams, report developers, finance, operations, compliance teams | Analysts, business users, managers, and data-driven departments |
For most teams, the choice comes down to this:
- Use Power BI Report Builder for pixel-perfect, printable, export-friendly reports
- Use Power BI for interactive dashboards, filtering, and self-service analytics
What Is Power BI Report Builder?
In plain language, Power BI Report Builder is a Microsoft report-authoring tool used to create paginated reports. A paginated report is a report built to fit a page layout precisely, often across multiple pages, with control over headers, footers, tables, grouped sections, and print formatting.
This makes it very different from the standard Power BI experience, where users interact with visuals on screen, click filters, and explore data dynamically.
How it fits into the Microsoft Power BI ecosystem
Power BI Report Builder is part of the broader Microsoft Power BI reporting environment, but it serves a specialized purpose. Instead of focusing on dashboard exploration, it focuses on formal report documents.
A typical workflow looks like this:
- Connect to a data source or dataset
- Build a paginated report layout
- Preview the report
- Publish it to the Power BI service
- Share, export, or distribute it to stakeholders
This means it complements Power BI rather than replacing it.
Designed for paginated, highly formatted reports
The easiest way to understand the tool is this:
- Power BI Report Builder = fixed-format reporting
- Power BI = interactive analytics
If your audience needs a report that looks the same every time, prints neatly, and preserves exact structure, Report Builder is likely the right tool. If your audience wants to click, slice, drill, and explore, standard Power BI is usually the better fit.
Why Power BI Report Builder Exists
A common beginner question is: Why does Report Builder exist if Power BI already lets me create reports?
The answer is that business reporting has two very different needs:
- Interactive analysis
- Formal document-style reporting
Power BI is strong for analysis. Report Builder exists because many organizations still depend on reports that must follow exact rules for layout, pagination, and distribution.
The business need for pixel-perfect reports
Not every report is meant to be explored on a screen.
Some must:
- Print cleanly on standard paper sizes
- Repeat headers across pages
- Preserve exact row and column alignment
- Follow a corporate or regulatory template
- Export consistently to PDF, Excel, Word, or CSV
These are often called pixel-perfect reports because spacing, alignment, and layout precision matter.
Common reporting scenarios
Organizations often use paginated reports for:
- Invoices
- Customer statements
- Inventory listings
- Financial statements
- Order summaries
- Compliance reports
- Operational shift reports
- Detailed transaction or audit reports
These are not dashboard-first use cases. They are document-first use cases.
Why not just use Power BI dashboards?
Because dashboards and interactive reports are designed for exploration, not strict formatting.
A Power BI dashboard can answer questions like:
- Which region is underperforming?
- What changed this month?
- Which products are driving margin?
But it is less ideal when you need:
- Every row shown in full
- Page breaks in the right place
- Repeating sections
- Formal headers and footers
- Scheduled PDF delivery to stakeholders
That is why Report Builder still matters, especially in finance, operations, government, healthcare, and compliance-heavy environments.
Power BI Report Builder vs Power BI: What’s the Difference?
The biggest difference is not branding or interface. It is reporting intent.
- Power BI Report Builder is for structured document output
- Power BI is for interactive data analysis and dashboards
Paginated reports vs interactive reports and dashboards
A paginated report is organized like a document. It is designed to break across pages, preserve formatting, and show all needed details.
An interactive Power BI report is designed like an analytical canvas. Users can click visuals, apply filters, drill into categories, and explore trends.
That means the user experience is completely different.
Paginated reports usually prioritize:
- Exact layout
- Large tables
- Repeating headers and footers
- Consistent export output
- Scheduled distribution
Interactive Power BI reports usually prioritize:
- User-driven filtering
- Visual summaries
- Drill-down exploration
- Dashboard storytelling
- Faster analytical decision-making
Layout flexibility, filtering, drill-through, and export options
Power BI Report Builder offers stronger control over fixed layouts. You can position elements precisely, define grouped sections, and format pages for export or printing.
Power BI offers stronger support for interactive filtering and visual exploration. Users can click on charts, cross-filter visuals, and navigate dashboards more fluidly.
In practice:
- Choose Report Builder when layout precision matters more than interactivity
- Choose Power BI when user exploration matters more than page design
Audience, use cases, and report consumption
The intended reader often decides the right tool.
Power BI Report Builder is often better for:
- Finance teams
- Operations reporting
- Compliance and audit users
- Users who receive scheduled documents
- Stakeholders who consume PDF or Excel outputs
Power BI is often better for:
- Analysts
- BI managers
- Department leaders
- Executives monitoring KPIs
- Business users exploring trends and drivers
How to decide quickly
Ask yourself one question:
Do I need a document, or do I need an analytical experience?
If you need a document, start with Power BI Report Builder.
If you need an analytical experience, start with Power BI.
When Power BI Report Builder Is the Better Choice
Power BI Report Builder is usually the better choice when:
- Reports must print cleanly across pages
- The layout must follow a strict template
- Stakeholders need PDF, Word, CSV, or Excel exports
- Reports must be scheduled for distribution
- The output includes large tables and grouped sections
- The report requires headers, footers, page numbers, and precise formatting
Typical examples include monthly financial packets, operational logs, account statements, and compliance-ready documents.
When Power BI Is the Better Choice
Power BI is usually the better choice when:
- Users want interactive visuals
- Teams need self-service exploration
- Stakeholders want to slice by region, time, product, or team
- Analysts need drill-down and trend analysis
- The goal is visual storytelling rather than print output
- The report will be consumed mostly online
Typical examples include executive dashboards, sales performance analysis, marketing funnel tracking, and operational KPI monitoring.
Key Features and How Power BI Report Builder Works
To beginners, Power BI Report Builder can feel more technical than Power BI Desktop. That is because it is closer to a formal report-design environment.
Still, the core building blocks are straightforward once you understand them.
Core concepts to know
Most paginated reports are built from these elements:
- Data sources: Where the report pulls data from
- Datasets: The specific query or data definition used in the report
- Parameters: Inputs that let users filter or customize report results
- Tables and matrices: Structured layouts for detail rows and grouped summaries
- Charts: Optional visuals for trends or comparisons
- Expressions: Logic used for calculations, formatting, and conditions
- Grouping and sorting: Ways to organize sections and repeated data
How report building works step by step
A beginner-friendly version of the workflow looks like this:
-
Connect to your data source
Start by pointing the report to a source such as a Microsoft data platform source, a semantic model, or another supported business dataset. -
Create a dataset
Define the data the report should use. This may be a query or an existing model connection. -
Choose a layout structure
Add a table, matrix, chart, or free-form design depending on the report type. -
Place fields into the report
Insert columns, labels, totals, grouped sections, or summary areas. -
Add parameters if needed
Let users filter by date, region, customer, product, or another reporting dimension. -
Format the report
Adjust spacing, alignment, headers, footers, styles, page size, and visibility rules. -
Preview and test exports
Check how the report renders across pages and how it looks as PDF or Excel. -
Publish and distribute
Send the report to the Power BI service for sharing or scheduled use.
How parameters, grouping, expressions, and exports support operational reporting
These features are especially important in real business reporting.
- Parameters help users generate targeted outputs, such as one report per region or per customer
- Grouping organizes detailed rows into business-friendly sections
- Expressions support calculations, formatting rules, and conditional logic
- Export options make it easier to distribute reports in the format stakeholders actually use
That is why Report Builder is often chosen for recurring, structured reporting processes.
What You Need to Get Started
If you want to try Power BI Report Builder, you typically need a few basics in place.
Download and setup
You can download the official Microsoft Power BI Report Builder tool from Microsoft’s official download channel. It is installed as a standalone report-authoring application.
For beginners, it helps to know that this is not the same install experience as Power BI Desktop. It is a separate tool with a different design purpose.
Permissions and data access
Before building a useful report, you usually need:
- Access to the relevant data source or dataset
- Appropriate permissions in the Power BI environment or connected source
- Clarity on what fields and filters the report should use
- Enough report design access to publish or share outputs where required
In many organizations, this means working with IT, BI, or data platform teams.
Learning curve for Power BI users
If you are coming from Power BI Desktop, expect a learning shift.
Power BI Desktop focuses on:
- visuals
- modeling
- interactive exploration
- dashboard thinking
Report Builder focuses on:
- pages
- tables
- datasets
- formatting precision
- export reliability
So while both belong to the same ecosystem, they solve different problems and require slightly different habits.
Common Use Cases, Limitations of Power BI report builder, and Beginner Tips
Understanding where power bi report builder shines—and where it does not—can save beginners a lot of time.
Common use cases
Power BI Report Builder is commonly used for:
- Invoices
- Financial statements
- Inventory listings
- Detailed sales registers
- Purchase order documents
- Compliance reporting
- Audit-ready operational reports
- Customer or vendor statements
These reports typically require complete detail, predictable formatting, and reliable export behavior.
When not to use Power BI Report Builder
It is usually not the best option for:
- Exploratory analysis
- Executive dashboarding
- Highly interactive KPI monitoring
- Rapid self-service analytics
- Data storytelling with frequent filter changes
- Business-user-driven dashboard exploration
If the user needs to ask follow-up questions visually and interact with the report live, Power BI is normally a better fit.
Common beginner mistakes
Here are some of the mistakes new users make most often:
-
Choosing Report Builder for dashboards
This leads to frustration because the experience is not optimized for interactive exploration. -
Choosing Power BI for document-style output
This often creates layout problems when teams need printable, pixel-perfect reports. -
Ignoring the audience
A finance controller and a sales manager may need completely different report formats. -
Underestimating formatting time
Paginated reports often require more precise layout work than beginners expect. -
Skipping export testing
A report may look fine on screen but break in PDF or Excel if not validated properly.
Simple decision checklist
Use this quick checklist before you start building:
- Do you need a fixed-format document? → Choose Power BI Report Builder
- Do you need interactive filtering and exploration? → Choose Power BI
- Does the report need to print across multiple pages cleanly? → Choose Power BI Report Builder
- Is the goal dashboard monitoring and analysis? → Choose Power BI
- Do stakeholders mainly want PDF or Excel distribution? → Lean toward Power BI Report Builder
- Do users want to click and investigate trends? → Lean toward Power BI
Practical Recommendations Before You Choose a Reporting Tool
From a BI consulting perspective, the best reporting decisions usually come from business requirements, not tool preference.
Here are five practical recommendations:
-
Start with the consumption format
Ask whether the final output should be a screen-based dashboard or a formal document. -
Design for the audience, not the builder
Executives, analysts, finance users, and frontline operators consume data differently. -
Test one real reporting scenario first
Build a sample invoice, financial statement, or KPI dashboard before standardizing the tool choice. -
Evaluate export and distribution needs early
Printing, PDF generation, Excel export, and scheduled delivery often shape the right architecture. -
Separate operational reporting from analytical reporting
Many organizations need both, and trying to force one tool to do both equally well can create unnecessary friction.
Beyond Power BI: When Teams Also Consider FineBI + Dora
Tools like Tableau and Power BI are widely used in the BI market, but teams that need a more business-user-friendly, self-service BI platform may also consider FineBI.
This is especially relevant if your reporting needs go beyond formal document output and into broader day-to-day analytics, dashboard adoption, and faster business-user exploration.
Where FineBI fits
FineBI is positioned as a self-service BI platform for business teams that want to create and consume interactive dashboards with less dependence on technical report development.
Relevant strengths include:
- Interactive dashboard creation
- Drag-and-drop analysis
- Self-service exploration for business users
- Drill-down and filtering workflows
- Enterprise data connectivity
- Dashboard sharing and collaboration
- Faster dashboard iteration across departments
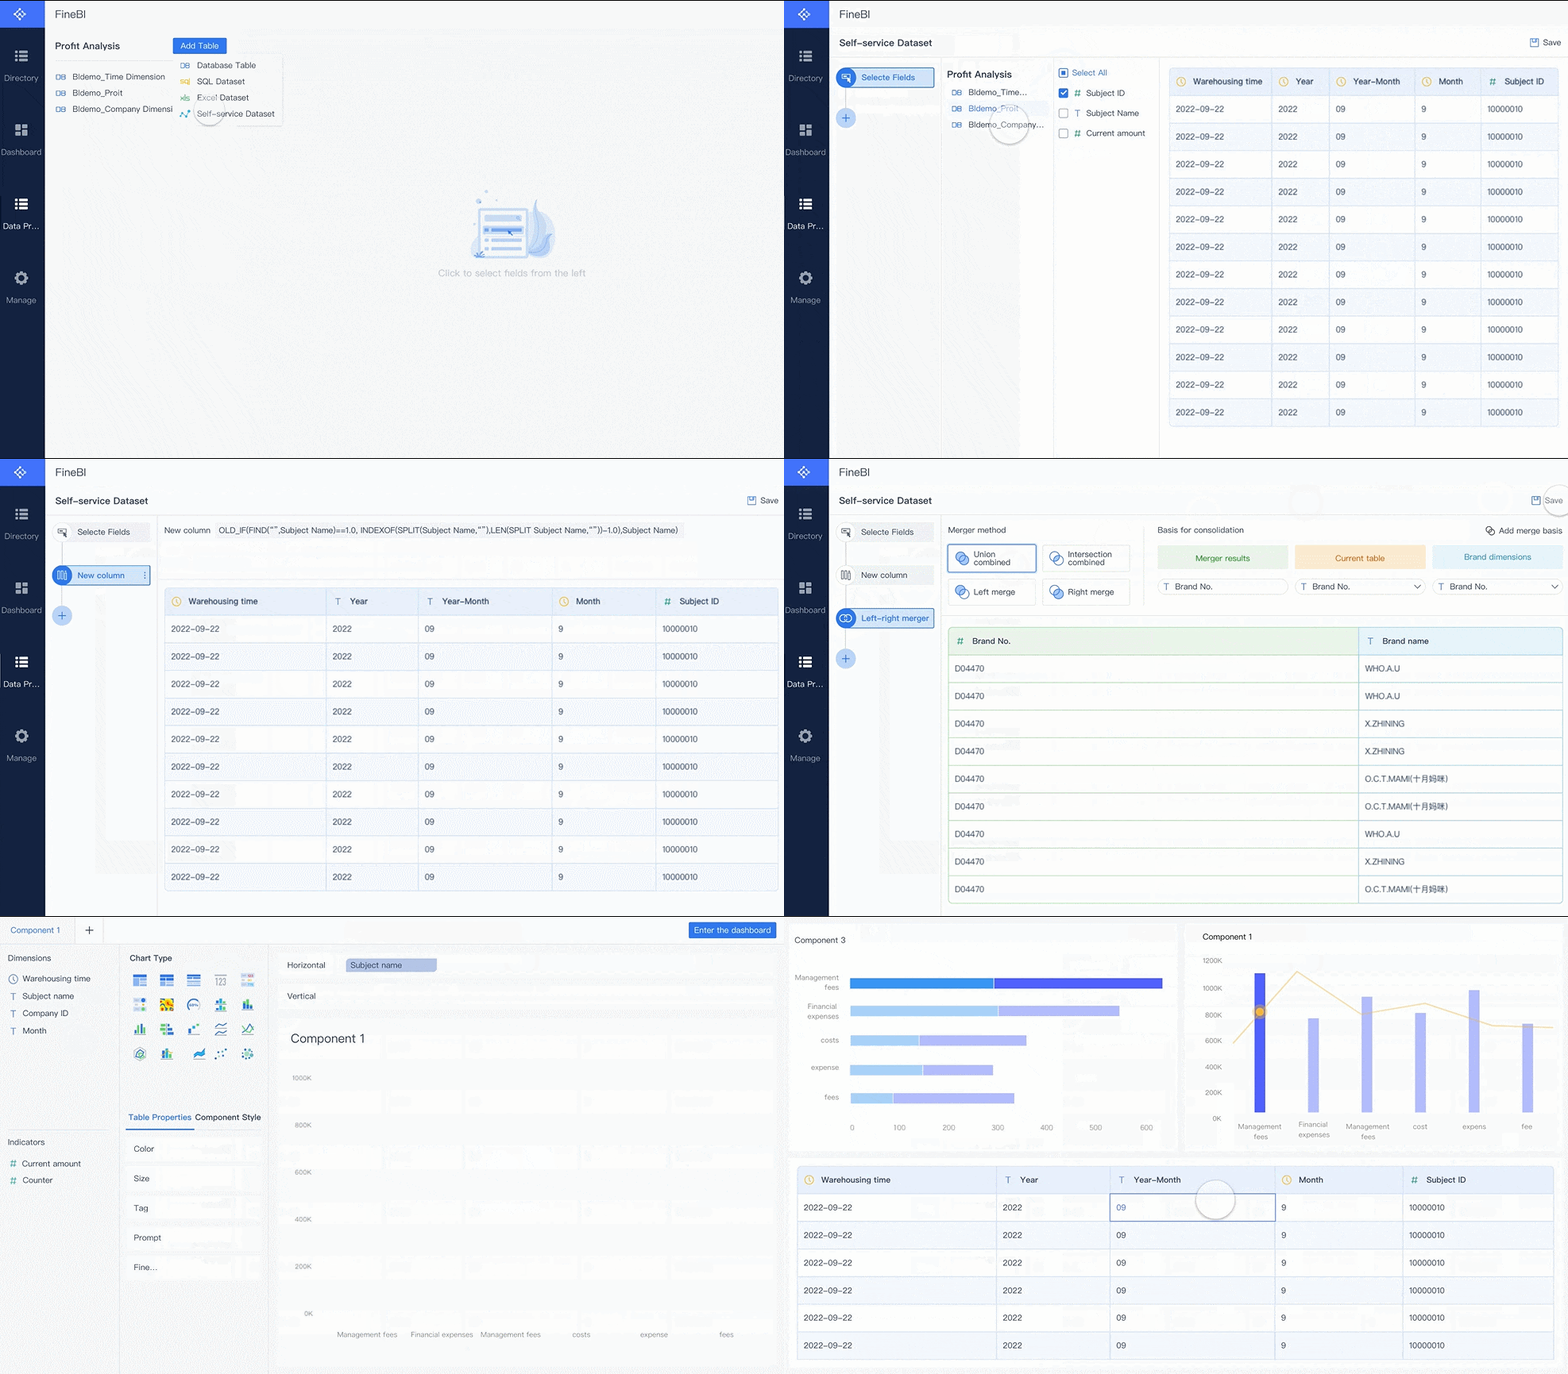 FineBI's Drag-and-drop Analysis
So if Power BI Report Builder feels too document-focused, and your actual need is broader business analytics, FineBI may be worth evaluating.
FineBI is not a replacement for paginated reporting use cases
It is important to stay practical here. If your main requirement is strict paginated report output, then tools built for formal report layout still have a clear role.
But many organizations discover that their larger reporting challenge is not just producing documents. It is also helping teams:
- monitor KPIs
- investigate issues
- share insights
- reduce reporting bottlenecks
- make dashboards more usable for business stakeholders
That is where FineBI becomes relevant.
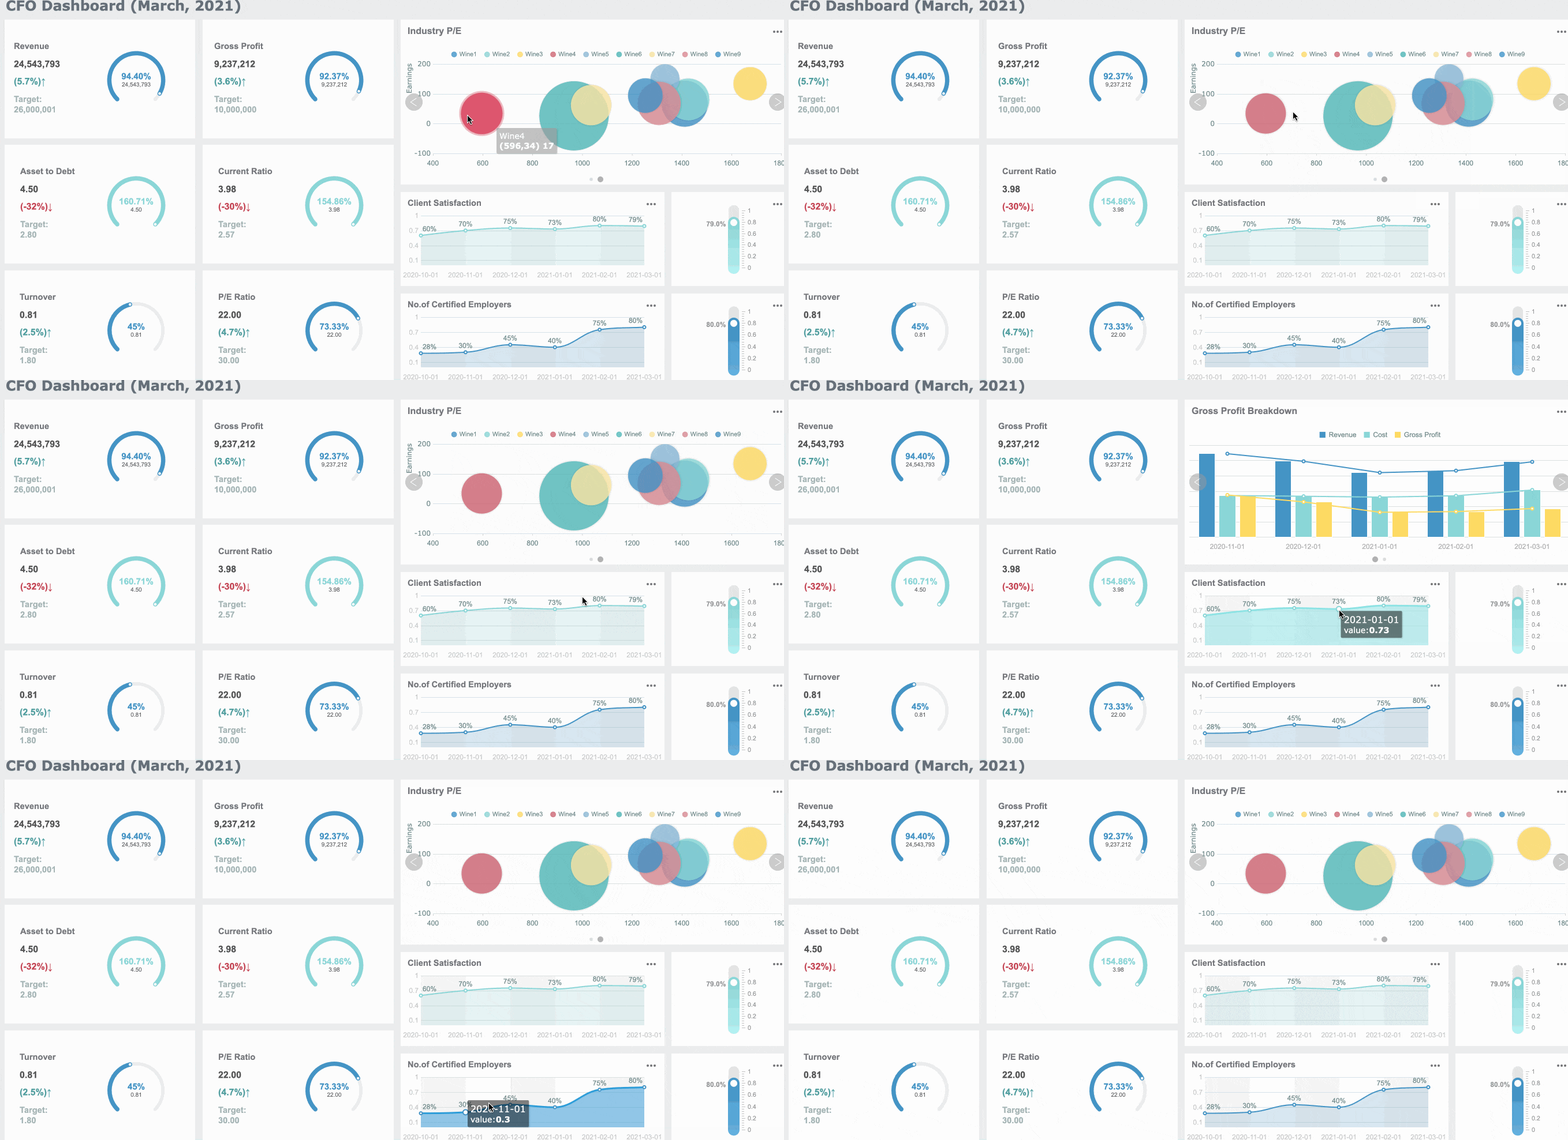 FineBI's Interactive Dashboard
How Dora extends FineBI into Agentic BI
Dora is FanRuan’s enterprise Data Agent platform. It acts as an AI assistant and AI digital employee layer on top of FineBI and existing enterprise data assets.
Together, FineBI + Dora helps organizations move from simply viewing dashboards to enabling AI-assisted business workflows such as:
- asking questions in natural language
- analyzing governed business metrics
- generating charts or summaries
- pushing alerts or updates
- following up on business exceptions
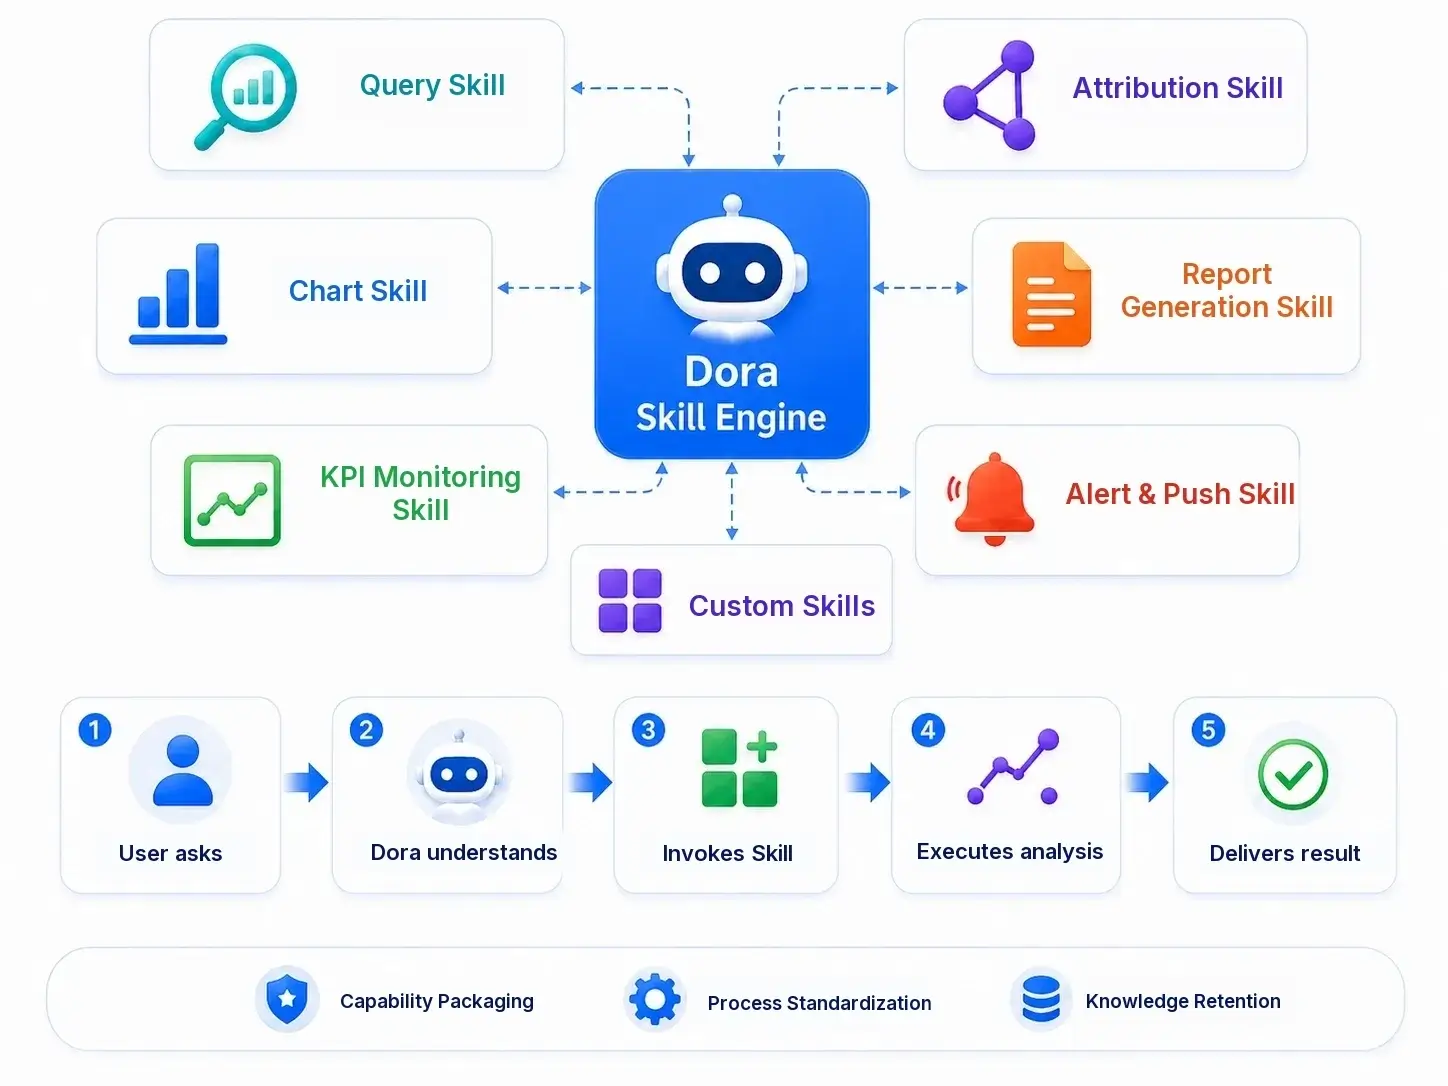
This is best understood as Agentic BI, not a generic chatbot layer.
Why the FineBI + Dora combination matters
The positioning is straightforward:
- FineBI builds the trusted dashboard, metric, and semantic foundation
- Dora turns that foundation into a scenario-specific AI assistant or digital employee
Depending on the use case, Dora can support roles such as:
- Data Analyst digital employee
- Report Researcher
- Daily Briefing Secretary
- Risk Alert Officer
For enterprises, this means BI can evolve from static dashboard consumption into a more governed AI workflow for analysis and follow-up.

Get Ready-to-Use Dashboard Templates in Fine Gallery
Final Takeaway: Should You Use Power BI Report Builder?
If you remember just one thing, remember this:
Power BI Report Builder is for paginated, print-friendly, highly formatted reports. Power BI is for interactive dashboards and analysis.
Use Power BI Report Builder when you need:
- invoices
- statements
- financial documents
- compliance reports
- detailed print-ready exports
Use Power BI when you need:
- KPI dashboards
- interactive filtering
- visual storytelling
- self-service exploration
- ongoing performance analysis
And if your bigger challenge is helping business teams adopt analytics more easily—while also preparing for governed AI-assisted workflows—then FineBI + Dora is a practical option to evaluate alongside mainstream BI tools.

FAQs
Power BI Report Builder is used to create paginated reports with fixed layouts that print cleanly and export consistently. It is best for documents like invoices, statements, detailed listings, and compliance reports.