Choosing the wrong report format creates real business friction. Teams waste time writing analysis when leaders only need facts — or worse, they submit raw data when management expects a recommendation. The result is slow decisions, unclear accountability, and reports that get ignored.
This guide explains the difference between informational and analytical reports, provides ready-to-use structure templates for each, shows where they overlap in common business reporting, and explains how tools like FineReport and Dora help teams produce both types consistently at scale.
Quick Answer: Informational Report vs Analytical Report
Factor
Informational Report
Analytical Report
Purpose
Present facts and status
Explain meaning and support decisions
Main question
What happened?
Why did it happen and what should we do?
Output
Summary, record, update
Conclusion, recommendation, action
Best for
Status reports, compliance reports, progress reports
If the reader asks "What is happening?", write an informational report. If the reader asks "What does this mean, and what should we do?", write an analytical report. Many business reports combine both: an informational section presents performance data, then an analytical section explains causes and recommends action.
What Is an Informational Report?
An informational report presents facts, status, events, or findings without prescribing what decision the reader should make. It answers questions like: What happened? What is the current status? What data was collected?
The writer's role is to gather accurate information, verify it, and present it clearly. The expected outcome is reader awareness, documentation, or shared understanding — not a decision.
Common informational report formats in business include:
Progress reports: Work completed, milestones reached, delays, next-period status
Incident reports: What happened, when, who was involved, immediate observations
Compliance reports: Whether standards, regulations, or internal controls were met
Inventory reports: Stock levels, movement, shortages, reorder status
Status / operational reports: Current conditions, timelines, system health, KPI snapshots
These reports matter because organizations need reliable visibility before they can act. A good informational report creates a trustworthy record that downstream analysis and decisions depend on.
What Is an Analytical Report?
An analytical report interprets evidence, compares alternatives, explains implications, and typically ends with a conclusion or recommendation. It answers questions like: Why did this happen? Which option is best? What should we do next?
The writer's role goes beyond recording. They must examine patterns, apply criteria, weigh risks, and explain the significance of the evidence. The expected outcome is a conclusion, a decision, or an approved recommendation.
Common analytical report formats in business include:
Feasibility reports: Whether a project, investment, or system change is practical
Evaluation reports: Performance, quality, or effectiveness of a product, program, or vendor
Recommendation reports: Options presented with an argued case for a specific action
Cost-benefit analysis reports: Financial and strategic value compared against expected costs
Root-cause analysis reports: Diagnosis of why a problem occurred and proposed corrective actions
Market analysis reports: Trends, competition, customer demand, and strategic opportunity interpreted into actionable insight
A monthly performance file with graphs may appear analytical, but if it only reports figures without judgment, it remains informational. A vendor assessment may begin with facts and tables, but once it weighs criteria and recommends a supplier, it becomes analytical.
Informational vs Analytical Reports: Key Differences
Purpose and expected outcome
The clearest distinction between these types of report is purpose.
An informational report is designed to present facts without prescribing action. It may communicate project progress, list compliance results, summarize incidents, or record inspection findings. The expected outcome is reader awareness, documentation, or shared understanding.
An analytical report is designed to support judgment and decision-making. It does not stop at facts. It interprets those facts, assesses alternatives, and often points toward a preferred course of action. The expected outcome is a conclusion, a decision, or an approved recommendation.
A simple rule works well:
If the reader asks, “What is happening?”, write an informational report.
If the reader asks, “What does this mean, and what should we do?”, write an analytical report.
Research, evidence, and level of interpretation
Both report types rely on evidence, but the treatment of that evidence is different.
Informational reports typically involve straightforward collection and organization of data. The writer’s role is to gather accurate information, verify it, and present it clearly. This is more about recording and reporting than interpreting.
Analytical reports require another layer: evaluation. The writer must examine patterns, compare alternatives, apply criteria, weigh risks, and explain the significance of the evidence. Here, the writer becomes more than a recorder. They become an evaluator.
That shift matters. In operational reporting, for example, listing downtime by system is informational. Explaining that downtime increased because of vendor latency, outdated hardware, and understaffed support coverage is analytical. Recommending a phased infrastructure upgrade pushes the report further into analytical territory.
Tone, structure, and reader expectations
Tone also separates these types of report.
Informational reports usually aim for a neutral, objective presentation. They prioritize clarity, accuracy, and completeness. The reader expects concise sections, straightforward language, and clean presentation of facts.
Analytical reports still need objectivity, but they often use a more argument-supported style. The writer connects evidence to conclusions. The tone remains professional, but the structure reflects reasoning, trade-offs, and judgment.
Different readers also expect different levels of insight:
Executives often want a short path from evidence to implication.
Managers often need both facts and interpretation.
Instructors may expect a clear distinction between summary and evaluation.
Clients typically want evidence translated into business impact.
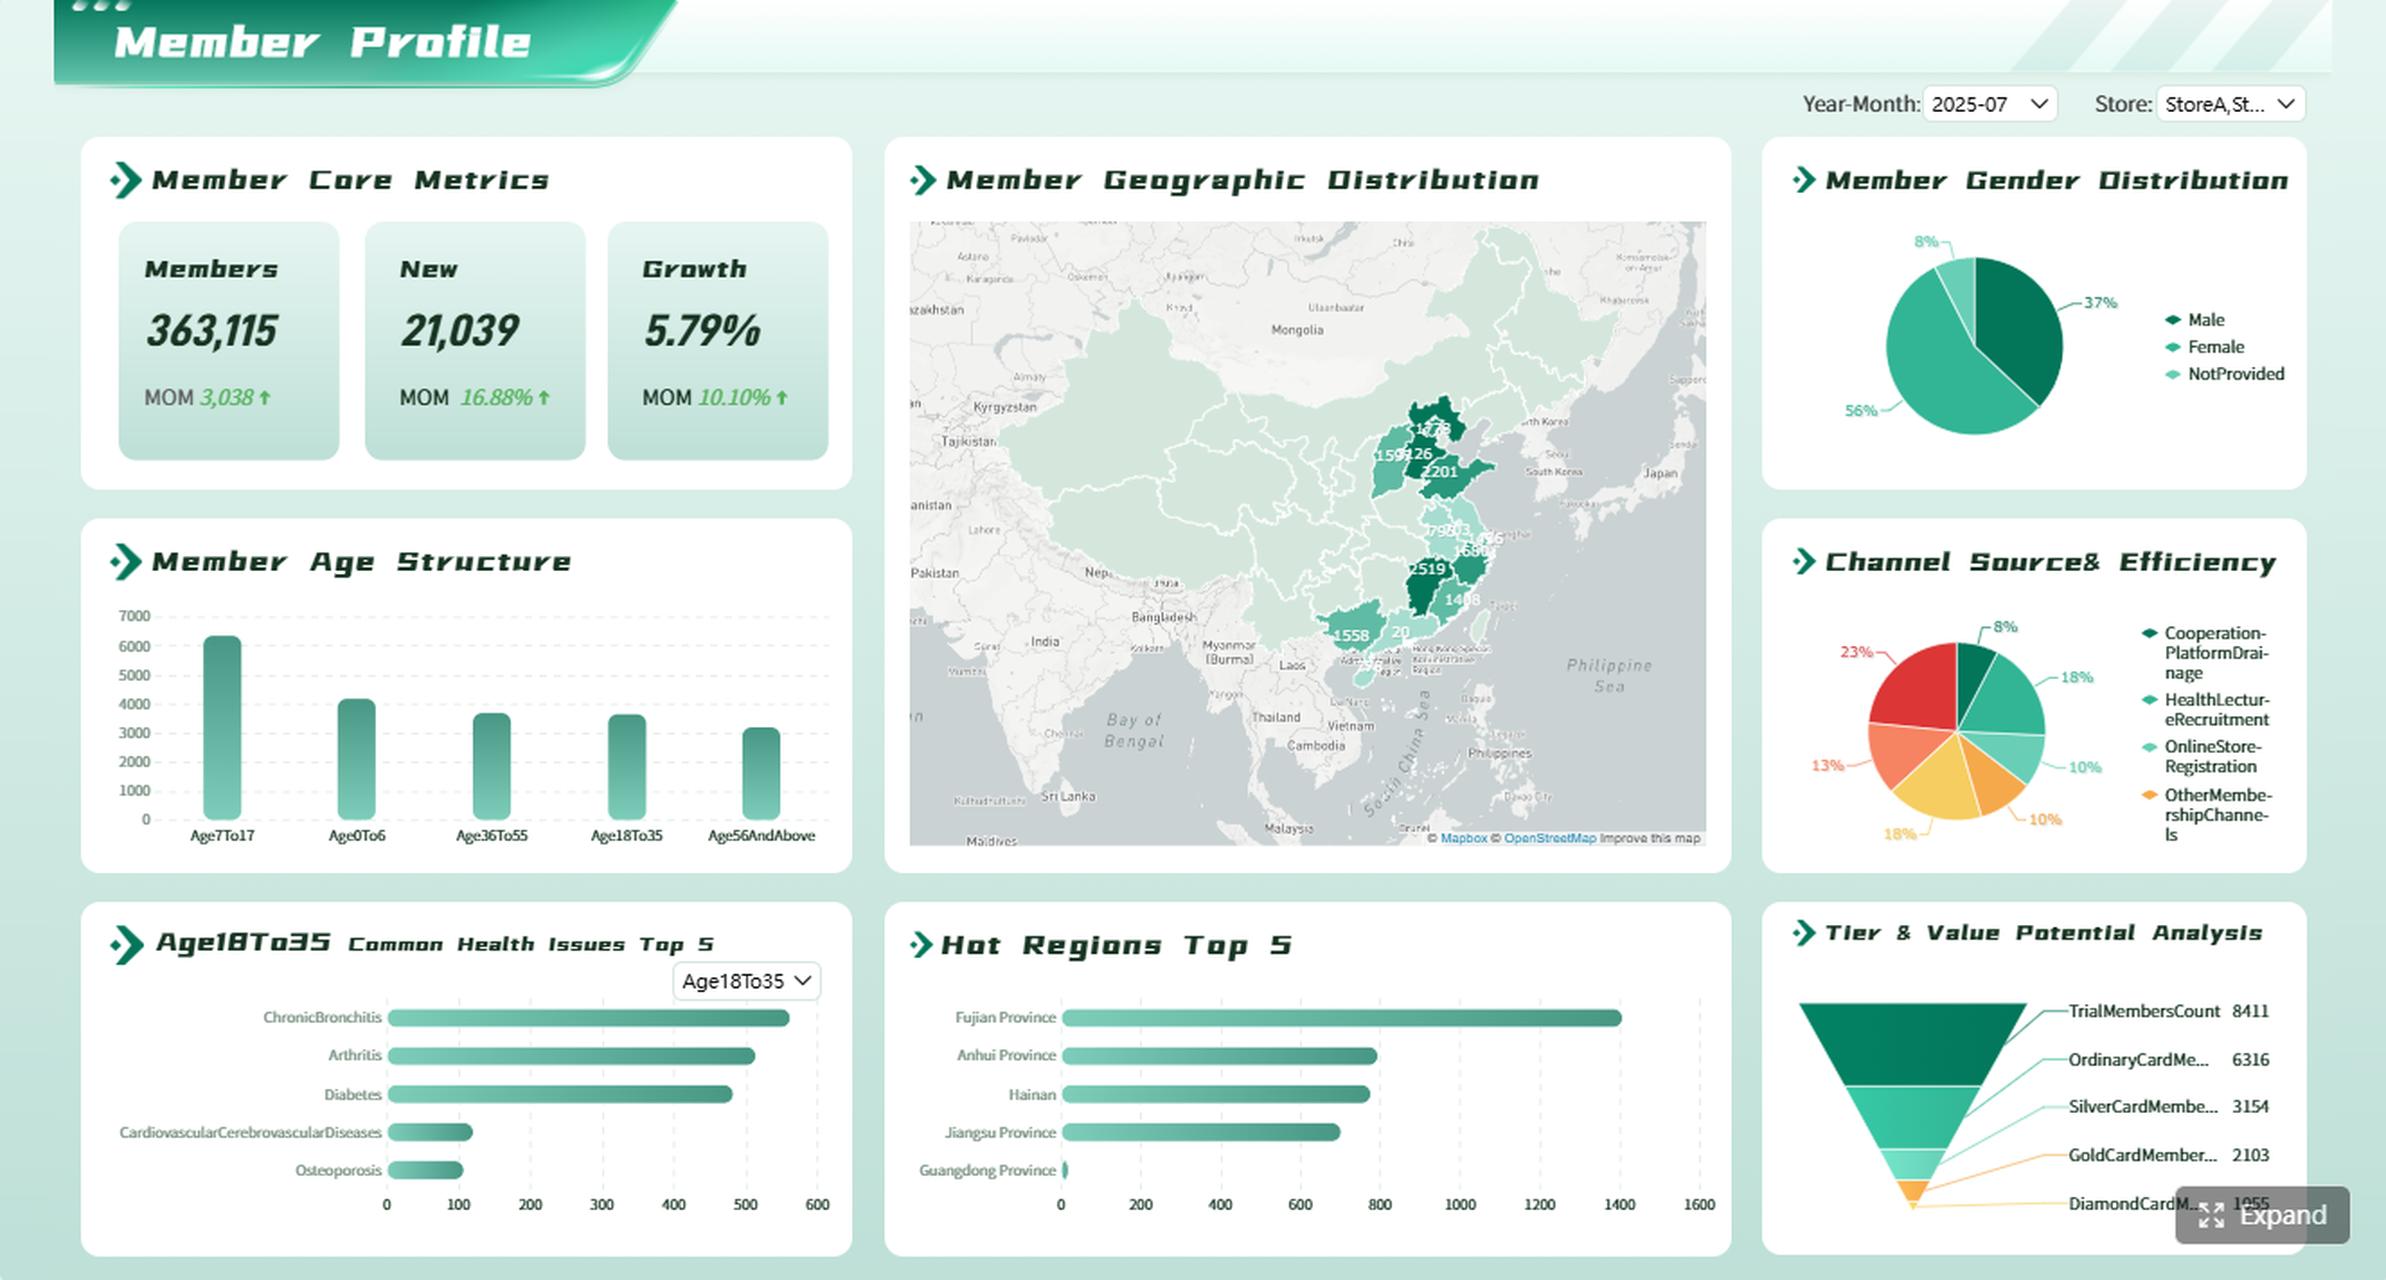
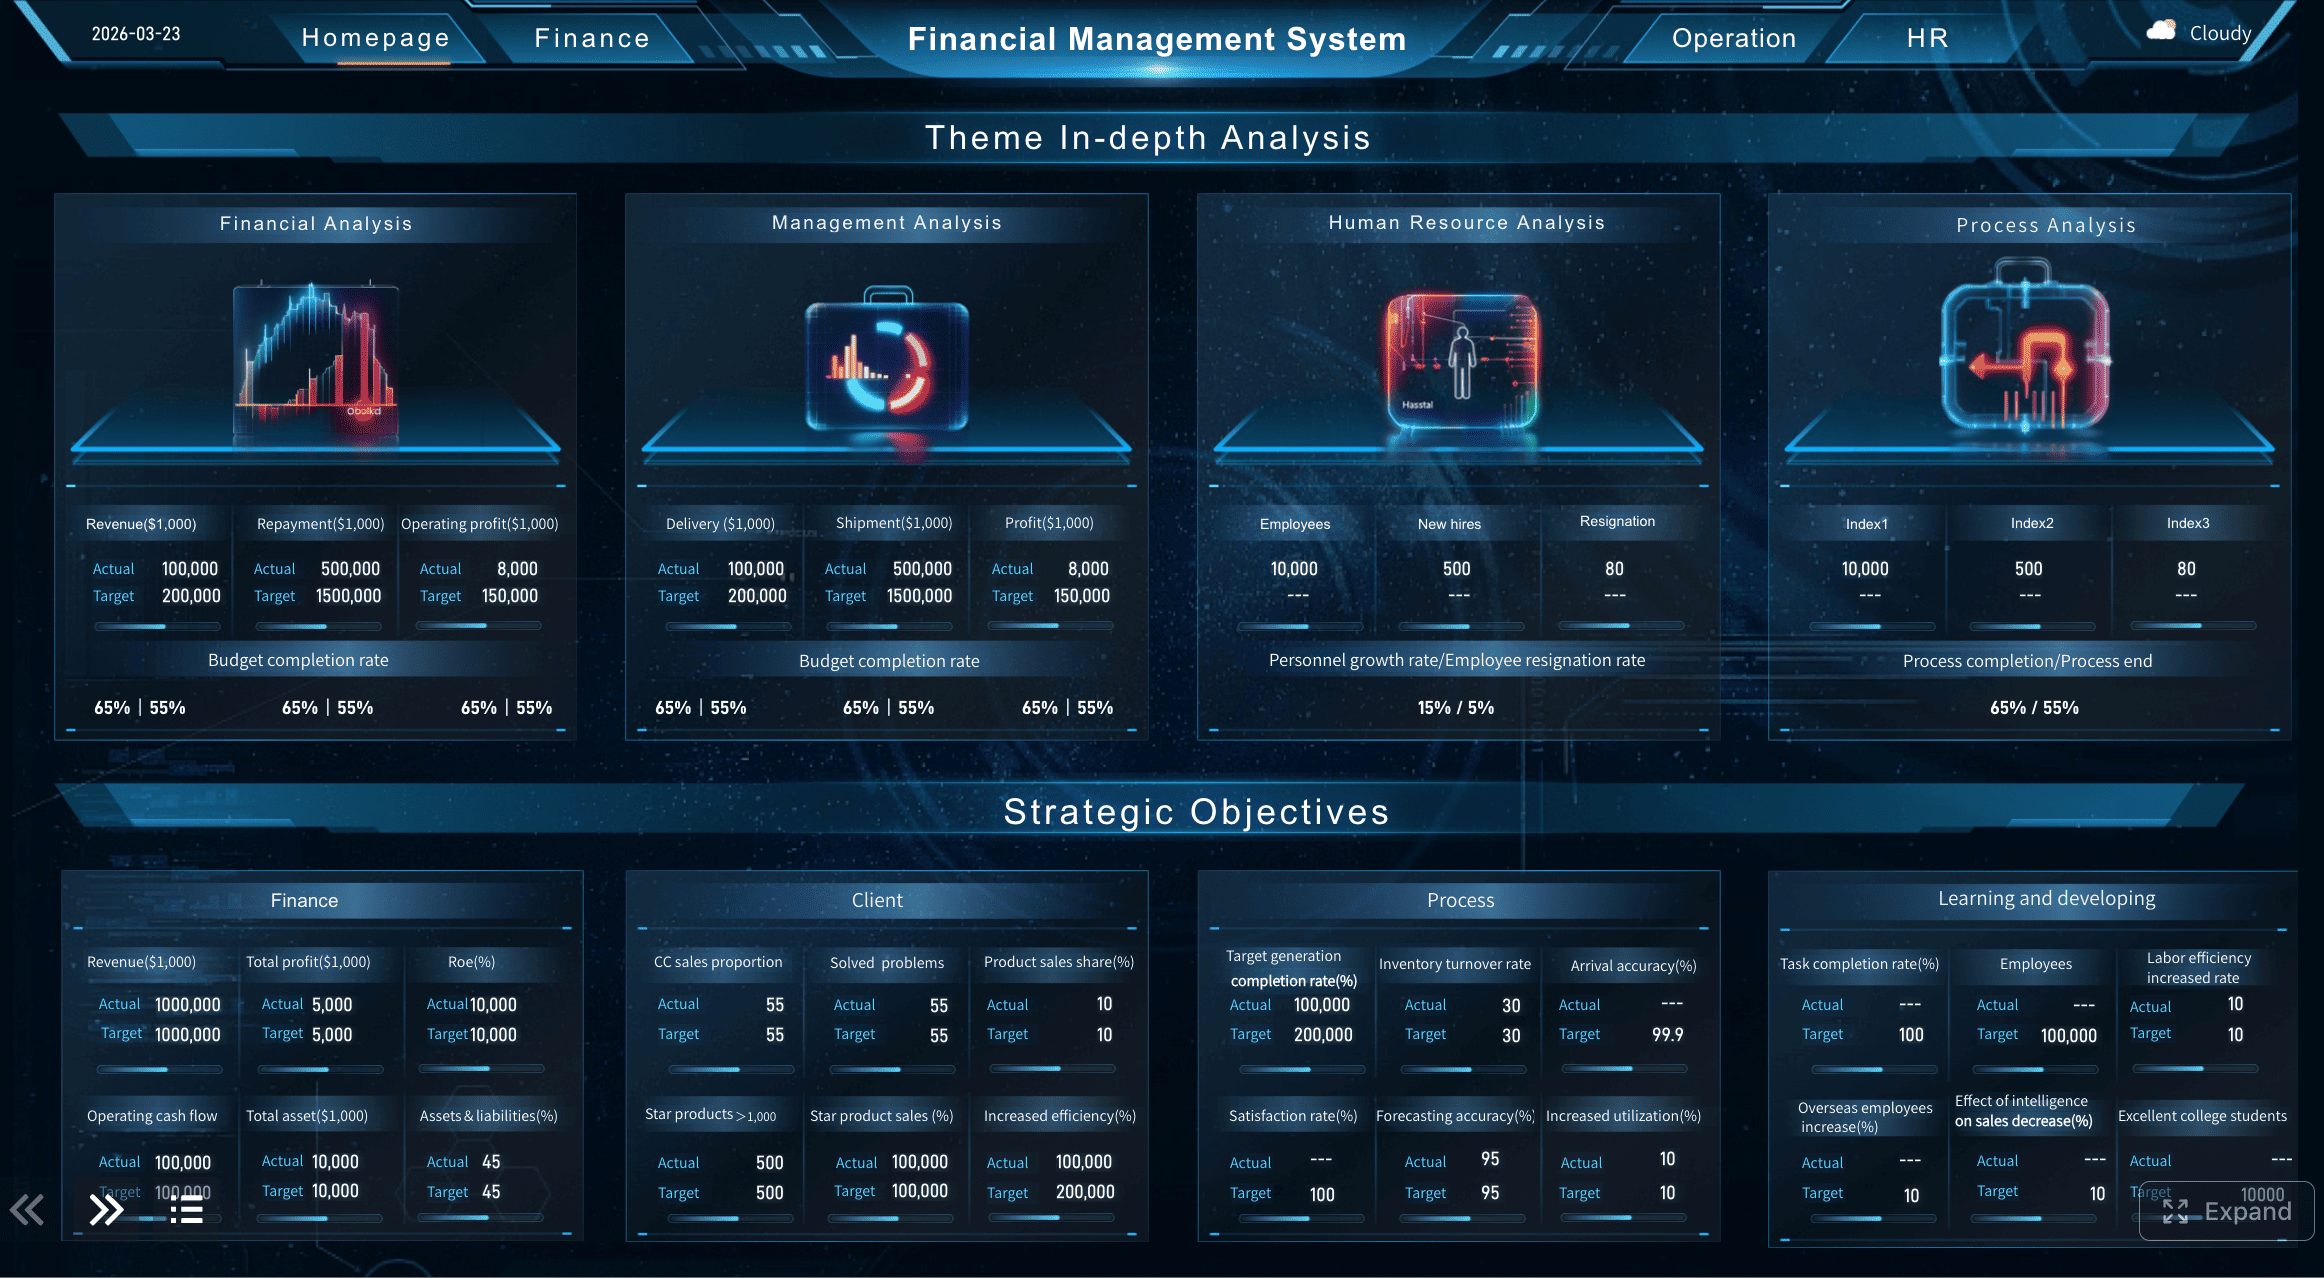
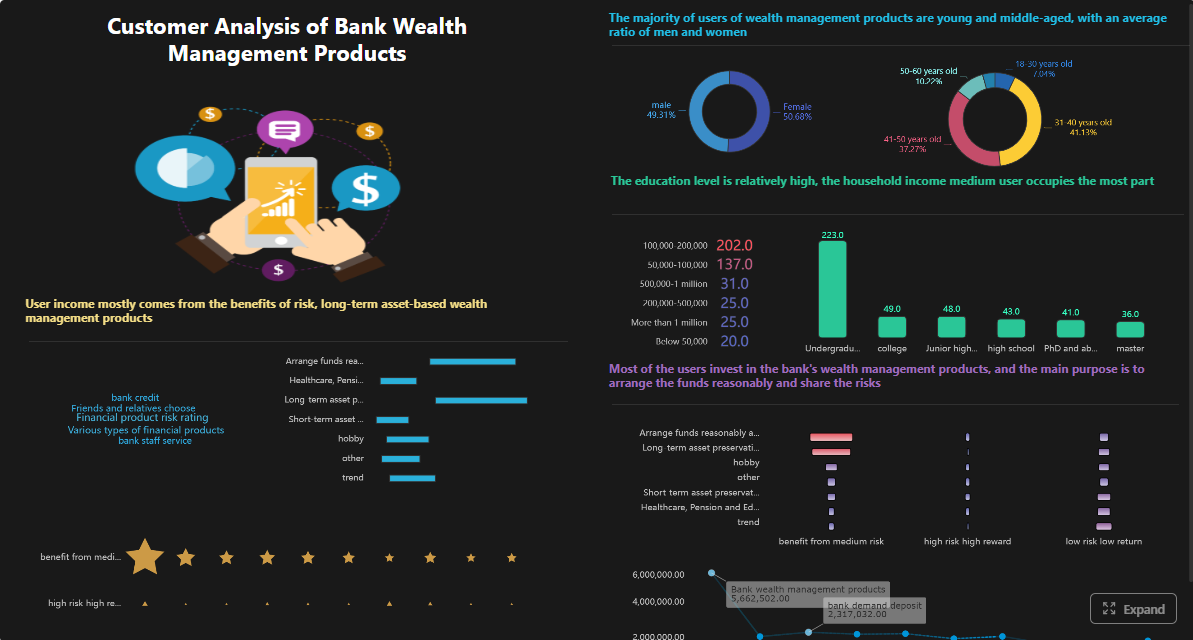
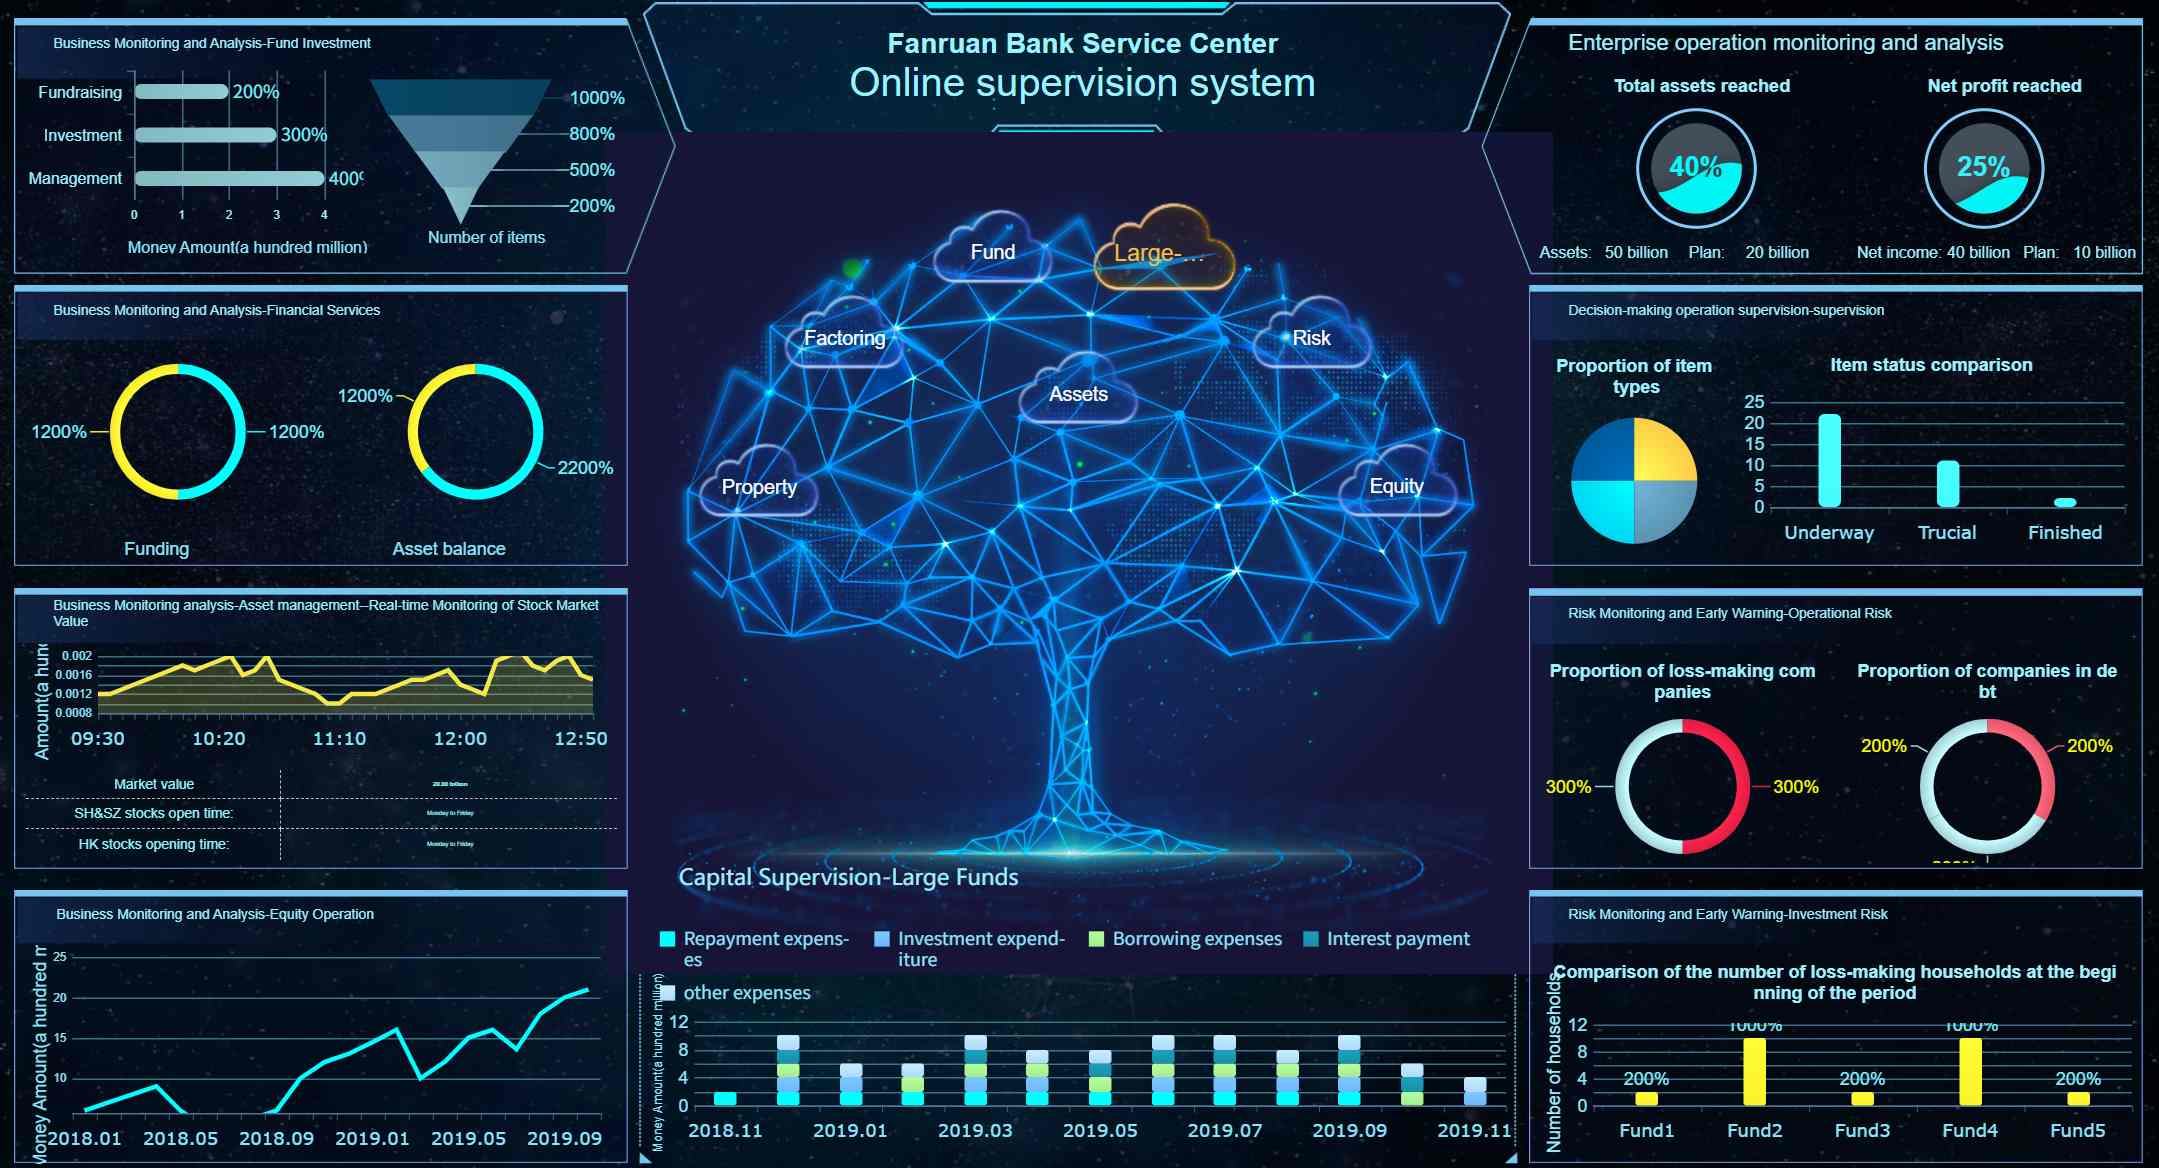
All reports in this article are built with FineReport.
When to Use Each Type of Report
Use these questions to choose the right format:
Question
Points Toward Informational
Points Toward Analytical
Is the goal to document or to decide?
Document
Decide
Does the audience need visibility or judgment?
Visibility
Judgment
Is the issue routine or high-stakes?
Routine
High-stakes
Do you have enough evidence to support a conclusion?
Not yet / not needed
Yes, sufficient for recommendation
Will the reader expect a recommendation?
No
Yes
How often will this report be produced?
Daily / weekly / monthly
One-time or quarterly / annual
When in doubt, ask: "After reading this report, does the reader need to take a specific action based on my interpretation?" If yes, use an analytical format. If the reader simply needs to know the current state, use an informational format.
Many effective business reports blend both. An executive weekly review may open with informational KPIs, then shift into analytical commentary explaining variances and recommending corrective actions. Structure the report so each section's purpose is immediately clear to the reader.
Informational Report Structure and Examples
Standard Structure
Section
Content
Title
Report name, date range, author/department
Purpose
Why this report exists; what it covers
Scope
Time period, process, department, or system covered
Findings
Facts, observations, measurements, status updates
Summary
Key points restated concisely, without interpretation
Appendices
Supporting records, raw data, detailed logs
These report formats are primarily factual and descriptive:
Progress reports: Summarize work completed, milestones reached, delays, and next reporting period status.
Incident reports: Document what happened, when it happened, who was involved, and immediate observations.
Compliance reports: Show whether standards, regulations, or internal controls were met.
Inventory reports: Present stock levels, movement, shortages, and reorder status.
Status reports: Update stakeholders on current conditions, timelines, or operational health.
These reports matter because organizations need reliable visibility before they can act. A good informational report creates a trustworthy record.
Get Ready-to-Use Dashboard Templates in Fine Gallery
Common Business Report Types That Combine Both
In practice, many recurring business reports contain both informational and analytical sections. Recognizing this hybrid structure helps teams design templates that serve both purposes without conflating them.
Root cause analysis, prevention recommendations, SLA impact assessment
Design these reports with clearly labeled sections so readers know when they are consuming facts versus interpretation. Mixing the two without structural separation erodes trust and makes reports harder to scan.
How FineReport Helps Build Recurring Business Reports
Most informational reports — and many hybrid reports — are recurring. They follow the same structure, pull from the same data sources, and distribute to the same stakeholders on a fixed schedule. Manual production of these reports consumes significant time and introduces version inconsistency.
FineReport helps teams standardize and automate recurring business reports across both informational and analytical formats:
Template-based report design: Build reusable report layouts for status reports, compliance filings, operational dashboards, and executive reviews. Parameterized templates adapt to different date ranges, departments, or entities without redesign.
Direct data source connectivity: Connect to databases, APIs, ERP, CRM, and spreadsheets. Reports pull live or scheduled-refresh data, eliminating manual copy-paste and ensuring consistency.
Scheduled generation and distribution: Configure reports to generate automatically at defined intervals and distribute via email, portal, mobile app, or webhook. Stakeholders receive fresh reports without manual intervention.
Role-based access and permissions: Control which users see which reports, sections, or data rows. Governance is built into the report platform rather than managed through file-sharing permissions.
Export flexibility: Generate PDF, Excel, Word, or HTML outputs from the same template, serving different consumption needs without maintaining parallel versions.
Flexible Report Designer
FineReport's Data Connection
For teams producing daily, weekly, or monthly business reports, FineReport shifts effort from repetitive report assembly to higher-value analysis and decision-making.
How Dora Helps Turn Reports into Follow-up Analysis
FineReport helps teams standardize and automate recurring reports. Dora can add an AI analysis layer on top of trusted report data. For example, after a weekly operations report is generated, Dora can summarize key changes, explain possible causes, highlight anomalies, and prepare follow-up questions for managers.
Reporting Task
FineReport
Dora
Recurring report generation
Builds templates and scheduled reports
Summarizes report changes
Operational status updates
Delivers structured dashboards and reports
Explains what changed
Analytical follow-up
Provides governed report data
Helps ask why and what to check next
Executive briefings
Produces formal report outputs
Generates concise insight summaries
Dora operates on governed report assets produced by FineReport. It does not replace structured reporting; it accelerates the transition from "report received" to "insight acted upon." Business users get natural-language access to report content while IT maintains full control over data definitions, permissions, and distribution.
An informational report presents facts, updates, or findings without telling the reader what action to take. An analytical report interprets the evidence, explains what it means, and often recommends a next step.
Use an informational report when the goal is to document status, share facts, or provide routine visibility. It works best when the audience needs clear records rather than evaluation or recommendations.
An analytical report should include relevant data, interpretation, comparison of options or causes, and a conclusion. In many business cases, it also ends with a recommendation based on the analysis.
Yes, many reports begin with factual background and then move into analysis. The report becomes analytical once it starts evaluating evidence, explaining implications, or recommending action.
Start with the audience’s purpose: whether they need awareness, explanation, or a decision. Factors like seniority, urgency, risk, and whether action is expected help determine the right format.
Product Trial
FineReport
Pixel-perfect reports · Interactive dashboards · Easy data entry · Digital twins



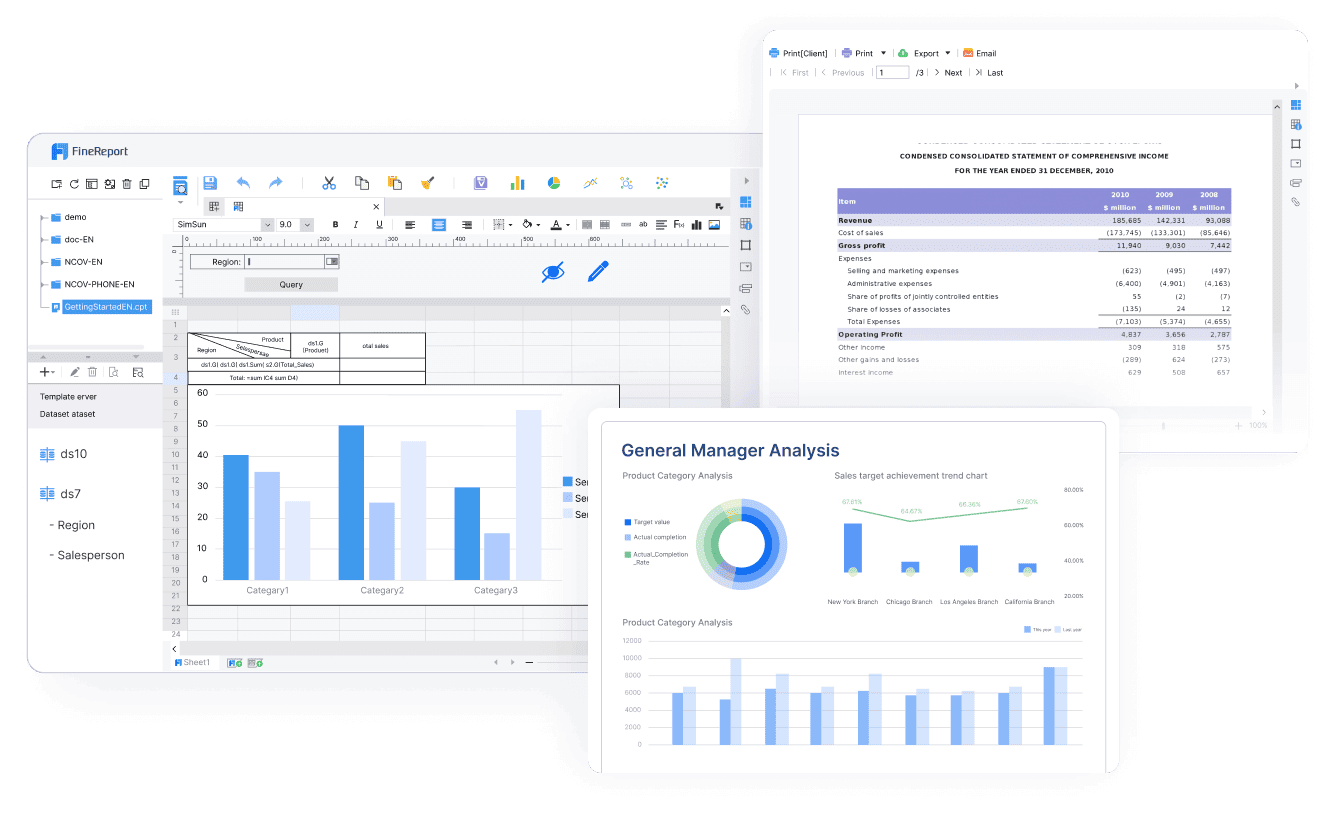 Flexible Report Designer
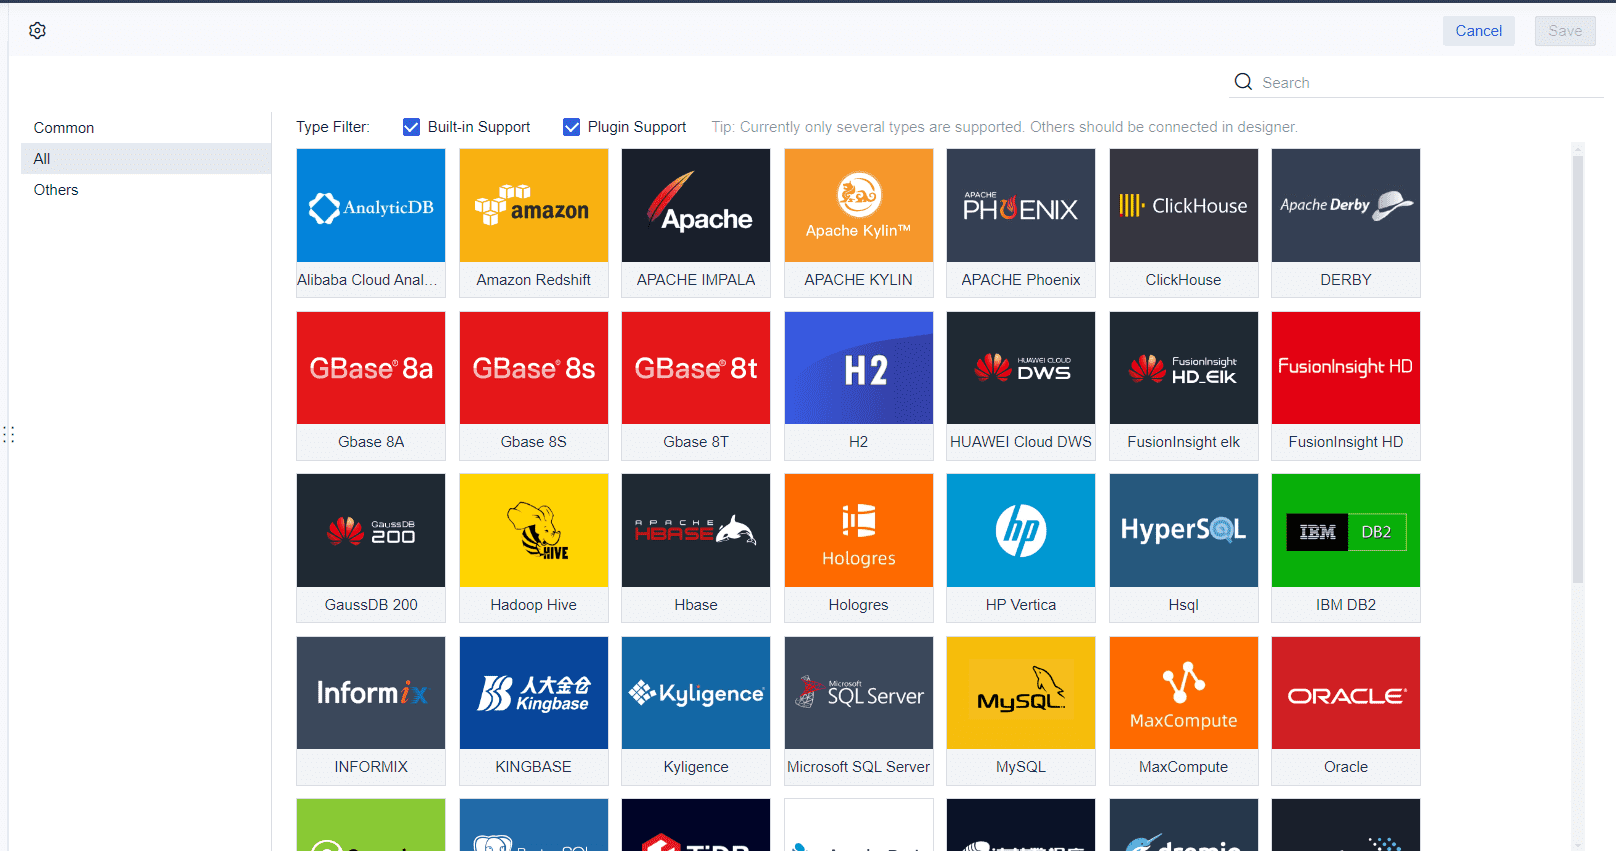 FineReport's Data Connection






