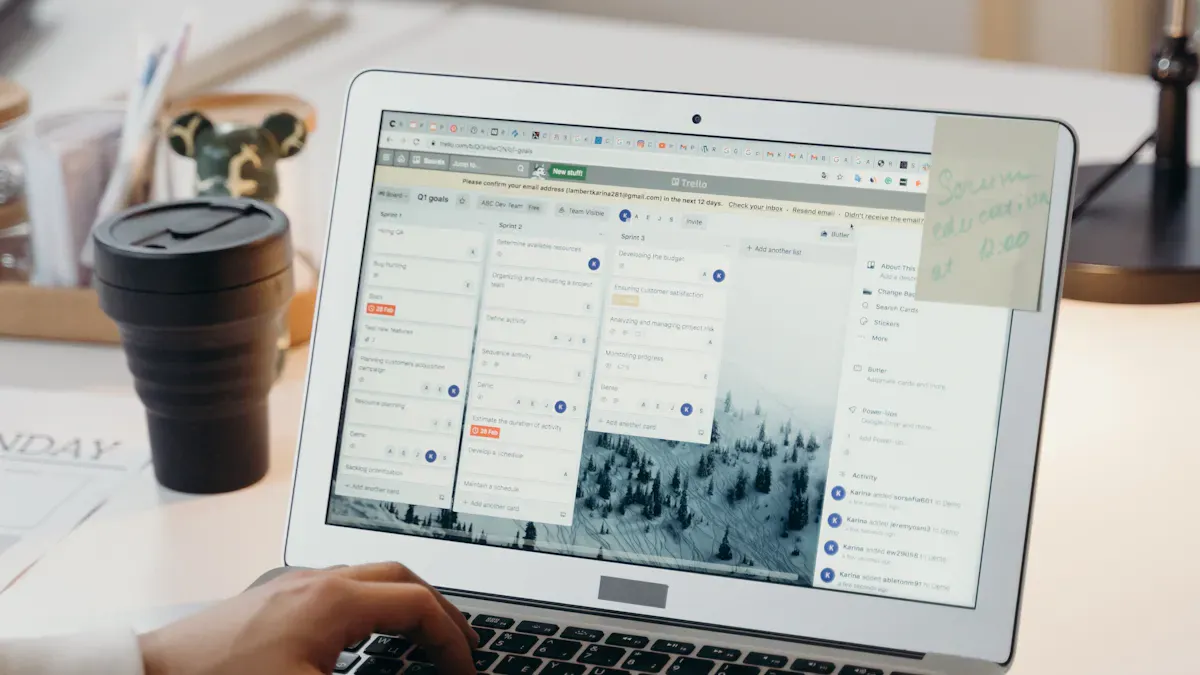
You use a workflow dashboard to check tasks and see progress. You can also look at what your team is doing in one spot. The dashboard helps you get more work done by showing data from many places. FineReport by FanRuan lets you make dashboards and share info easily. You make a simple workspace that helps your team stay neat and work as a group.
What Is a Workflow Dashboard?
A workflow dashboard is a tool that helps you and your team see all your tasks and projects in one place. You can track progress, spot problems early, and make better decisions. This dashboard brings together information from different sources, so you do not have to switch between apps or spreadsheets.
Key Features and Benefits
You will find many helpful features in a workflow dashboard. These features make your daily work easier and help your team stay organized. Here is a table that shows some of the most common features and what they do:
| Feature | Description |
|---|---|
| Status tracking | Lets you see if tasks are not started, in progress, or completed. |
| Notification systems | Sends alerts and reminders for deadlines and changes. |
| Task lists | Shows all assigned tasks, sub-tasks, due dates, and team members. |
| Project views | Offers Kanban boards, Gantt charts, and calendar views for managing tasks. |
| Real-time insights and reporting | Gives you live data to help you make decisions and watch performance. |
| Overview/At a Glance Feature | Lets you see all tasks quickly for better management. |
| Timely Notifications | Keeps everyone updated about activities and emergencies. |
| Parallel workflows | Allows team members to work on different tasks at the same time. |
These features help you track progress, stay on schedule, and keep everyone informed. You can spot trends, find bottlenecks, and adjust your plans quickly.
Why Teams Need Workflow Dashboards
You need a workflow dashboard to help your team work better together. It gives you real-time updates, so you always know what is happening. You can see who is working on what and how close you are to your goals.
- You get better alignment across your team. Everyone works toward the same priorities.
- You see who is doing well and who needs help. This increases accountability.
- You use current data to make smart decisions and plan your next steps.
- You spot problems before they grow. This helps you solve issues early.
- You improve your meetings. Everyone comes prepared with the latest information.
A dashboard brings clarity and focus to your team. You can track both group and individual goals, making sure everyone stays on the right path.
Essential Components for WorkflowDashboards
A successful task dashboard needs several key parts to help your team work better. You want a clear structure so everyone knows their job. You need automation to handle simple steps. Consistency keeps your results steady. Visibility lets you see progress and spot problems. Flexibility helps you adjust when things change. These parts make your task dashboard strong and reliable.
Data Integration with FineReport
You use FineReport to connect all your data in one place. This makes your task dashboard powerful. You can pull information from databases, files, and APIs. FineReport breaks down data silos, so your team sees everything they need. You can use ETL and ELT to move and change data. Real-time sync keeps your task dashboard up to date. The Data Service function lets you share data with other apps. You can also schedule tasks to run at the right time. Here is how FineReport helps your task dashboard:
| Feature | Description |
|---|---|
| Connect to various data sources | You can link databases, files, and APIs for a complete view in your task dashboard. |
| Break down data silos | FineReport moves data smoothly between systems, making your process easier. |
| Support for ETL and ELT processes | You can clean and shape data for your task dashboard. |
| Real-time incremental data sync | Your task dashboard always shows the latest updates. |
| Data Service function | Share data with other tools to improve your process. |
| Flexible task management | Schedule and manage tasks to keep your process running well. |
You can connect to many types of data sources with FineReport. Here are some examples:
| Data Source Type | Description |
|---|---|
| Databases | Connects to many database systems for your task dashboard. |
| Files | Use Excel, CSV, or other files in your process. |
| APIs | Bring in data from outside apps to your task dashboard. |
With these features, your task dashboard becomes the center of your team's work. You can track every process and see project status at a glance.
Customization and User Roles
You can change your task dashboard to fit each person’s job. Customization lets you control what you see and do. This helps you focus on your own process. For example, managers can see big goals, while team members see their daily tasks. You can set up your task dashboard for different roles, like executives, managers, or staff. This makes your process smoother and faster.
A study in 2022 showed that custom dashboards for each role make teams work better. You should follow these steps for user roles:
- Define clear roles and responsibilities for your task dashboard.
- Match workflows to your process and automate steps.
- Give only the permissions needed for each role.
- Check and update roles often to keep your process safe.
You should also review permissions often. Give each user only what they need. This keeps your task dashboard secure and your process strong.
With the right setup, your task dashboard supports every process, keeps your data safe, and helps your team reach their goals.
Creating a Workflow Dashboard with FanRuan
Define Objectives and Metrics
You start creating a workflow dashboard by setting clear goals. You need to know what you want your team to achieve. This step helps you focus on what matters most. Follow these steps to define your objectives and metrics:
- Set clear goals for your workflow creation. Decide what you want to improve or track.
- List all tasks that your team needs to complete.
- Decide the order of these tasks and see which ones depend on others.
- Assign people and tools to each task.
- Draw diagrams or make notes to show how your workflow creation will look.
When you choose metrics, make sure they match your project goals. Pick numbers that help you see progress. Update your metrics often so your team always has the latest information. Keep your dashboard simple and easy to read. Good metrics help your team work together and reach group goals. Review your dashboard with your team to make sure it fits your needs. Remove old or unused metrics to keep your workflow dashboard clear.
Choose Tools and Connect Data Sources
You need the right tools for efficient workflow creation. FineReport gives you a drag-and-drop interface that makes workflow creation simple. You do not need to write code. You can connect to many data sources, like databases, Excel files, and APIs. This helps you see all your information in one place.
When you choose a tool, look for these features:
- Easy-to-use interface for workflow creation
- Process mapping and task management
- Automation for routine steps
- Permissions for different users
- Strong reporting and analytics
- Integration with other systems
FineReport lets you connect data sources safely. It uses enterprise-grade encryption and role-based access. This keeps your data safe. You can use the drag-and-drop interface to link your data without coding. Here is a table that shows how FineReport protects your data:
| Feature | Description |
|---|---|
| Enterprise-grade encryption and role-based access | Keeps your data safe when you connect sources to your workflow dashboard. |
| Drag-and-drop data integration | Lets you connect data easily, even if you do not know how to code. |
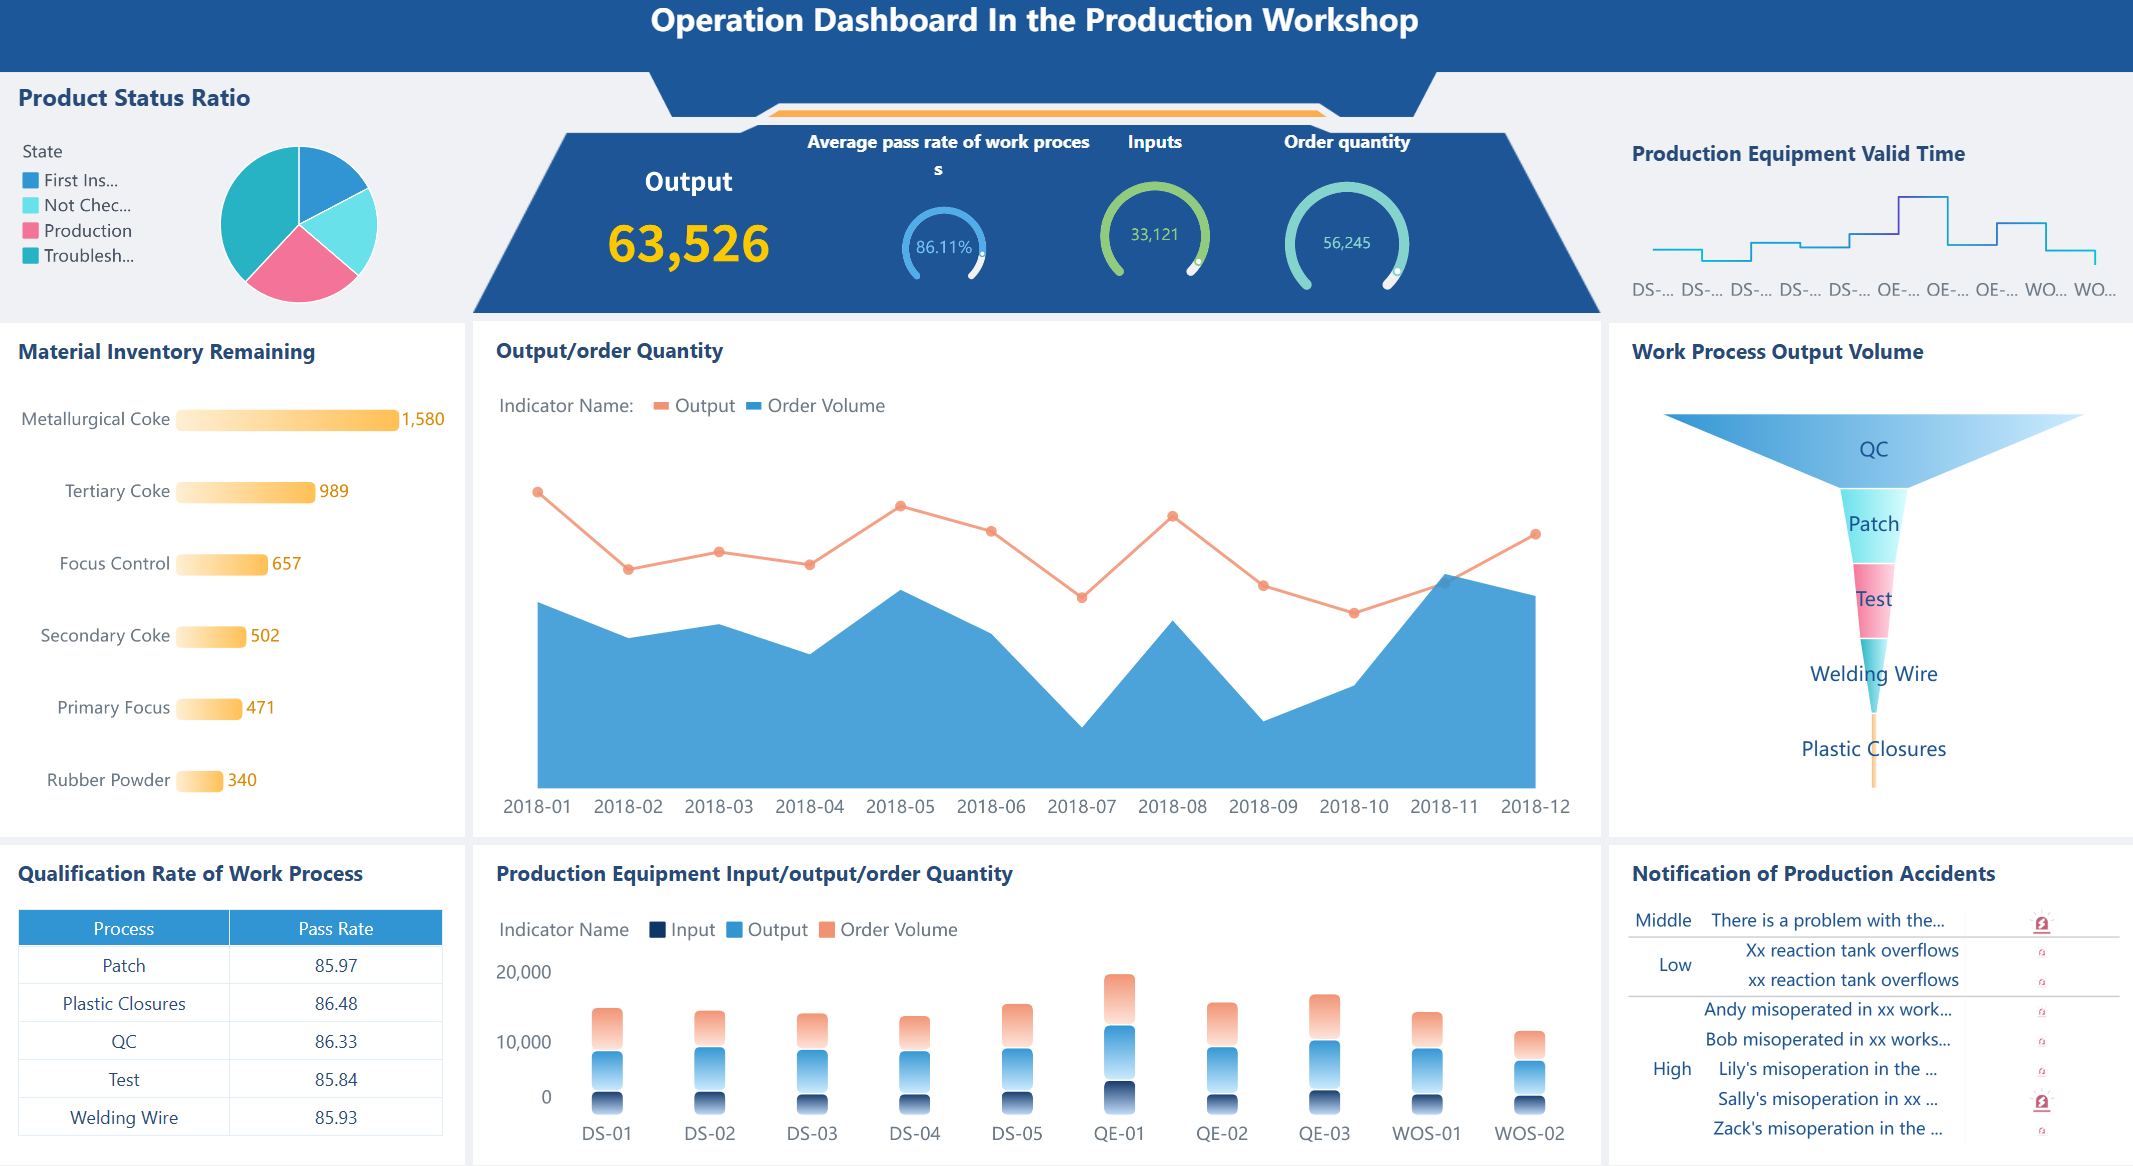
You can see how Kintetsu used FineReport to connect many data sources. Their sales teams now use a real-time workflow dashboard to track customer visits and cargo volumes. This improved their workflow creation and made their work more efficient.
Design Layout and Visuals
You want your workflow dashboard to be easy to use and understand. Start by matching your visuals to the type of data you have. Use bar charts for progress, pie charts for parts of a whole, and tables for lists. Use colors and shapes to highlight important numbers. Remove anything that does not help your team.
- Use simple visuals for your workflow dashboard.
- Add notes or labels to explain what each chart shows.
- Organize your dashboard so the most important information comes first.
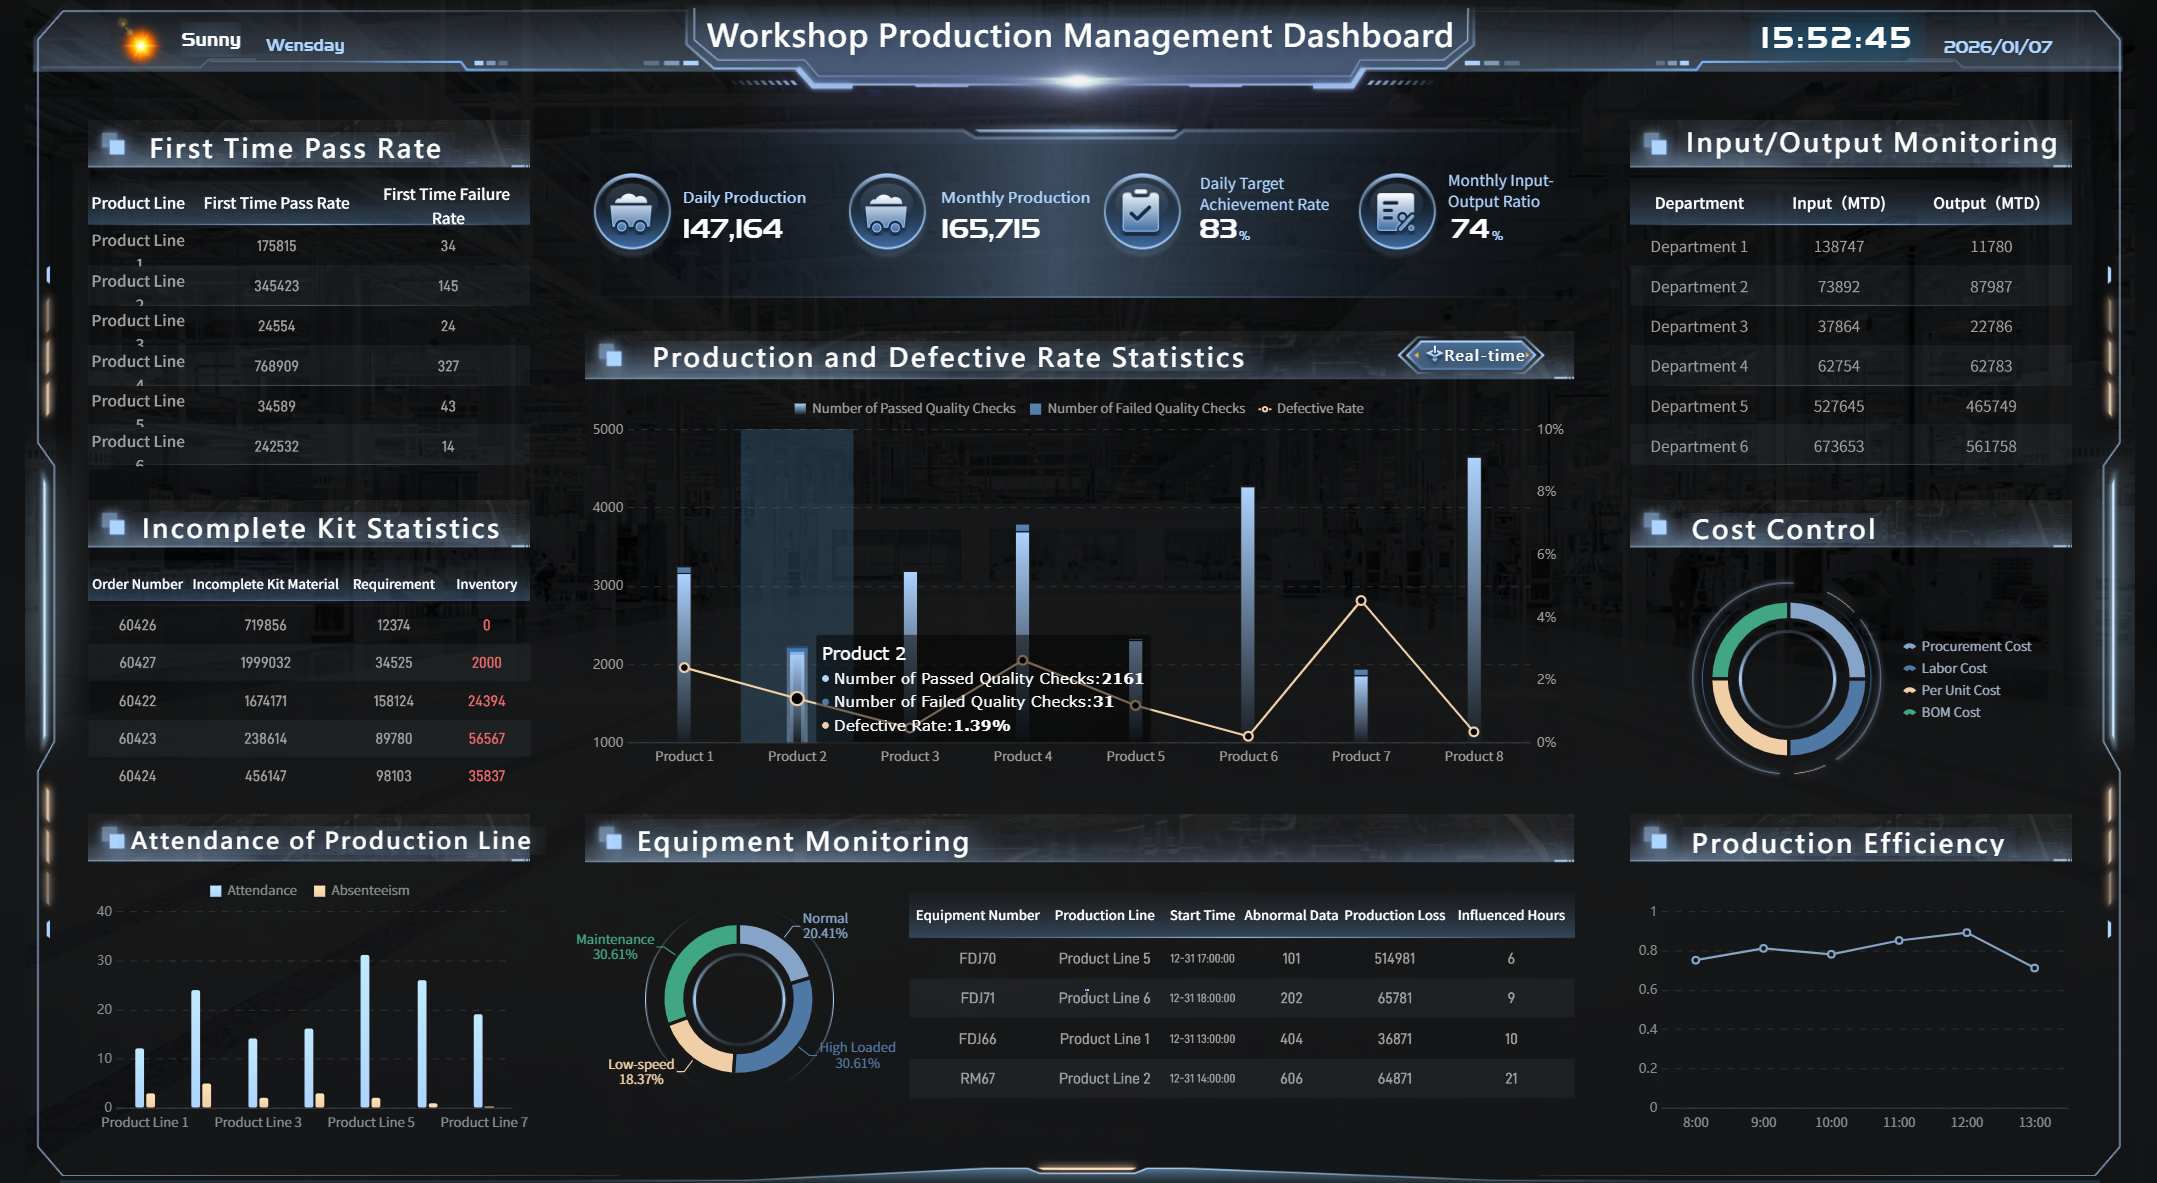
You can use FineReport’s drag-and-drop tools to design your dashboard. You can create different views for managers and team members. For example, in a smart factory, you can show production data to managers and daily tasks to workers. This helps everyone find what they need fast.
Automate and Schedule Reports
Automation makes your workflow dashboard even more powerful. FineReport lets you schedule reports to run automatically. You can send reports by email or publish them on a server. You can export reports in Excel, PDF, or PNG formats. This saves time and keeps your team updated.
| Feature | Description |
|---|---|
| Export Formats | Export reports as Excel, PDF, or PNG. |
| Scheduled Email Delivery | Send reports to your team automatically by email. |
| Remote Publishing | Build reports locally and publish them on a report server. |
When you automate reports, your team gets updates without extra work. Over 90% of workers say automation helps them get more done. Most people trust automated tools to give them the right data and help them make decisions faster. Automation also lets your team focus on important work instead of routine tasks.
You can see this in manufacturing solutions. Teams use FineReport to automate production and quality reports. This helps them spot problems early and keep everything running smoothly.
By following these steps, you can create a workflow dashboard that fits your team’s needs. You use FineReport to connect data, design clear visuals, and automate updates. This leads to efficient workflow creation and better results for your team.
Best Practices for Workflow Dashboards
Maximizing Team Adoption
You want your team to use the dashboard every day. Start by focusing on what your team needs most. Show only the key numbers and remove extra details. Place the dashboard where your team already works, like inside your project management tools. This makes it easy to find and use.
You should involve your team when you build the dashboard. Ask for their ideas and test the dashboard with them. Give each person training that matches their job. For example, project management leaders need to see big trends, while team members want to check their daily tasks. When you match the dashboard to each role, everyone understands how it helps their work.
You can use FineReport to help your team work together across departments. With shared dashboards, you spot workflow gaps, share insights, and build strong project management strategies. This helps your team solve problems faster and keeps everyone moving toward the same goal.
Avoiding Common Pitfalls
You may face some problems when you set up a dashboard for project management. Here is a table that shows common mistakes and how to fix them:
| Pitfall | Problem Description | Solution Description |
|---|---|---|
| Lack of End-User Involvement | The dashboard does not match what your team needs. | Involve your team early and ask for their feedback. |
| Poor User Engagement Post-Launch | People stop using the dashboard after a while. | Set up a feedback loop and check in with your team often. |
| Confusing Dashboards with One-Time Analyses | You build dashboards for requests that only happen once. | Find out if the dashboard is for ongoing project management or one-time use. |
| No Assigned Dashboard Owner | No one takes care of the dashboard. | Pick someone to own and update the dashboard. |
| Lack of Executive Support and Communication | Leaders do not talk about the dashboard’s value. | Leaders should explain why the dashboard matters for project management. |
| Overcomplicated Design and Poor Usability | The dashboard is hard to use and has too much data. | Keep the design simple and organize information clearly. |
You should also set up ways for your team to share ideas, like surveys or quick check-ins. Review feedback, look for patterns, and make updates. Track how changes help your team and keep improving the dashboard. With FineReport, you can scale your dashboard as your team grows and connect data from many departments. This keeps your project management strong and your team working together.
You can make a good workflow dashboard by using these steps. First, pick the right visuals for your data. Next, use colors and sizes to make things clear. Then, take away any extra details you do not need. Focus on what users want most. Make dashboards fit each person’s job. Use simple words that are easy to understand. Leave space between things so it does not look crowded. Do not add too many actions or choices. Check your steps often to see if you can do better.
| Principle | Explanation |
|---|---|
| Efficient Interactions | Match steps to how people do their work. |
| Avoid Dashboard Overload | Only show what is needed at each step. |
| Effective Use of Language | Use simple words for every step. |
| Minimize Cognitive Load | Make steps easy and not confusing. |
Start with a small plan and test your steps. Look at real examples to learn more. FineReport helps you follow these steps for better choices and teamwork.


FAQ

The Author
Lewis
Senior Data Analyst at FanRuan
Related Articles

Portfolio Reporting for PMOs: 9 Executive Metrics Every Weekly Portfolio Dashboard Should Include
Weekly portfolio reporting should help executives answer three questions fast: Are we delivering the right initiatives, are we putting outcomes at risk, and what decisions need leadership this week? For PMOs, that means
Yida Yin
Jul 01, 2026

How to Build an Investment Portfolio Reporting Dashboard for Executives: KPIs, Benchmarks, and Drill-Down Views
Investment portfolio reporting for executives is not about showing every holding, transaction, and chart your investment team can produce. It is about giving CEOs, CFOs, CIOs, boards, and investment committees a fast, re
Yida YIn
Jun 25, 2026

12 KPI Reporting Examples for Executive Dashboards: What to Show in Weekly, Monthly, and Quarterly Reviews
Executive leaders do not need more data. They need decision ready $1 examples that match how often they review the business and what actions they are expected to take. A weekly $1 should surface fast moving risks and per
Yida YIn
Jun 25, 2026