What is 'how to create a budget dashboard in Excel step by step'? This phrase describes a practical process where you organize financial data, set up tables, create charts, and automate calculations in Excel to monitor your budget with clarity. You follow clear steps that help you track income, expenses, and savings, making financial management simpler.
You don't need advanced Excel skills to build a budget dashboard. You just need a willingness to get started. Tracking and visualizing your budget lets you see where your money goes and helps you make smarter decisions.
Benefit Description
Measurable Impact
Visual representation of financial status
Helps track costs, leading to informed financial decisions.
Efficient resource allocation
Highlights overspending, aids in data-driven decisions.
Quick insights for budget adjustments
Supports timely decision-making.
Accessible reporting to stakeholders
Communicates financial health clearly.
If you want more advanced features or industry-specific solutions, consider exploring FineBI.
What Is a Budget Dashboard
Dashboard Purpose
A budget dashboard gives you a clear, organized view of your finances. You can think of it as your financial control center. It brings together all your income, expenses, and savings in one place. When you use a budget dashboard, you see exactly where your money goes. This helps you make better choices and avoid surprises. You can track your progress toward goals, spot trends, and adjust your spending as needed.
Monitors all your income sources for a full picture of your finances.
Expense Tracking
Lets you categorize and monitor spending in real time.
Net Worth Tracking
Shows your assets and debts to reveal your financial health.
Payment Reminders
Alerts you about upcoming bills so you never miss a payment.
Budgeting Forecasting
Helps you predict future spending based on past data.
Financial Planning
Guides you toward your financial goals.
Customization
Lets you tailor the dashboard to fit your needs and preferences.
Benefits for Budget Tracking
When you use a budget dashboard, you gain more than just numbers on a screen. You get real insights into your financial habits. You can:
Track income and spending with ease
Categorize transactions for better clarity
Visualize your data with summary charts
Receive alerts when you approach budget limits
A budget dashboard makes it simple to spot overspending and adjust quickly. You can share your dashboard with others if you need to report your financial status. This tool works for both personal and business finance. If you want to take your dashboards further, FineBIoffers business users a way to create interactive, real-time dashboards with even more features.
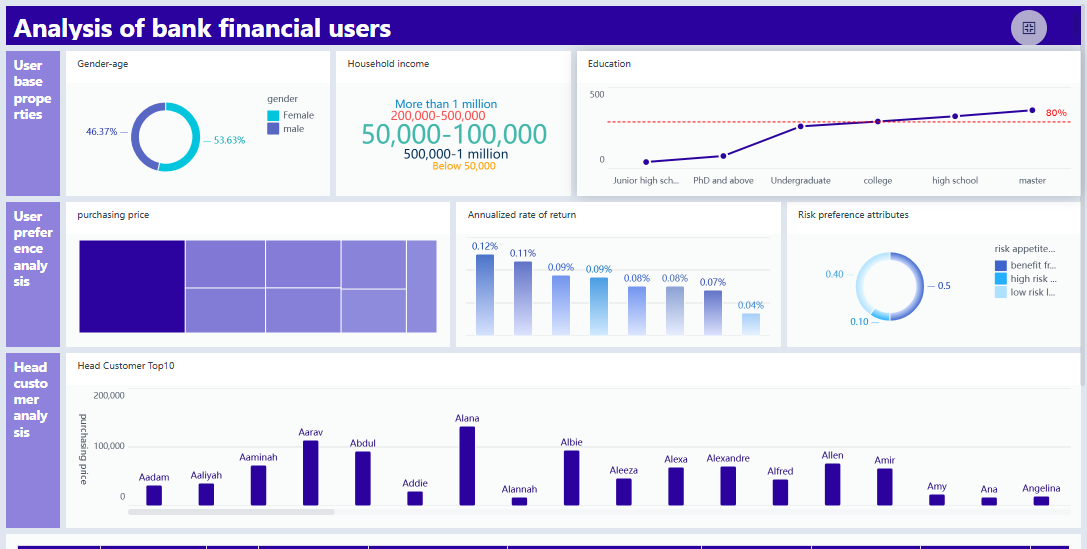
FineBI'sFinancial Analysis Dashboard - Click To Engage
When you start building your excel dashboard, you want to make sure you include all the essentials. These components help you track your money, spot trends, and make smart decisions. If you look at popularexcel dashboard templates, you’ll notice they all share a few key features.
Budget Categories
You need to organize your budget into clear categories. This makes your excel dashboard easy to read and understand. Most excel dashboard templates include:
Total Income: All sources of money coming in.
Fixed Expenses: Regular costs like rent, mortgage, and insurance.
Variable Expenses: Costs that change, such as groceries and utilities.
Discretionary Expenses: Non-essential spending like dining out or entertainment.
Savings Goals: Amounts you set aside for future needs.
Debt Payments: Monthly obligations you need to pay.
Breaking your budget into these categories helps you see where your money goes. You can quickly spot areas where you might want to cut back or save more.
Data Tables Setup
Tables are the backbone of any excel dashboard. You use them to organize your data before you create charts or summaries. Start by listing your income and expenses in separate tables. Add columns for dates, categories, and amounts. This setup makes it easy to filter and sort your data. Many excel dashboard templates use simple tables so you can update your numbers quickly.
Tip: Keep your tables clean and consistent. Use clear labels and avoid mixing different types of data in one table.
Visual Elements and Charts
Charts turn your numbers into pictures. They help you understand your budget at a glance. In an excel dashboard, you’ll often see:
Chart Type
Purpose
Bar/Column Chart
Compare values within and between groups
Pie/Donut Chart
Show the composition of your spending
Line/Area Chart
Track changes over time
Scatter/Bubble Chart
Show relationships between metrics
Table
Display details for many items
You don’t need fancy charts. Stick to the basics. Show one big number for your main KPI, like total savings or monthly spending. This keeps your excel dashboard clear and useful.
If you want more advanced visualizations, FineBIoffers interactive dashboards with extra features. But for most users, excel dashboard templates provide everything you need to get started.
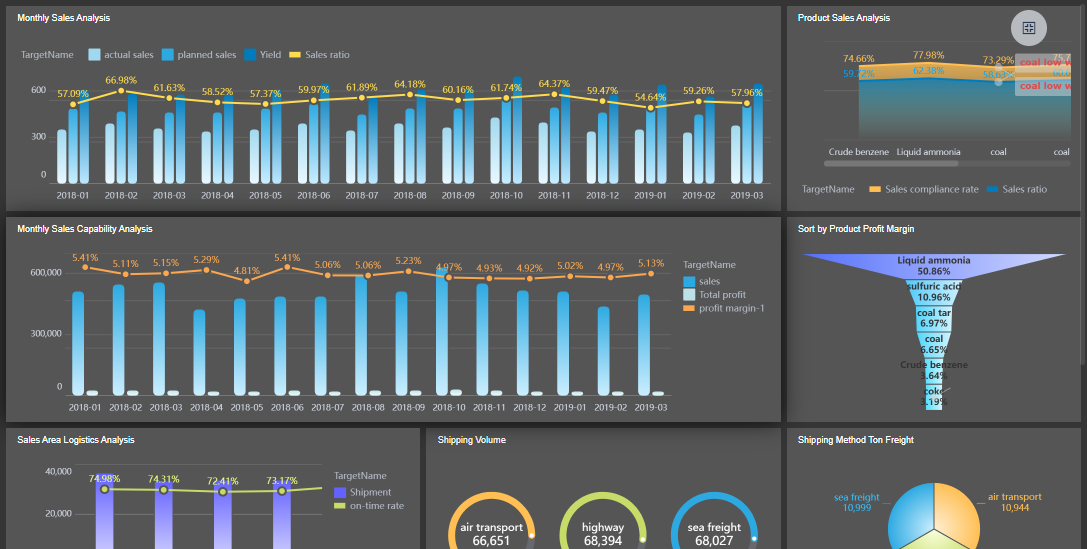
FineBI'sProduct Sales Analysis Dashboard - Click To Engage
Ready to build your own excel dashboard? Let’s walk through each step so you can create a dashboard in excel that helps you track your finances with confidence. Whether you’re managing a personal budget or handling business expenses, these steps will guide you from raw data to a polished, interactive excel budget dashboard.
Prepare Data
The first step in how tocreate a budget dashboard in Excel step by step is preparing your data. Good preparation sets the foundation for a reliable dashboard. Here’s how you can get started:
Create a Proper Layout: Open a new workbook and plan your layout. Decide where you’ll place your raw data, tables, and charts.
Import Data into Excel: Bring in your financial data. You can type it manually, copy from another file, or import from a bank statement.
Create a Table with Raw Data: Highlight your data and use the “Insert Table” feature. This makes sorting and filtering much easier.
Clean and Filter the Data: Remove duplicates, fix errors, and make sure all categories are consistent. Use filters to focus on the data you need.
Analyze Your Data: Look for trends or outliers. This helps you decide what to highlight in your dashboard.
Build the Excel Dashboard: Set up a new sheet for your dashboard elements.
Create a Dashboard Scorecard: Add key metrics like total income, total expenses, and savings.
Customize with Macros, Colors, and More: Make your dashboard easy to read and visually appealing.
Tip: Keep your data organized and up to date. Clean data leads to accurate insights in your excel dashboard.
Build Tables and Charts
Now you’re ready to create a dashboard in excel that brings your numbers to life. Tables and charts are the heart of any excel dashboard.
Create a Summary Sheet: Use a dedicated sheet to summarize your income, expenses, and savings. This gives you a quick overview.
Use Specific Chart Types: Choose the right chart for your data. Pie charts work well for expense categories, while line charts show spending over time.
Incorporate Basic Features: Include columns for date, description, amount, category, and payment method. This makes your dashboard more functional.
Add Formulas for Automatic Calculations: Use formulas like SUM, AVERAGE, and VLOOKUP to automate your calculations and keep your data accurate.
Note: Stick to simple, clear visuals. Too many charts can make your excel dashboard confusing.
FineBI'sMultiple Built-in Charts For Visualization
Automation saves you time and reduces errors. When you create a dashboard in excel, you want your totals and key metrics to update automatically.
Automation Method
Description
Calculation automation
Use formulas and functions that automatically update totals, percentages, and key metrics.
Formatting automation
Apply conditional formatting rules to highlight important trends and key performance indicators.
Distribution automation
Utilize macros to automatically save, format, and email reports to stakeholders.
When you automate calculations, you get:
Reduced errors
Improved accuracy
Significant time savings
Try using conditional formatting to highlight overspending or savings milestones. Macros can help you automate repetitive tasks, like sending monthly reports.
Add Interactivity
An interactive excel dashboard lets you explore your data and find answers fast. Here are some ways to add interactivity when you create a dashboard in excel:
Method
Description
PivotTables
Organize and summarize your data for dynamic analysis.
Slicers
Add visual filters to your PivotTables and charts for quick data selection.
Hyperlinks
Create clickable links to navigate between sheets or sections.
Zebra BI add-in
Enhance your dashboard with advanced visuals and interactivity.
PivotTables let you drill down into your data and see details by category or date. Slicers make it easy to filter your charts with a single click. Hyperlinks help you jump between different parts of your dashboard, making navigation smooth.
Tip: Keep your interactive elements simple. Too many options can overwhelm users.
If you ever find yourself working with large datasets or need real-time updates, Excel can start to feel limited. Challenges like data consolidation, version control, and collaboration can slow you down. For business users who want to streamline data integration and dashboard creation, FineBI offers seamless connections to multiple data sources, real-time updates, and advanced collaboration features. FineBImakes it easy to create a dashboard in excel style, but with more power and flexibility for growing teams.
FineBI's Real Time Multi Source Data Integration Feature
You want your excel dashboard to stay useful, so regular updates are key. Start by entering new transactions as they happen. This keeps your numbers fresh and your insights accurate. Use organized categories like materials, labor, equipment, and overhead to track spending. Compare your planned and actual totals often. This helps you see if you’re on target or need to adjust. Visual controls, such as donut charts, give you a quick look at what you’ve spent and what remains. Automatic totals and variance indicators make it easy to spot overruns and take action fast.
Accuracy matters for every excel dashboard. Set clear data standards so everyone enters information the same way. Use data validation tools to catch mistakes before they cause problems. Schedule regular reviews—daily checks, weekly deep dives, and monthly audits. These habits help you keep your dashboard reliable and your decisions smart.
Set clear data standards for consistency.
Use validation tools to catch errors.
Review your dashboard daily, weekly, and monthly.
Tips for Ongoing Use
You can get more from your budget dashboard by following a few simple tips:
Keep it simple. Only show the numbers and charts you need.
Organize your layout. Put important info at the top or left, and use the same style throughout.
Make it interactive. Add dropdowns or filters so users can explore data easily.
Add clear labels. Every chart and table should have a title.
Update regularly. Check that everything works and reflects your current goals.
If you work with a team or need real-time updates, FineBIcan help. FineBI’s drag-and-drop interface lets you build reports quickly. Real-time processing means your data stays current. Advanced visualizations and collaboration tools make it easy for teams to connect, analyze, and share insights—so everyone stays on the same page.
Advanced Options and FineBI Solutions For Budget Dashboard
Customizing Your Excel Dashboard
You might want to take your excel dashboard beyond the basics. Excel gives you plenty of tools to make your dashboard more interactive and tailored to your needs. You can use features like data validation controls, dynamic named ranges, and conditional formatting to highlight important numbers. Filters and Pivot Tables help you organize and analyze your data quickly. Slicers make it easy to switch views, while interactive charts and graphs let you explore trends. If you enjoy automation, macros and command buttons can save you time. UserForms and combo boxes add a professional touch, making your dashboard feel more like an app.
Tip: Try combining these features to create a dashboard that fits your workflow. You can always start simple and add more options as you get comfortable.
FineBI for Enterprise Budget Management
If you need more power for budget management, FineBI steps in withadvanced features. You get a robust data visualization engine and a wide variety of chart options, including KPI indicator cards. The user interface feels dynamic and interactive, making it easy to explore your data. FineBI supports real-time data updates, so your budget dashboard always shows the latest numbers. You don’t need technical skills to use self-service analytics. FineBIscales with your business, offering seamless mode switching and support for complex data models. Technologies like Spark and HDFS help you analyze big data efficiently. Intelligent permission inheritance and real-time data previewing keep your information secure and accessible.
Feature
FineBI
Excel
Data Visualization Engine
Robust with extensive options
Limited
Chart Options
Wide variety including KPI Indicator Card
Basic charts
User Interface
User-friendly, dynamic, and interactive
Less interactive
Real-time Data Updates
Supported
Not supported
Self-service Analytics
Enabled for users without technical skills
Limited capabilities
Benefit
Description
High scalability
Different deployment models for various scenarios.
Seamless mode switching
Select data models for real-time needs.
Advanced architecture
Integrated with Spark and HDFS for efficient analysis.
Excellent user experience
Error tolerance and explicit path records.
Intelligent permission inheritance
Simplifies permission management.
Real-time data previewing
Instant feedback on data.
Support for complex data models
Handles multiple fact tables and cross data sources.
Industry Use Case: Manufacturing
Manufacturing companies often face challenges with traditional budget management. FineBI offers solutions that help you integrate financial and operational data, making your excel dashboard more effective. For example, Magnitogorsk Iron and Steel Works switched from Tableau to FineBI for financial analytics and budget optimization. They chose FineBIfor its report builder, self-service support, and secure usage. These features help manufacturing teams track costs, optimize resources, and respond quickly to market changes. If you want to learn more, you can explore FineBI’s product page and see how other companies use it for budget management.
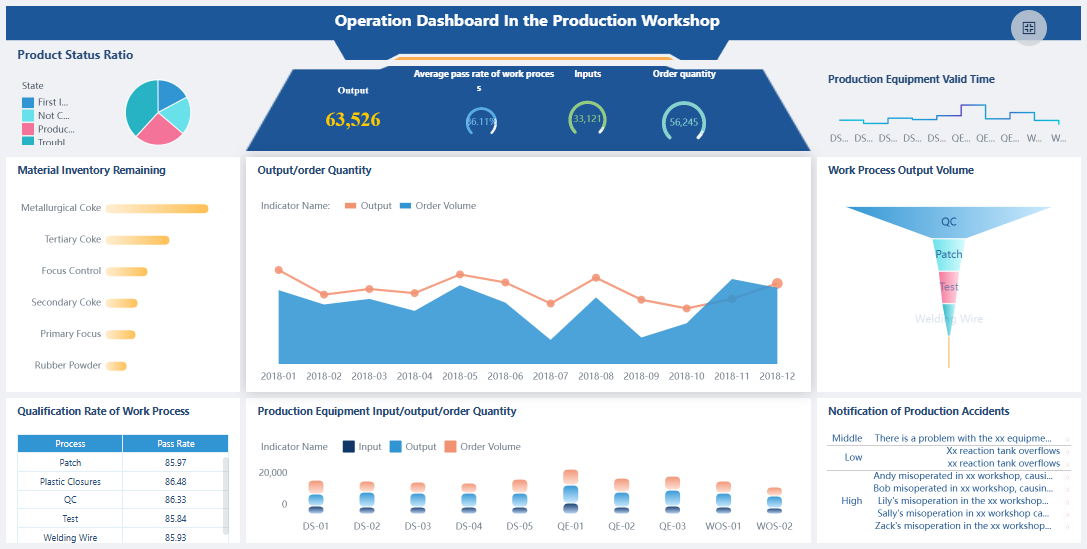
FineBI'sOperation Overview Analysis Dashboard - Click To Engage
You can create a budget dashboard in Excel by following these steps:
Download a template and open it.
Enter your income, savings goals, and expenses.
Review the summary and dashboard charts.
Customize your dashboard for personal or business needs. Use tables to track material, labor, equipment, and overhead costs. FineBIoffers advanced analytics and interactive dashboards for enterprise solutions. Take control of your finances and discover new tools for smarter budgeting.
Benefit Type
Description
Financial Control
Get real-time feedback and spot spending patterns.
Accountability
Foster responsibility and improve future budgeting.
Access a wealth of case studies, industry insights, and solution guides to accelerate digital transformation.
FAQ
How do I start if I’m new to Excel?
You can begin by opening a blank workbook. Enter your income and expenses in simple tables. Use Excel’s “Insert Table” feature. Follow the steps in this guide on how to create a budget dashboard in Excel step by step.
What data should I include in my budget dashboard?
You should track all sources of income, fixed and variable expenses, savings, and any debts. Organize your data by date and category. This helps you see spending patterns and manage your budget effectively.
How often should I update my Excel budget dashboard?
Update your dashboard at least once a week. Regular updates keep your data accurate. You can spot trends and make better decisions when you review your numbers often.
Can I share my Excel budget dashboard with others?
Yes, you can share your dashboard by saving your file to OneDrive or Google Drive. You can also email it. Make sure you protect sensitive information before sharing.
What if my budget changes during the month?
You can adjust your dashboard anytime. Add new expenses or income as they happen. Excel updates your totals automatically. This flexibility helps you stay on track with your financial goals.