HR dashboards give you a clear view of your workforce and help you spot trends that matter. When you use hr dashboard examples, you empower your team to make decisions based on real data, not guesswork. Studies show that dashboards work best when you design them with feedback and keep users engaged throughout the process. If you want results, you need dashboards that are easy to use and adapt to your needs. Actionable insights come from dashboards that people actually use and trust.
Importance of Iterative Design
Engaging in an iterative dashboard design and evaluation process enhances usability and effectiveness.
Evaluation Across Phases
Evaluating dashboards multiple times during preparation, implementation, and sustainment allows for necessary redesigns based on user feedback.
Dependency on User Engagement
The impact of dashboards is contingent on their use by intended users; unused dashboards provide little value.
Every dashboard here was built with FineBI—your gateway to smarter, faster analytics. Start your free trial and see what self-service BI can do for you.
You need the right tools to manage your workforce effectively. A well-designed hr dashboard gives you real-time insights into your organization. With modern hr dashboards, you can see key metrics at a glance. This helps you respond quickly to changes in recruitment, employee engagement, and performance.
Benefit
Description
Real-Time Insights
You can respond to trends and issues as they arise, such as identifying root causes of turnover.
Enhanced Strategic Planning
You plan for future talent needs and workforce development using data from your hr dashboard.
Improved Employee Engagement
You track engagement metrics and design initiatives that boost morale and productivity.
Cost Management
You analyze data to optimize costs and allocate resources for recruitment and retention.
Compliance and Risk Management
You monitor compliance metrics and reduce the risk of legal or regulatory issues.
Modern hr dashboards consolidate important metrics and key performance indicators into one visual display. You can monitor, analyze, and plan your recruitment strategies more effectively. When you use a dashboard, you identify trends and measure the impact of your hr initiatives.
Solving HR Challenges
Every hr team faces challenges like high turnover, compliance issues, and finding top talent. An hr dashboard helps you solve these problems by tracking key workforce metrics. You can spot trends in recruitment and address issues before they grow. For example, dashboards show you which departments have high turnover, so you can focus on retention strategies.
Dashboards provide transparency in turnover rates and motivate managers to prioritize employee retention.
You use real-time data from your hr dashboard to communicate with leadership and present data-backed recruitment initiatives.
Over time, dashboard analysis supports strategic decisions that align with business goals.
When you implement hr dashboard examples in your organization, you gain several benefits:
Improved decision-making: You use data-driven insights for informed recruitment and retention decisions.
Enhanced efficiency: You automate data collection and analysis, saving time for your hr team.
Increased employee engagement: You identify satisfaction levels and areas for improvement.
Improved performance management: You track employee performance and offer better support.
Enhanced talent management: You identify and nurture top talent through recruitment dashboards.
Reduced risk: You spot potential risks like discrimination early.
Increased transparency: You communicate insights to stakeholders with clear dashboard visuals.
Modern hr dashboards give you the power to make smarter recruitment decisions and solve real-world hr challenges.
You need a clear picture of your workforce to make smart decisions. An employee overview hr dashboard gives you real-time access to workforce metrics. You see trends and spot issues before they grow. This type of hr dashboard examples helps you track employee performance, diversity, and satisfaction. You can customize the dashboard to focus on key metricsthat matter most to your organization.
Key Feature
Description
Real-Time Data Insights
Access real-time data for tracking and analyzing important hr metrics.
Centralize data from various hr systems for streamlined processes.
Employee Performance Dashboard
Track individual and team performance, including reviews and training progress.
Diversity Dashboard
Monitor metrics related to workforce diversity and inclusion goals.
You use employee overview hr dashboard examples to monitor workforce metrics and trends. You can make informed decisions about hiring, engagement, and retention. These hr dashboards help you analyze recruitment processes and improve efficiency.
HR dashboards provide real-time updates on workforce metrics.
You identify trends and address issues proactively.
You make decisions about hiring and engagement based on current data.
You improve hiring efficiency and reduce costs.
Recruitment & Hiring HR Dashboard Examples
Recruitment and hiring hr dashboard examples help you optimize your talent acquisition process. You track key metrics like time to hire, cost per hire, and offer acceptance rate. These hr dashboards centralize recruitment data, making it easy to analyze and improve your hiring strategy.
Time to Hire
Time to Fill
Quality of Hire
Cost per Hire
Applicants per Opening
Recruiting Conversion Rate
Offer Acceptance Rate
Benefit
Description
Centralized Metrics
Recruitment dashboards centralize critical metrics for analysis.
Optimized Recruitment
You optimize every aspect of your talent acquisition process.
Faster Hiring Decisions
Insights lead to faster and more effective hiring decisions.
Tracking recruitment metrics helps you identify bottlenecks and improve candidate quality. Companies that use recruitment analytics dashboard examples see a 26% improvement in hiring efficiency. You can adjust your process to enhance speed without losing quality.
Employee Engagement HR Dashboard Examples
Employee engagement hr dashboard examples let you measure how connected your employees feel. You track metrics like employee net promoter score, survey response rate, and workload balance. These hr dashboards help you design initiatives that boost morale and productivity.
Employee Net Promoter Score (eNPS)
Survey Response Rate
Workload Balance
Metric
Description
Turnover Rate
Measures both voluntary and involuntary departures.
Attrition Rate
Focuses on voluntary departures.
Retention Rate
Indicates the percentage of employees staying over time.
You use employee engagement dashboard examples to increase retention. For example, Standard Chartered found that branches with high engagement had 46% less voluntary turnover. You can track retention and design strategies to keep your best talent.
Diversity & Inclusion HR Dashboard Examples
Diversity and inclusion hr dashboard examples help you build a fair and inclusive workplace. You track representation in hiring, promotion rates, employee satisfaction, engagement levels, retention across groups, and DEI training completion rates. These hr dashboards show you where you need to improve and help you meet compliance goals.
Representation in hiring
Promotion rates
Employee satisfaction
Engagement levels
Retention across employee groups
DEI training completion rates
Tracking these metrics helps you assess progress toward DEI goals. You identify diversity gaps and measure the impact of your initiatives. Diversity & Inclusion hr dashboards provide visual representations of workforce demographics, including gender, age, race, and salary data. You track compliance with equal opportunity laws and improve organizational culture.
Track disciplinary action rates segmented by demographics.
Monitor turnover and retention rates for protected groups.
Survey scores on perceptions of fair treatment across the employee lifecycle.
Learning & Development HR Dashboard Examples
Learning and development hr dashboard examples help you track training effectiveness and employee progress. You visualize key metrics like training attendance rate, completion rate, average training hours, certification pass rate, satisfaction score, and learning transfer rate.
Training Attendance Rate (%)
Training Completion Rate (%)
Average Training Hours per Employee
Certification Pass Rate (%)
Training Satisfaction Score
Employee Performance Post-Training (%)
Training Cost per Employee
Training Effectiveness Score
Learning Transfer Rate
New Skill Acquisition Rate (%)
Metric Type
Description
Satisfaction Metrics
Insights into how departments perceive training initiatives.
Trends
Highlights trends to identify and address issues in training programs.
Training Effectiveness
Offers a clear picture of the overall effectiveness of training initiatives.
You use these hr dashboard examples to display planned and completed course hours, top-rated courses, and average course length. You monitor employee progress and adjust training programs to meet your goals.
Absence & Attendance HR Dashboard Examples
Absence and attendance hr dashboard examples help you manage workforce productivity. You track absenteeism rate, absenteeism percentage, and attendance patterns. These hr dashboards provide insights into employee attendance and help you identify departments with attendance issues.
Metric
Description
Absenteeism Rate
Shows average absences from the job for both legitimate and illegitimate reasons.
Records the number of absences and calculates the average absence rate.
Absenteeism Dashboard
Tracks types of absences and measures frequency and length.
Evidence Description
Impact on Absenteeism and Productivity
Access to accurate data helps identify inefficiencies in workforce time management.
Organizations can implement targeted measures to address productivity issues, reducing absenteeism.
Real-time data allows for quick implementation of productivity-boosting measures.
Immediate actions can enhance employee output and attendance.
Analysis of absence trends aids in optimizing scheduling and workload distribution.
Better scheduling can reduce absenteeism and improve engagement.
Accurate time-keeping eliminates time theft and promotes accountability.
Employees are more likely to adhere to schedules, reducing absenteeism and improving punctuality.
Identifying signs of disengagement early can prevent further absenteeism.
Early intervention can maintain engagement and reduce absenteeism.
You analyze attendance patterns to optimize scheduling and boost productivity. Real-time data helps you act quickly to improve employee engagement and reduce absenteeism.
FineBI HR Dashboard Examples
FineBIHR dashboard examples offer advanced self-service analytics for HR teams. You connect to multiple data sources, including big data platforms, relational databases, and Excel files. FineBI lets you build custom hr dashboards with drag-and-drop tools, making it easy to visualize key metrics and workforce trends.
You use FineBI to create hr analytics dashboard examples that track employee performance, retention, and satisfaction. The platform supports real-time analysis, so you always have up-to-date information. FineBI’s enterprise-grade capabilities include role-based access control, data governance, and collaboration features. You share hr dashboard ideas across departments and empower teams to make data-driven decisions.
Integrate data from various HR systems for unified analysis.
Visualize employee performance dashboard metrics, retention, and engagement.
Track key metrics like turnover, absenteeism, and training effectiveness.
Build talent management dashboard examples for succession planning and workforce development.
Use hr kpi dashboards to monitor strategic goals and compliance.
FineBI's self-service analytics let you explore hr dashboard examples independently. You analyze workforce metrics, identify trends, and take action to improve employee retention and satisfaction. The platform’s flexibility supports any hr dashboard ideas you want to implement, from strategic hr dashboard examples to specialized talent management dashboard examples.
You need to set clear objectives before you implement any hr dashboard in your organization. Start with the most essential hr dashboard examples so your human resources team can learn the tool step by step. Make dashboards part of your daily activities. Regularly check your dashboard and use real-time data to guide decisions. Align each dashboard with your organization’s goals. This approach keeps your human resources efforts focused and prevents wasted time.
Take gradual steps when introducing hr dashboard examples.
Integrate dashboards into daily human resources activities.
Set clear objectives that match your organization’s strategy.
User-Friendly Design
A user-friendly hr dashboard increases adoption and effectiveness. When you design dashboards with intuitive navigation, you make it easier for human resources teams to use them. Employees prefer tools that are simple and easy to navigate. If your dashboard is hard to use, people may avoid it, which reduces its value.
Applying UX principles in human resources dashboard development ensures that systems are user-friendly and functional, reducing friction in daily tasks.
Understand user experiences and frustrations before you design your hr dashboard.
Simplify decision-making so users engage more with the dashboard.
Avoid poor usability, which can make essential human resources functions frustrating.
Intuitive interfaces help your organization transition smoothly during changes. When you prioritize user needs, you increase the likelihood that employees will adopt new hr dashboard examples. A functional dashboard makes administrative tasks easier for your human resources team.
Data Integration and Security
Data integration and security are critical for every hr dashboard. You must connect disparate human resources data sources for effective management. High-quality, consistent data ensures reliable analytics. Your organization needs strong security measures to comply withdata protection laws.
Ensure seamless integration with existing systems and robust data security features.
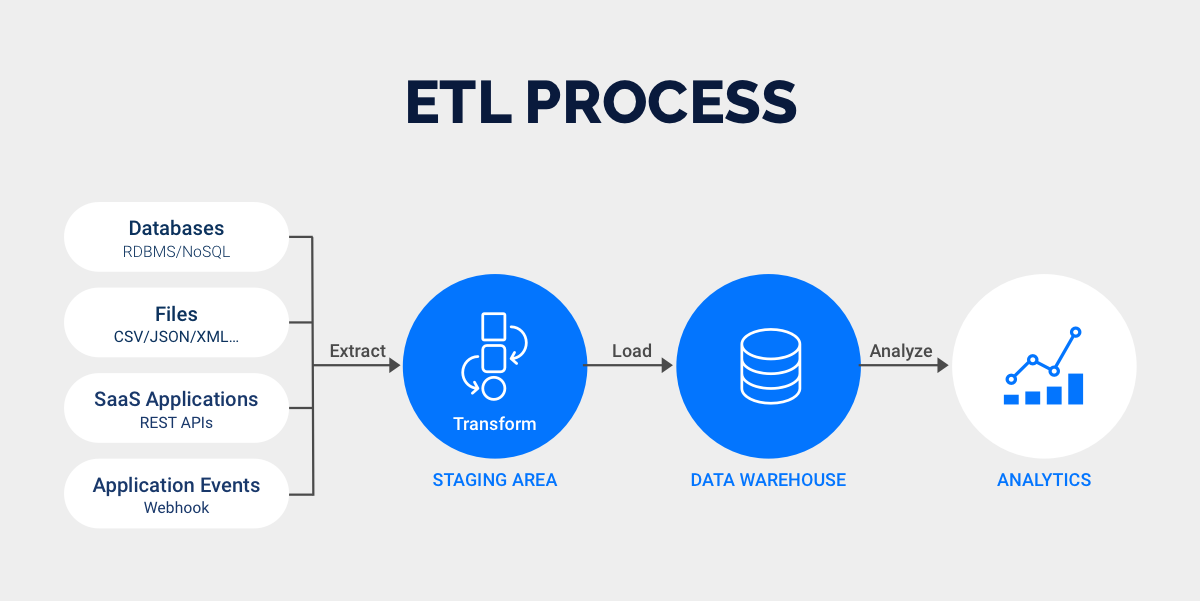
FineBIoffers advanced solutions for human resources dashboard examples. The platform integrates with FineDataLinkfor ELT and ETL processes, supporting diverse data processing needs. FineBI empowers business users to perform analytics independently. User classification simplifies access control, making management easier.
Feature
Description
Data Integration
Integrates with FineDataLink for ELT and ETL processes, supporting diverse data processing.
Self-Service Analytics
Empowers business personnel to perform analytics independently.
User Classification Simplification
Streamlined user types to design user and view user, enhancing management and access control.
When you choose hr dashboard examples with strong integration and security, you protect sensitive human resources data and support reliable decision-making across your organization.
Selecting the right hr dashboard for your organization starts with understanding your business goals. You need a dashboard that supports your hr strategy and adapts to changing needs. Begin by involving your hr team in strategic planning. Translate your business goals into talent needs and design hr programs that drive success. Align incentives with your priorities to motivate employees. Keep a continuous dialogue between hr and leadership to adapt quickly.
To make sure your hr dashboard aligns with your organization, follow these steps:
Include hr in strategic planning discussions.
Identify the skills and capabilities your business needs.
Link hr initiatives to business outcomes.
Motivate employees with incentives tied to your goals.
You can measure the impact of your hr dashboard by collecting both hr-specific metrics and broader business data. Predictive and prescriptive dashboards help you see how hr initiatives affect business results. You might use customized recruitment campaigns, upskilling programs, and performance incentives to support your goals.
When you evaluate hr dashboard options, consider these criteria:
Criteria
Description
Dashboard Features
Look for real-time updates, mobile access, and custom reporting.
Integration Capabilities
Make sure the dashboard connects with payroll and performance management systems.
User Experience
Choose intuitive interfaces and training resources to boost engagement.
Security Considerations
Check for strong data protection, audit trails, and compliance features.
Leveraging FineBI for HR Analytics
After you identify your needs, you can leverage FineBI to build scalable, self-service hr dashboards. FineBI connects to multiple data sources, including big data platforms and relational databases. You use drag-and-drop tools to create custom hr dashboards that visualize key metrics. FineBI supports real-time analysis, so your hr team always works with the latest data.
FineBI offers enterprise-grade security and role-based access control. You share dashboards across departments and empower teams to make data-driven decisions. The platform integrates with existing hr systems, making data management seamless. You can analyze workforce trends, track retention, and monitor training effectiveness with ease.
FineBIhelps you adapt your hr dashboard as your organization grows. You gain flexibility, speed, and control over your hr analytics. With FineBI, you transform raw data into actionable insights that drive business success.
Adopting the right hr dashboard transforms your organization. You see measurable improvements in employee engagement, operational efficiency, and talent retention.
Impact Area
Measurable Outcome
Employee Engagement
25% higher success rates in achieving program objectives
Operational Efficiency
Over 20% improvement reported
Talent Retention
Improved talent attraction and retention
You gain insights that help you identify trends, predict workforce needs, and align hr strategies with business goals.
Explore hr dashboard options like FineBIto maximize data-driven hr management. Start with core metrics, ensure data quality, and design dashboards for your users.
Smarter product, pricing, and inventory management across retail sectors.
FAQ
What are HR dashboard examples?
HR dashboard examples show you how to visualize workforce data. You see key metrics like turnover, engagement, and training. These examples help you understand what information to track and how to present it for better decision-making.
How do HR dashboard examples improve decision-making?
HR dashboard examples give you real-time insights. You spot trends and issues quickly. You use the data to make informed choices about hiring, retention, and employee development.
Which metrics should you include in HR dashboard examples?
You should track turnover rate, employee engagement, recruitment efficiency, diversity, training completion, and attendance. These metrics help you measure workforce health and support your HR strategy.
Can you customize HR dashboard examples for your organization?
You can customize HR dashboard examples to fit your needs. You select the metrics and visualizations that match your goals. Custom dashboards help you focus on what matters most.
Why choose FineBI for HR dashboard examples?
FineBI lets you build HR dashboard examples with drag-and-drop tools. You connect to multiple data sources and analyze data in real time. FineBI supports secure sharing and collaboration across your HR team.