
Why Data Needs Interpretation And Storytelling?
Raw metrics and dashboards often show what is happening, but not why it matters. Interpretation adds context, identifies trends, and surfaces the implications behind the numbers.
Even perfectly accurate reports can lead to inaction if the meaning isn’t clear. Leveraging the power of AI and modeling is not enough to "have data"—you need a strong foundation in analytical thinking. Only then can AI tools generate reliable outputs and support meaningful, data-driven conversations.
Whether you're a data analyst or a C-suite leader, your ability to tell a clear data story determines how effectively you can influence strategy, justify investments, or mobilize teams around change.
About Data Storytelling Series
In this FanRuan webinar series, we go beyond just teaching you metrics—we equip you with the mindset, tools, and structure needed to interpret your data and communicate it with impact.
You'll also discover how self-service analytics tools like FineBI are critical to your business success in key areas and how they can transform your data into actionable insights.
#1 Webinar Spotlight: Gross Profit Analysis
In our kickoff session, we’ll walk you through:
Gross profit, margin, and gross profit margin ratio — what they are, why they matter
The formulas and calculations behind these core financial metrics
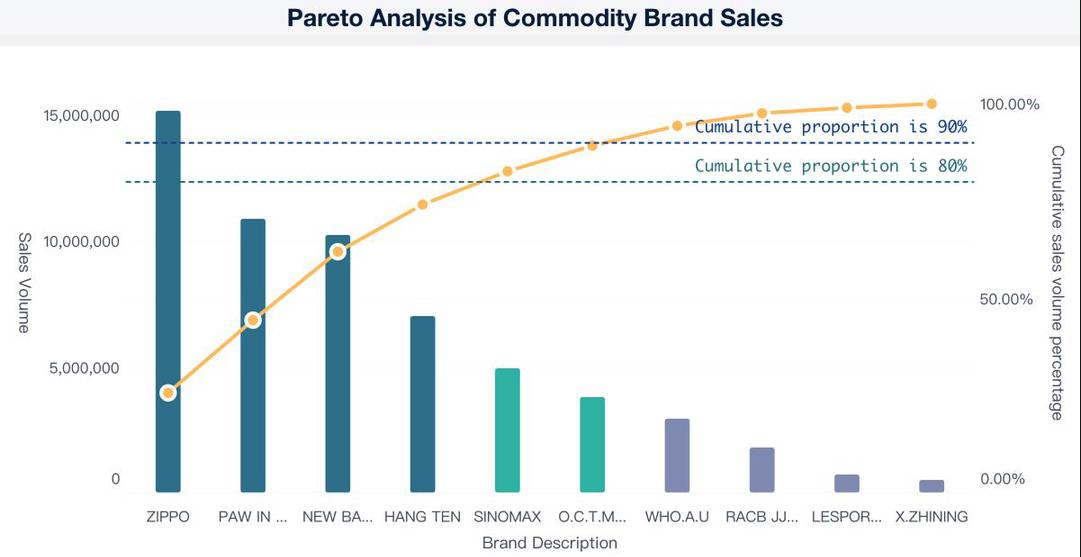
Hands-on data visualization to explore Pareto patterns and key business drivers
How external factors, like tariffs, impact gross profit:
Understand how tariff increases raise input costs, reduce gross profit, and pressure margins
Analyze how tariff reductions or exemptions can improve cost efficiency and profitability
Learn to model and visualize tariff scenarios to prepare for market and policy changes
How to use FineBI to turn these insights into clear, actionable business decisions
This session will help you connect operational data with real-world challenges like global supply chain shifts and trade policy impacts, so you can tell meaningful data stories that resonate with stakeholders.
Webinar Agenda
Introduction to data storytelling series
Instructor self-introduction
Definition & formula
Definition of gross profit, margin, gross profit margin ratio
the formula & calculation
Use cases
hands-on data visualization
how to interpret the shape
Finebi product introduction
Q&A
Registration Information
💻 Demo Platform: In this webinar series, we will use FineBI for showcasing. If you haven't installed FineBI, you can use our demo platform for trial, Please use your Gmail to sign up.
👤 Who Should Attend: We welcome anyone who has an interest in data analysis and storytelling
📧 You will receive a confirmation email within 2-3 business days containing the webinar link. Be sure to check both your inbox and spam folder.
Need Assistance? Contact us at international@fanruan.com.
Join FanRuan for a Deeper Conversation
Besides our events, FanRuan marketing and consulting team invite you to join a small 15–20 minute 1:1 interview with us, as we always strive to understand the evolving needs of data science and analytics professionals.
We love to hear your thoughts directly on:
💡 We value your privacy. The information collected from users participating in the interview will be used internally within FanRuan for non-commercial purposes only and will not be disclosed externally.
💡 In appreciation of your time, you’ll receive an exclusive gift voucher as a thank-you after the session.
Interested in joining the focus group?
👉 Fill out this quick form and we’ll reach out to schedule a time that works best for you.
We look forward to hearing your insights!
👉 After registration, you will receive a confirmation email with details. Please check your inbox and contact us at international@fanruan.com with any questions.
00
DAYS
00
HOURS
00
MIN
00
SEC
DATE
Wednesday, August 6, 2025
TIME
3:00 pm - 4:00 pm GMT+8
Zoom
© 2024-2026 FanRuan Software Co., Ltd.
All Rights Reserved.