
Customer Behavior Analysis: From Click to Purchase
🎯 Why Analyze Customer Behavior?
In the highly competitive e-commerce landscape, understanding how users interact with your platform is key to increasing conversion rates and return rates while reducing drop-offs. Customer behavior analysis helps you uncover what happened in your customer journey, but why it happened.
In this webinar, we will use a fake e-commerce business context to help you better understand how to conduct customer behavior analysis.
🛍️ Scenario: Low Ad ROI for an E-commerce Platform
📌 Background
An online retailer launches a paid social media campaign to promote their new collection. Despite high ad impressions and click-through rates, actual purchases remain low. The marketing team wants to understand what’s causing the drop-off and how to optimize ad-to-purchase conversion.
🎯 Objective
To identify drop-off points along the conversion journey from ad click to final purchase, and to optimize ad performance and shopping experience.
🧠 Why Analysis Is Needed
High click volume does not translate into conversions.
The team suspects that issues exist in the product demonstration page.
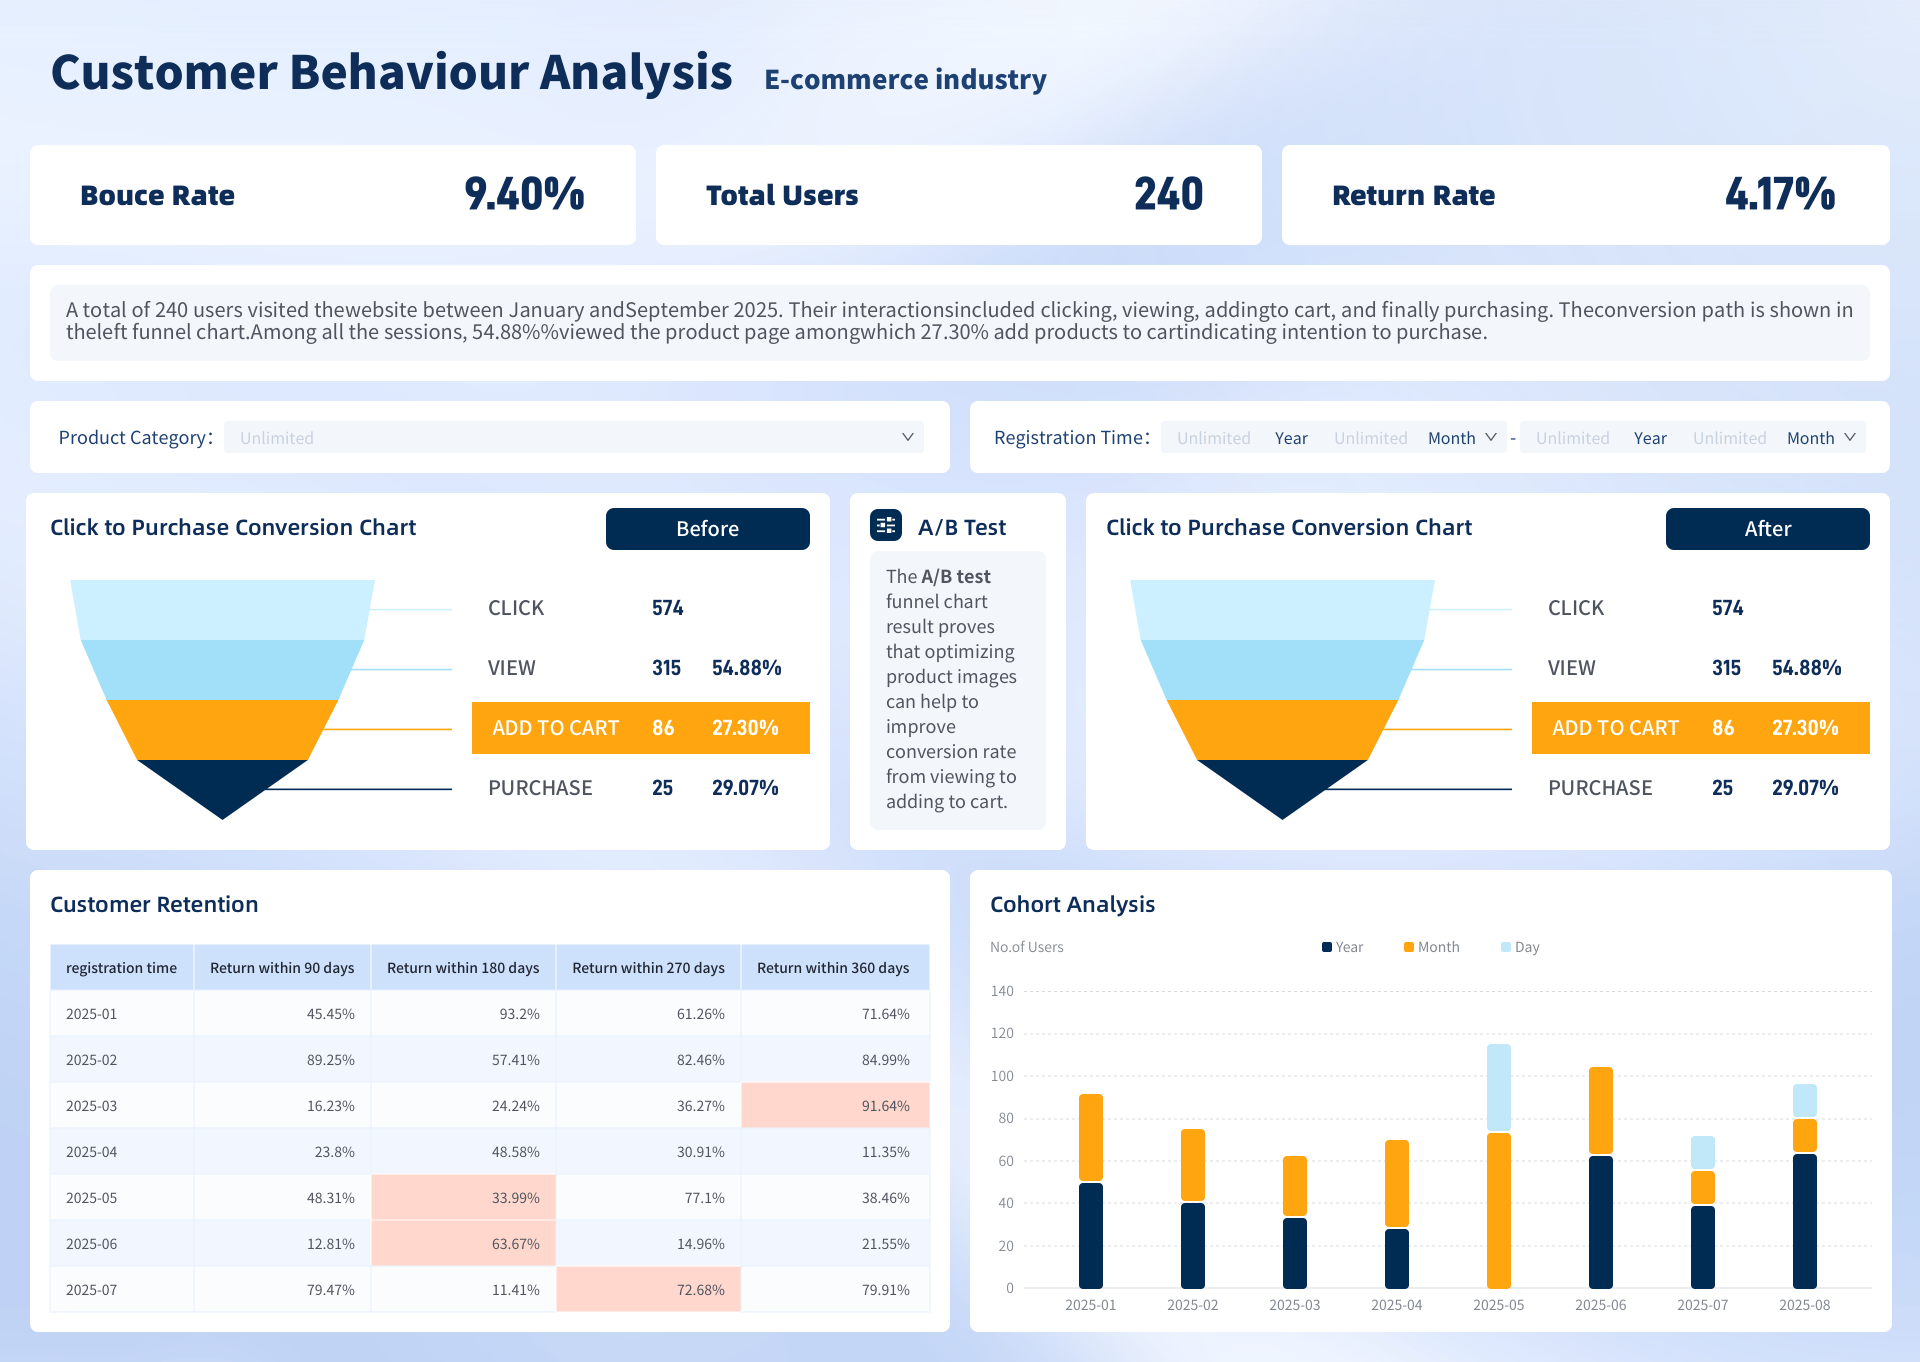
We will walk you through this scenario using simulated e-commerce data and using FineBI demo platform to create a practical and interactive dashboard (see example below👇). And we will demonstrate how to:
Track and analyze key metrics across each step of the conversion journey
Interpret visualized funnel data to identify performance bottlenecks
Use segmentation and A/B testing strategies to improve conversion rates
Whether you're from a marketing, sales, or data analytics team, this session will equip you with the mindset and tools to turn behavioral data into actionable insights. Don't just collect data—learn how to read it, question it, and act on it.
Webinar Agenda
Introduction to data storytelling series
Instructor self-introduction
Business context introduction
Analysis demonstration
Q&A
Registration Information
💻 Demo Platform: we will use the data analytics and visualization tool FineBI for showcasing. If you haven't installed FineBI, you can use our demo platform for trial. Please use your Gmail to sign up.
👤 Who Should Attend: beginner-friendly! Anyone is welcome!
📧 You will receive a confirmation email within 2-3 business days containing the webinar link. Be sure to check both your inbox and spam folder.
Need Assistance? Contact us at international@fanruan.com.
Why Data Needs Interpretation And Storytelling?
Interpretation adds context, identifies trends, and surfaces the implications behind the numbers. Data and dashboards show you what is happening—but they often don’t explain why it matters. You might assume AI can handle everything, but simply leveraging AI and modeling tools isn't enough to truly have data. What’s missing is a solid foundation in analytical thinking.
Without it, even the most advanced AI tools may generate outputs that lack reliability or relevance. Only with clear reasoning and context can AI effectively support meaningful, data-driven conversations.
That’s where interpretation comes in: it adds context, reveals patterns, and uncovers the implications behind the numbers—turning raw data into real insight.
Whether you're a data analyst or a C-suite leader, your ability to tell a clear data story determines how effectively you can influence strategy, justify investments, or mobilize teams around change.
About Data Storytelling Series
The FanRuan webinar series goes beyond metrics training — it equips you with a structured analytical approach and the critical thinking skills required to interpret data effectively and present insights with real business impact.
You'll also discover how self-service analytics tools like FineBI are critical to your business success and how they can transform your data into actionable insights.
Instructor Profile

Kyra Zhang
FanRuan Training Instructor
00
DAYS
00
HOURS
00
MIN
00
SEC
DATE
Thursday, October 16, 2025
TIME
3:00 pm - 4:00 pm GMT+8
Zoom
© 2024-2026 FanRuan Software Co., Ltd.
All Rights Reserved.