

Introduction
Huaxia Bank was established in October 1992 in Beijing. It is a national commercial bank solely funded and founded by Shougang Group Co., Ltd., making it the only joint-stock commercial bank in China initiated by a manufacturing enterprise.
In recent years, under the policy and regulatory requirements, Huaxia Bank has identified digital transformation as a key strategic initiative. The bank has continuously increased its investment in technology, built a digital talent system, and actively promoted comprehensive digital development.
The primary focus of investment is on digital technology transformation, encompassing multiple key initiatives and departmental transformation plans. These efforts aim to enhance the bank’s fintech capabilities in empowering business growth and improving service efficiency.

Pain Points in Digital Transformation
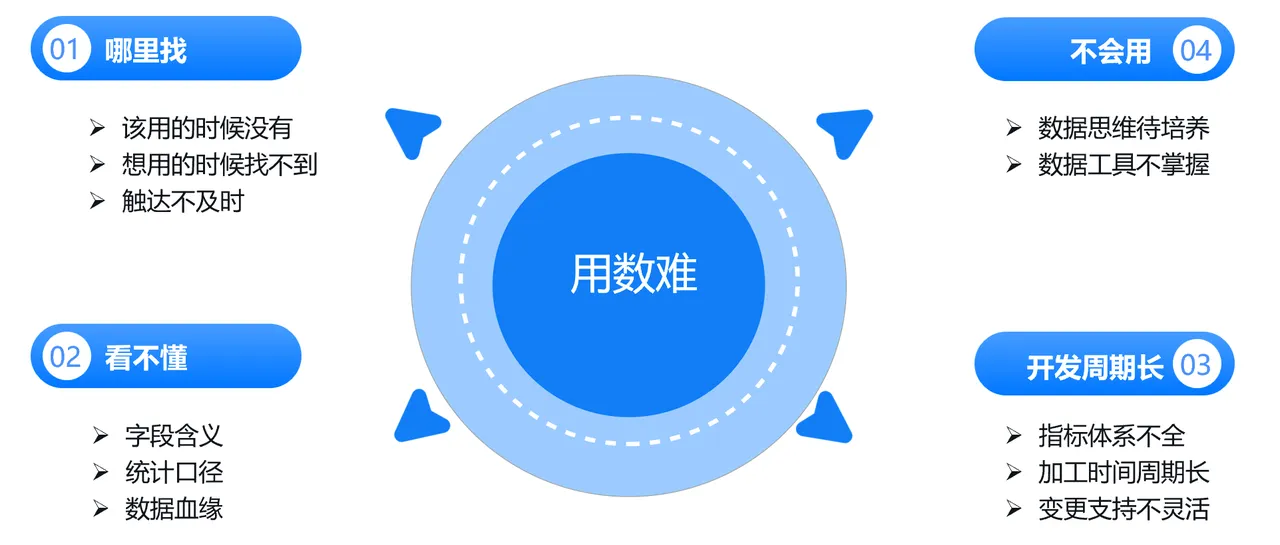
Pain point 1: This is primarily reflected in the difficulty of data access, understanding, usage, and lack of intelligent support. Business users often don’t know where to find the data they need, or simply cannot locate it. Even when they do obtain the necessary data, differences in individual technical skills mean they may not know how to use it effectively. As a result, these tasks end up being handed over to technical teams, leading to longer development cycles.
Pain point 2: It is difficult to establish a unified data management system.
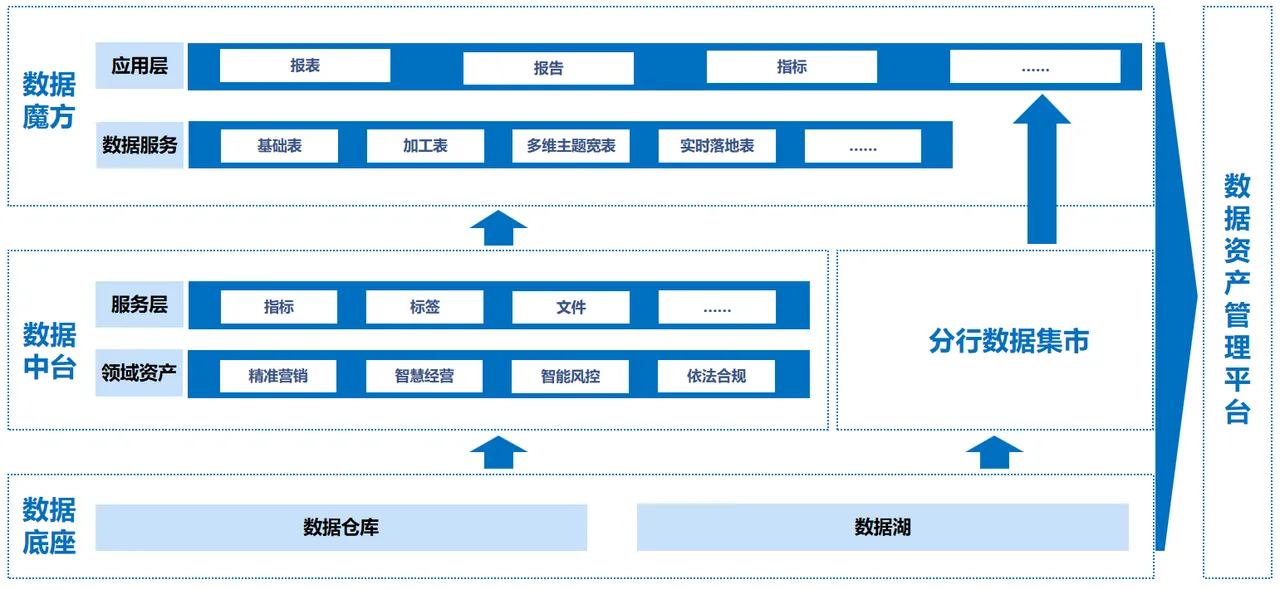
To break down data silos across branches and improve data quality and usability, the headquarters plans to promote the construction of a unified data management framework. However, in reality, different platforms are used by headquarters and branches to store data, making it challenging to ensure data consistency, standardization, and reliability.
4. Application Scenarios
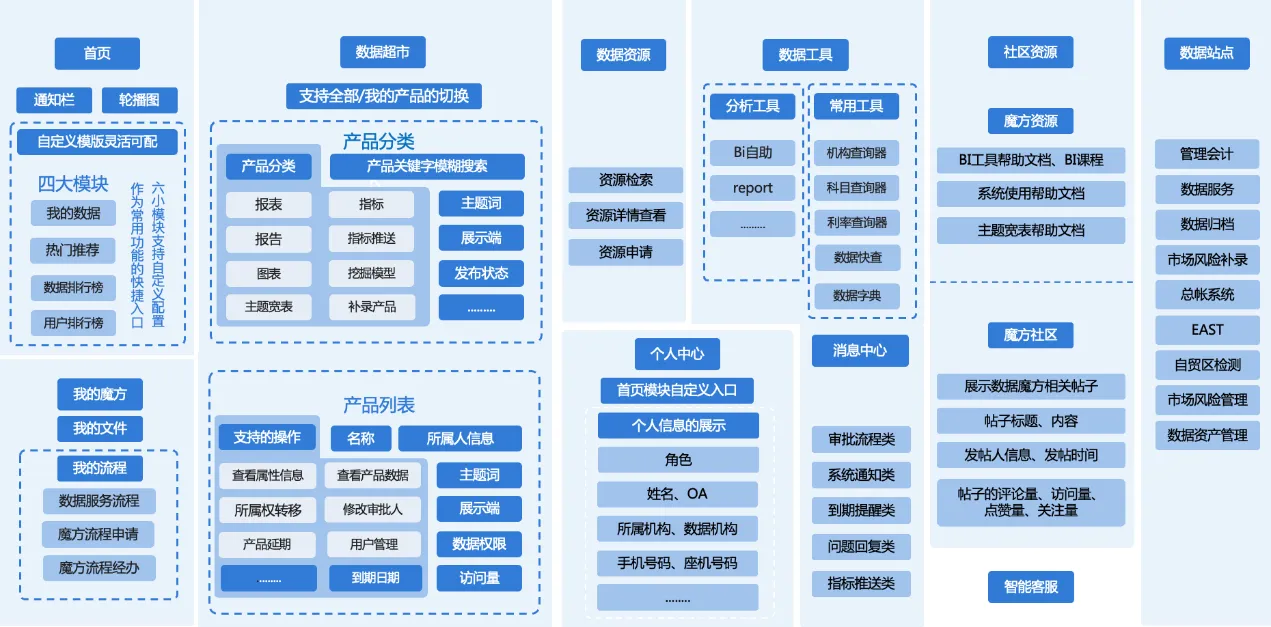
To meet the needs of various users and data analysis situations, the Data Cube platform offers five core types of analysis scenarios, enabling users to effectively explore, utilize, and share data resources:
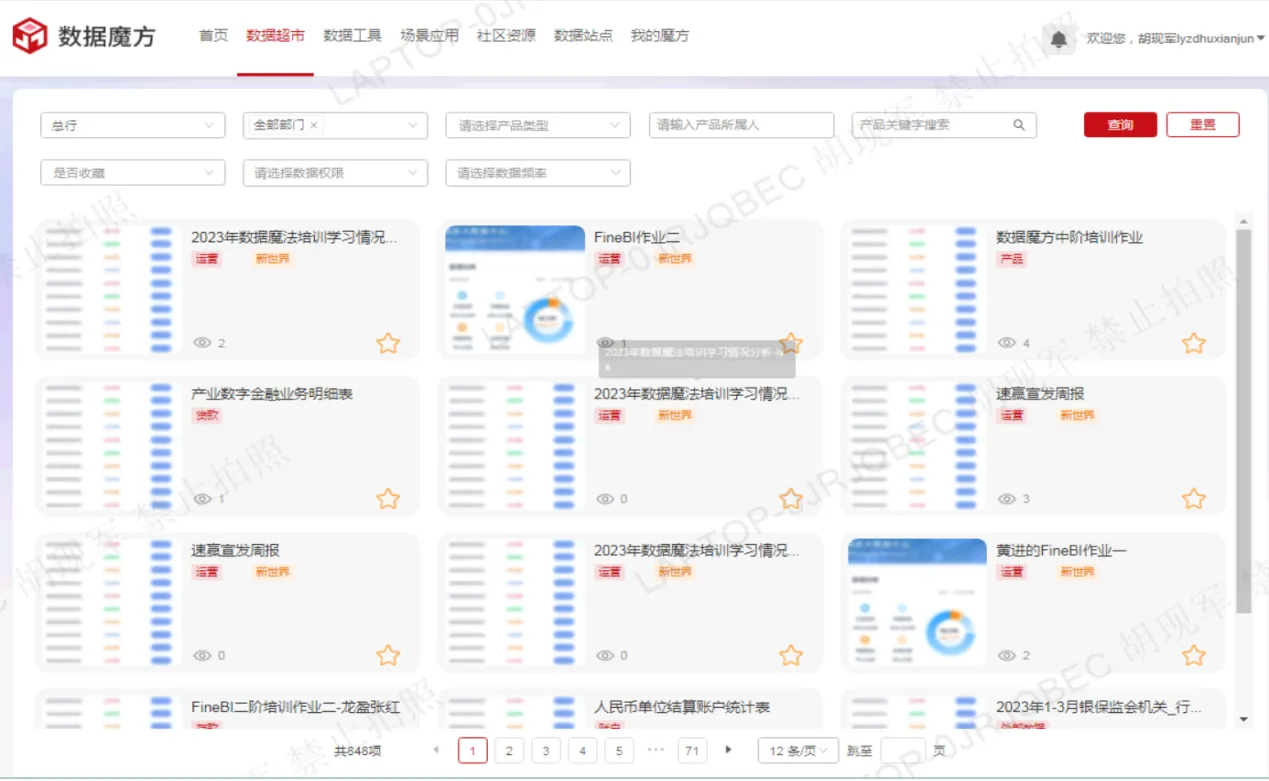
Report Viewing
Conducted through the Data Marketplace module, this scenario provides users with access to a wide range of data products, including reports, dashboards, charts, thematic wide tables, and KPIs.
Popular examples include:Real-time deposit balance reports
Personal pension analytics
Marketing reports for the “Quick Win” campaign
Data Exploration and Analysis
Self-Service Report Creation
Multi-Terminal Publishing and Management of Data Products
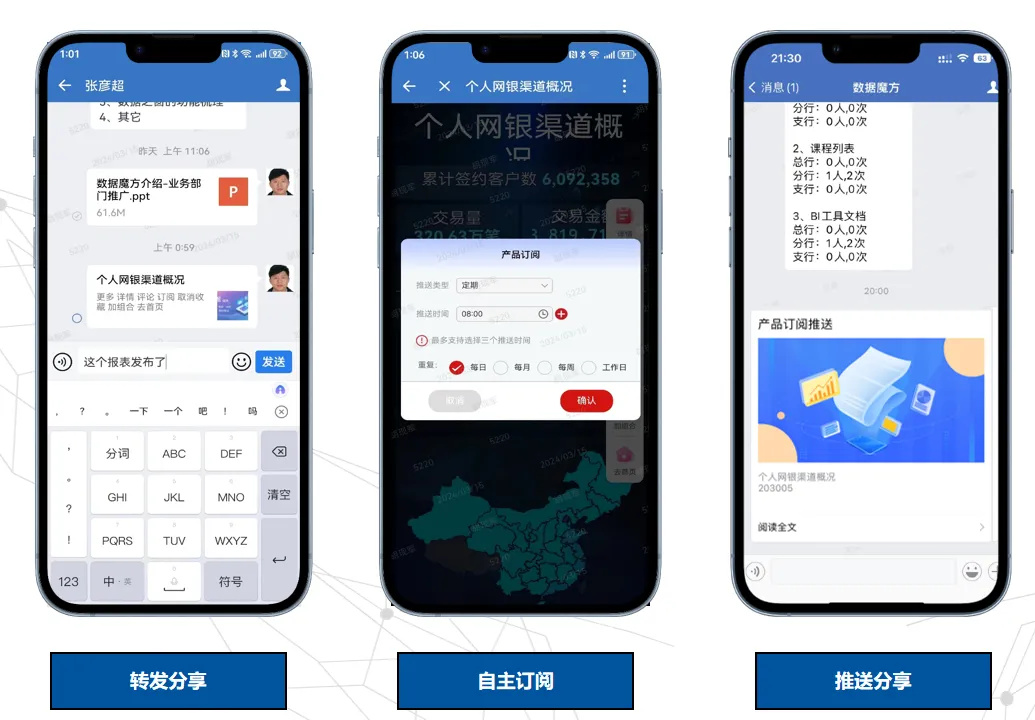
Sharing and Subscribing to Data Products
These scenarios are designed to support users across all departments in turning data into actionable insights efficiently and securely.
2. Data Exploration and Analysis
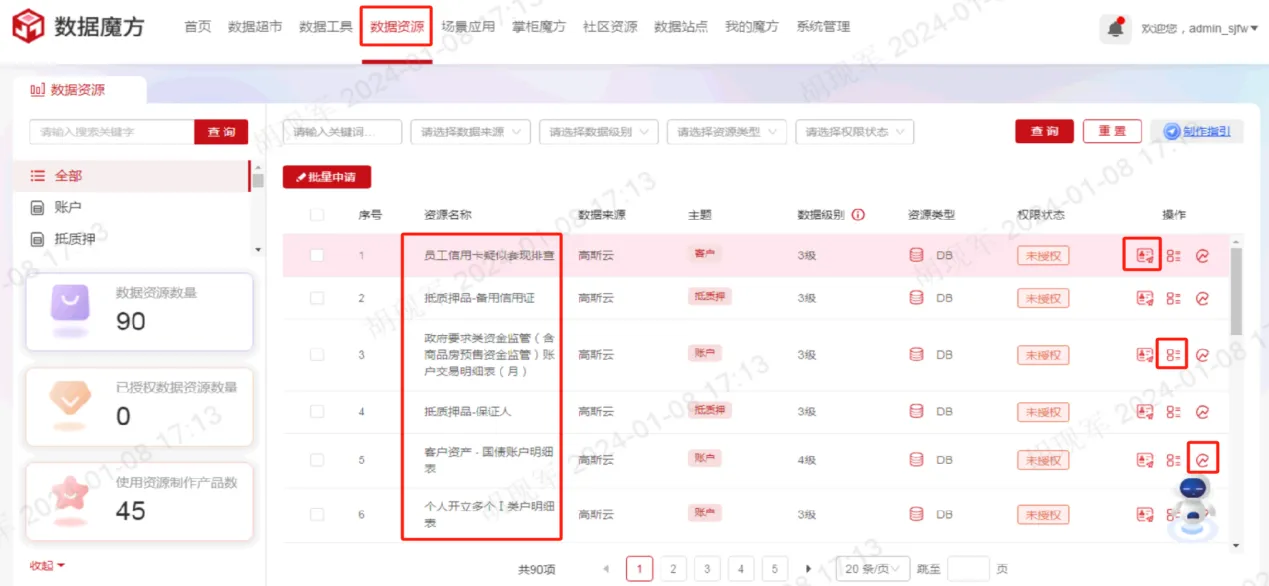
This scenario is executed within the Data Resource module. The “Data Resource” module visualizes curated data tables with business analysis value directly from the database, addressing the common challenge of data discovery for business users.
Key features include:
Efficient Search & Discovery: Business users can easily search for and locate the data they need.
Data Dictionary Access: Each dataset comes with clear metadata and dictionary information to enhance understanding.
One-Click Analysis Access: After obtaining data access permissions, users can jump directly into the visual analysis tool to explore and analyze the data.
This process empowers non-technical users to independently explore high-value data and extract insights without relying heavily on IT teams.
3. Self-Service Report Creation
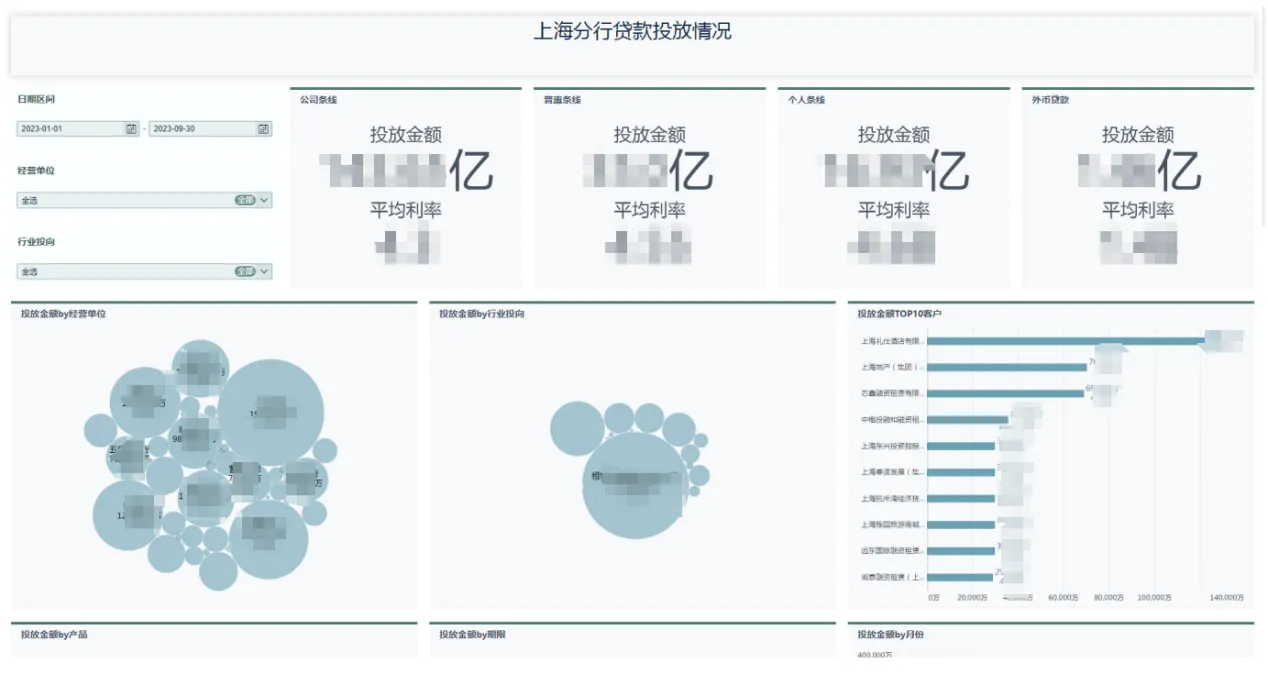
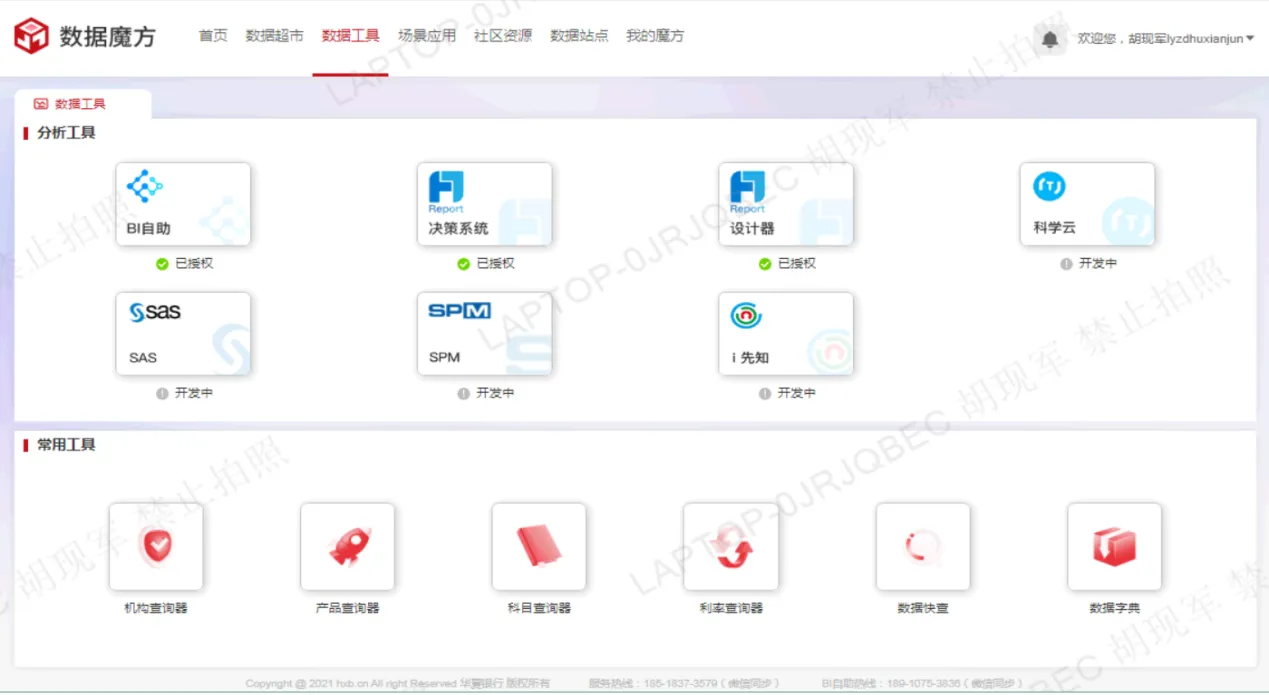
This scenario is realized through the Data Tools module. The Data Cube platform integrates multiple tools including a self-service BI tool, a report development tool, and commonly used query tools, enabling users to conduct data analysis and create reports in a one-stop workflow.
Key Benefits:
Empowered Non-Technical Users: Even users without technical backgrounds can easily analyze data and build reports.
Streamlined Workflow: One platform supports the full reporting process—from data access to visualization—without switching tools.
Increased Efficiency: Reduces reliance on IT support, shortens report development cycles, and improves overall productivity.
This scenario supports a data-driven culture by lowering the barrier to entry for business users and accelerating data adoption across departments.
Business Application Scenarios
In the banking industry, centralized operations at the head office are critical for ensuring standardized and efficient business processes. However, issues such as dispersed operations, data silos, and lack of transparent management pose challenges for the head office in monitoring and optimizing centralized operations. These problems can lead to low operational efficiency, weak risk control, and difficulties in cost management.
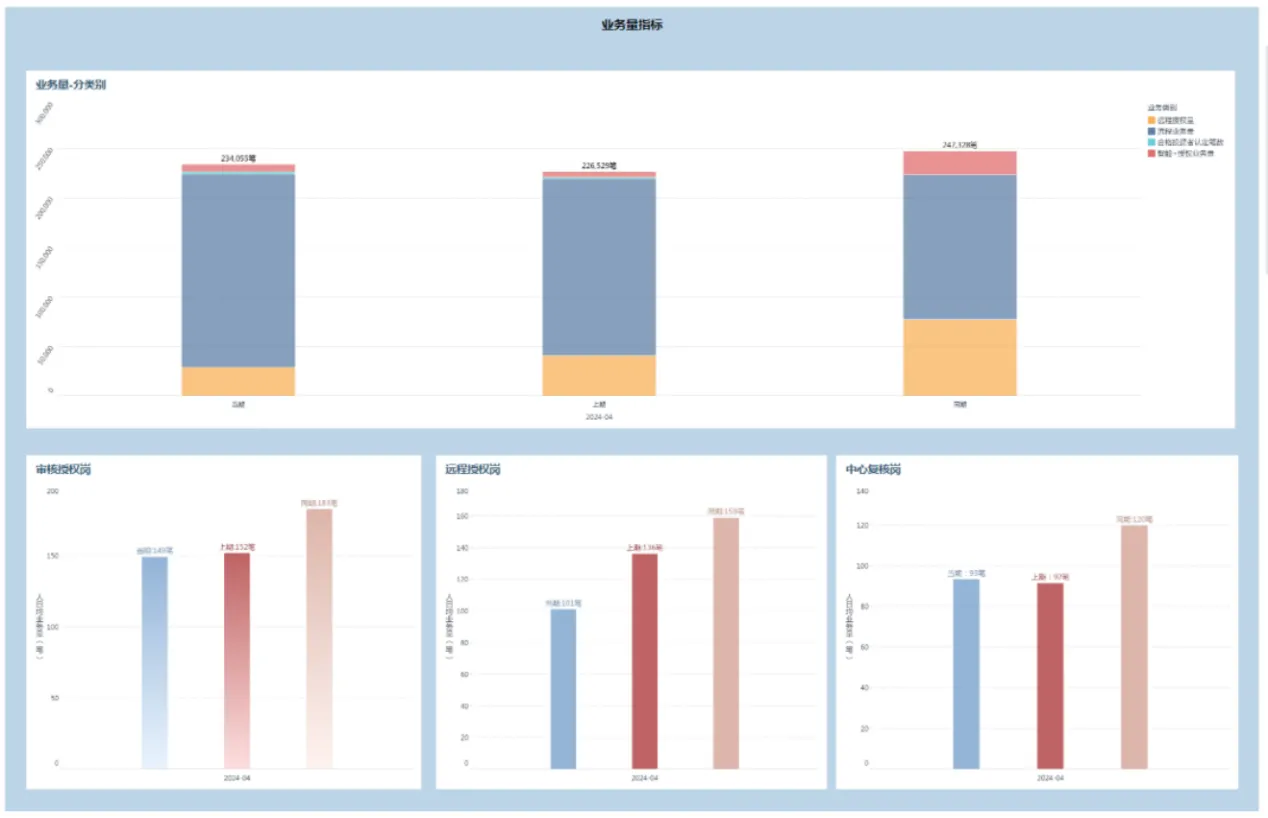
To address these issues, we have designed the "Monthly Report on Centralized Operations at Head Office", which features the following:
Comprehensive Coverage:
The report covers four key dimensions — business volume, business quality, operational efficiency, and outsourced personnel management.Multi-Metric Analysis:
It utilizes 19 performance indicators to provide a holistic view of centralized operations.Historical and Comparative Perspectives:
The report presents trends and current performance from both historical and benchmarking viewpoints.Visualized Charts:
Key metrics are presented through intuitive charts, enabling quick understanding of essential insights.Data-Driven Decision-Making:
It provides a solid data foundation to support more scientific and informed decision-making by management.
The implementation of this monthly report has delivered the following business value and results:
Improved Operational Efficiency:
Monitoring and analysis via the report have reduced processing times, significantly enhancing overall efficiency.Enhanced Risk Management:
The report's quality monitoring helps identify and prevent potential risks, reducing error rates.Optimized Cost Control:
Analysis of outsourced personnel helps optimize resource allocation and reduce outsourcing costs.Better Decision Support:
Data provided in the report empowers management to make more precise business adjustments and resource distribution decisions.Increased Transparency:
Regular publication of the report improves operational transparency, strengthening confidence in internal management and external regulatory oversight.