Company Profile
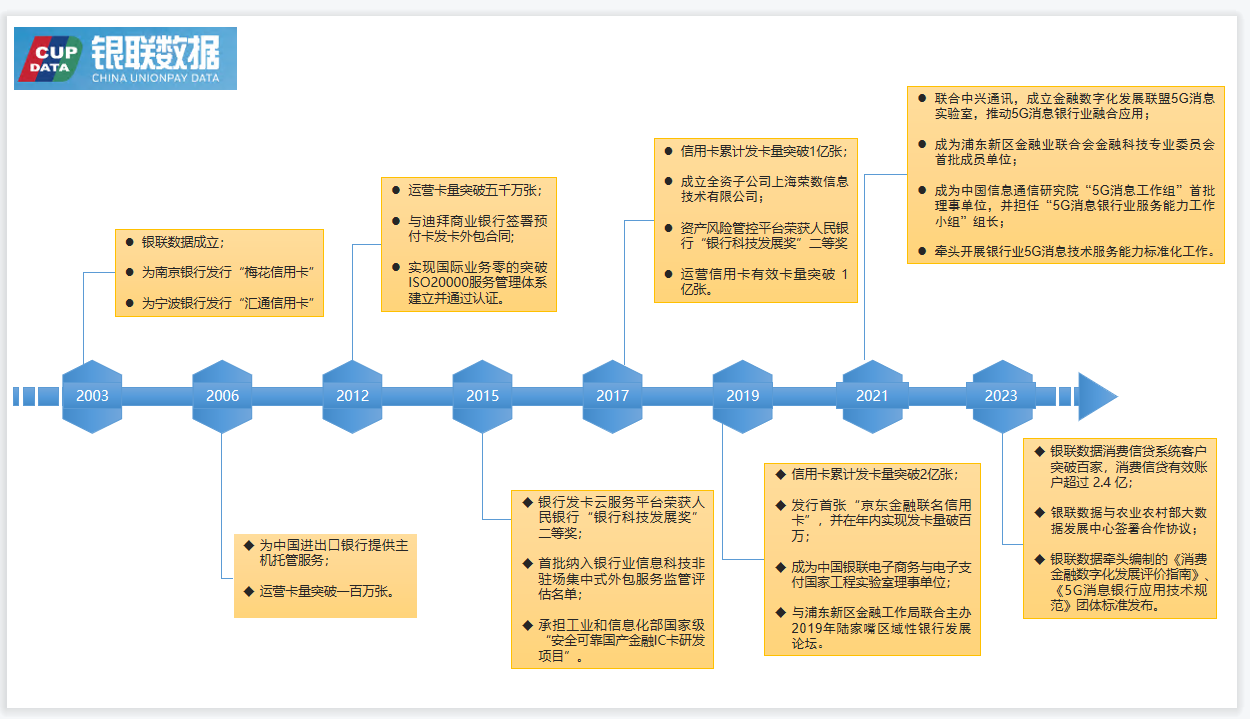
UnionPay Data Services Co., Ltd., a wholly owned subsidiary of China UnionPay, has been committed to becoming a leader in the fintech sector since its establishment in Shanghai in 2003. Driven by innovation, we provide comprehensive account services and management solutions to over 200 financial institutions worldwide. Our services encompass core systems for card issuance, value-added products, consulting, and data analytics. We ensure secure, stable, and efficient operations for hundreds of millions of cards.
The Journey of Digital Transformation
Amid the wave of digitalization, UnionPay Data Services Co., Ltd. stands at the forefront of fintech innovation. We have already provided customized data support services to hundreds of client banks, which has also reinforced our understanding of the central role that data integration and analysis play in business development.
As our business continues to grow, we face challenges related to data fragmentation and inconsistent data platforms. Data consumers at client banks often need to switch between multiple systems to reconcile metrics and access data, resulting in a cumbersome and inefficient process. To improve client satisfaction and meet this challenge, we recognized the need to build a unified and efficient data visualization platform—a breakthrough not only in technology but also in our service model.
In addition, internal operational efficiency and clarity are equally critical. We aim to use BI tools to provide business and IT departments with intuitive reports and real-time dashboards, empowering executives to quickly grasp the overall business landscape and make informed decisions. IT teams also require real-time monitoring of system operations to ensure rapid response and issue resolution.
Data Empowering Business — Boosting Credit Card Revenue
Pain Point
How can we “reactivate” dormant customers and even convert them into high-value clients to generate revenue for banks? We turned to BI for answers—uncovering opportunities and insights from data to implement precision marketing and build personalized, human-centric services.
Solution
By leveraging the powerful data analysis capabilities of the BI platform and a comprehensive set of credit card business metrics, we conducted modeling and analysis of credit card revenue data. This enabled us to identify performance gaps and provide actionable recommendations for business improvement.
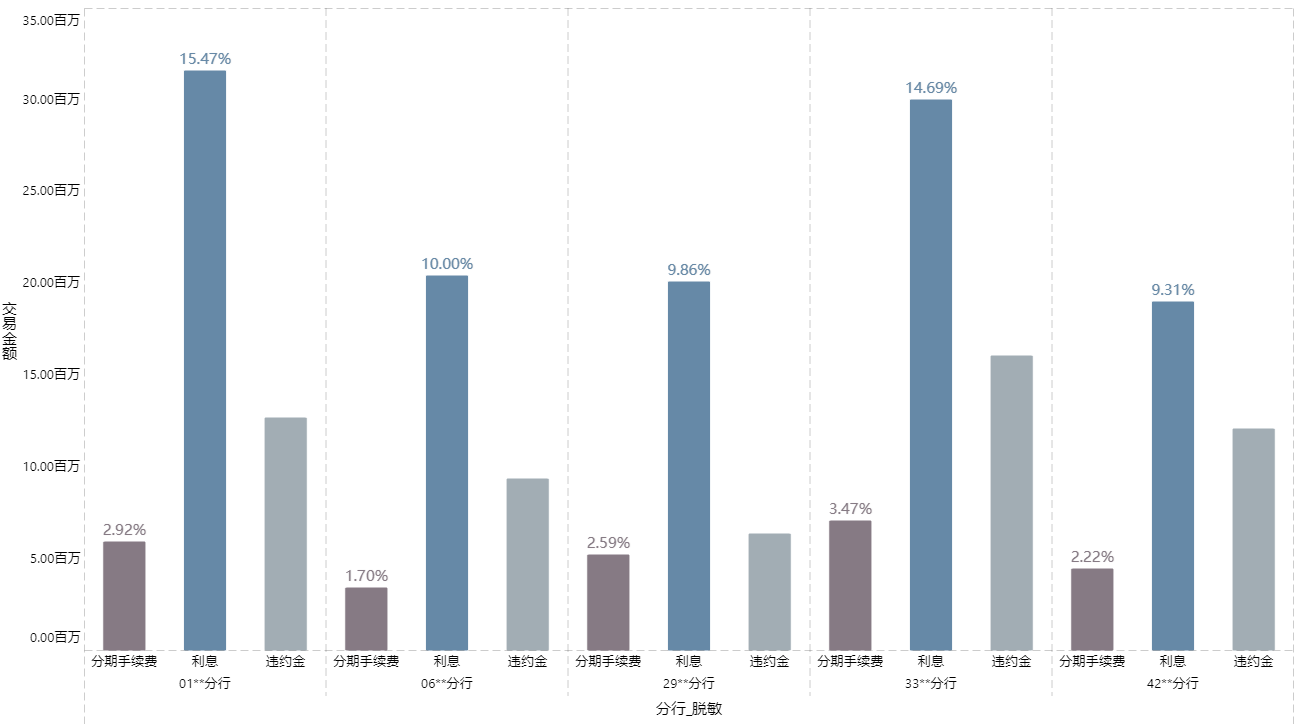
Analysis of Revenue Type Distribution
Using the BI platform, we conducted a visualized analysis of the revenue type distribution across major branches of Bank A for the first three quarters of 2023, as shown in the chart below:
From the chart, we can see that interest income accounts for a significant proportion across all branches of the bank. In contrast, installment service fees not only contribute a smaller share but also fluctuate greatly between branches, indicating that installment service fees could be a key focus area for income analysis and improvement.
Card Usage Conversion Analysis
By analyzing data across key credit card lifecycle stages—application → activation → first transaction → active usage → income generation—the BI platform’s funnel model clearly illustrates conversion rates at each stage. This helps identify where potential user drop-offs occur, enabling the bank to take targeted action to optimize customer engagement and maximize revenue.
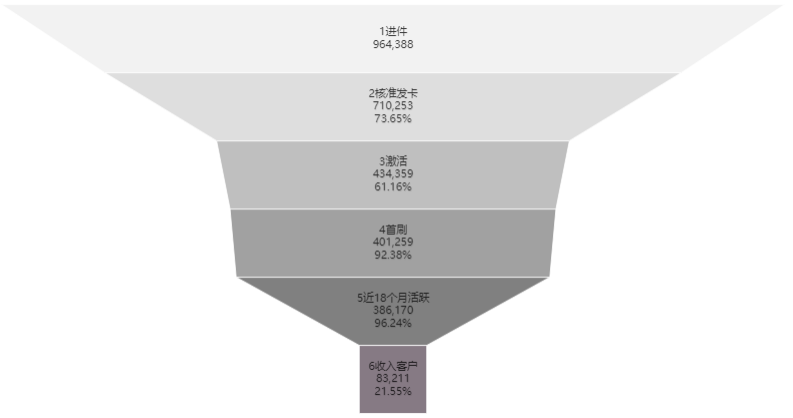
From the chart, we observe significant customer drop-offs at three key stages:
Stage 1: Declines are largely due to approval rules and applicant qualifications. To improve this, banks could focus on enhancing application quality through better targeting and education.
Stages 2 and 3: These are priority focus areas:
Activation stage: Strategies include sending timely SMS reminders, offering first-swipe cashback promotions, and launching campaigns to encourage card activation.
Conversion to revenue-generating users: Efforts here may include boosting customer stickiness through credit limit increases, installment offers, discounted interest rates, and personalized recommendations.
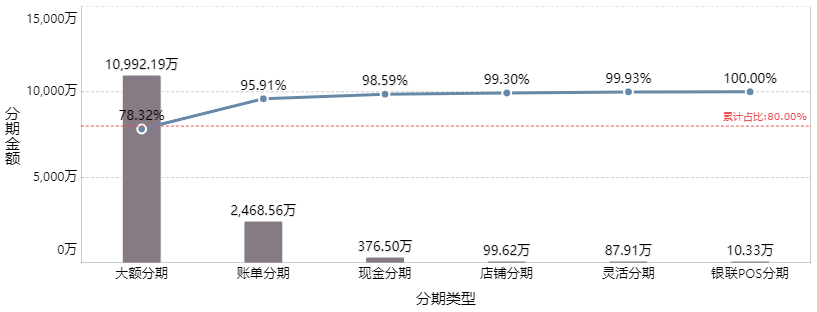
Installment Type Analysis
Using the BI platform and a Pareto model, we analyzed historical data by installment type. The results show that large-sum installments and bill installments account for over 95% of all installment transactions—with large-sum installments alone comprising 78%.
This reveals significant untapped potential in bill installment growth. As a result, we’ve identified expanding bill installment volume as the next key analysis and optimization target for revenue growth.
BI Empowers Data Modeling — More Efficient Marketing
Challenges
Building customer profiles often faces several key difficulties, such as:
Accurately collecting, processing, and analyzing data;
Adequate understanding of the target customer group;
High complexity and technical expertise requirements, which increase the difficulty of executing effective precision marketing;
The core modeling process itself is highly technical and professional, making it hard for business teams to fully comprehend and utilize.
Solution
The application team developed an internal data bus platform to:
Integrate data from various sources;
Quickly and accurately collect valuable information;
Minimize the effort needed for data cleaning and preparation later in the process.
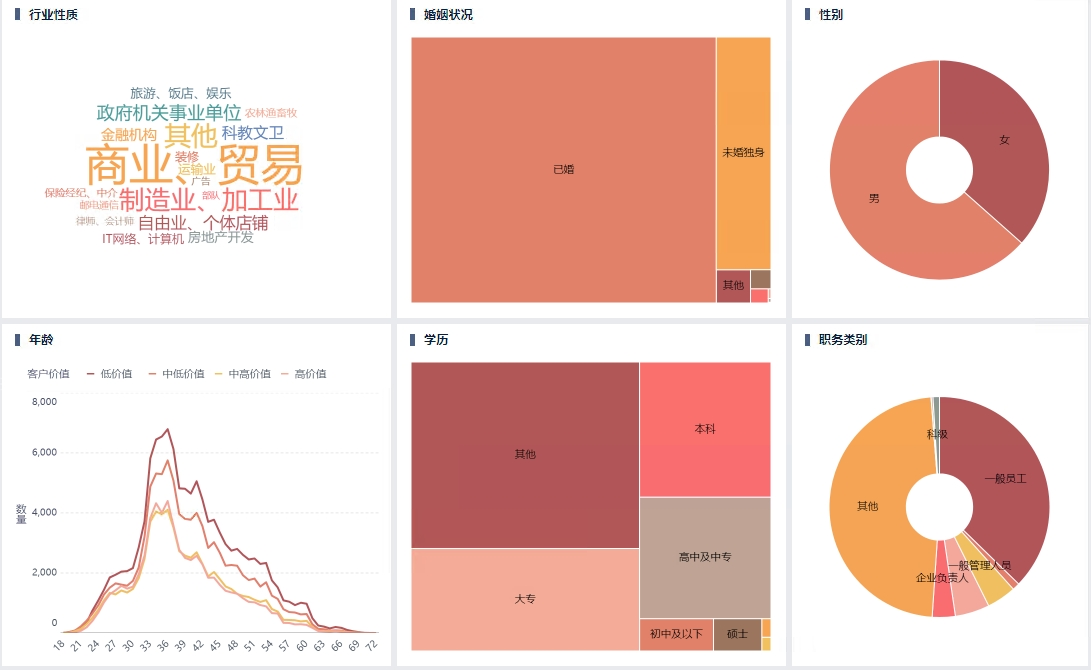
The customer value model built based on large-scale data has achieved a 90% accuracy rate in identifying customer value. This model enables precise recognition of customer segments, supporting the bank’s goal of distributing different levels of cashback incentives and boosting customer engagement.
Moreover, the visual charts generated through the BI platform help technical teams to optimize the model and allow business teams to better understand how the model works. This makes it easier to adjust and fine-tune marketing strategies in real time, ensuring sustained campaign effectiveness and providing strong support for strategic marketing optimization.
Conclusion and Outlook
The implementation of this project has laid a solid foundation for expanding data applications to a broader range of business scenarios, such as customer acquisition, customer engagement, and risk management within the credit card domain. Continuous iteration of the data metrics system has further enhanced the depth of data utilization, encouraging greater adoption of BI tools by business personnel. Ultimately, this supports the goal of empowering business growth through data.
At the same time, the project has deepened our understanding of the relationship between data and business. Data is the backbone of business operations, providing a basis for decision-making, optimizing processes, improving efficiency, and driving revenue growth. In essence, data and business are mutually reinforcing. Only through the tight integration of data and business can organizations achieve greater success and sustainable development.
As digital transformation accelerates, presenting data clearly and meaningfully to non-technical stakeholders has become increasingly crucial. FanRuan’s BI tools offer such an interactive platform—one that enables data professionals to “tell the story behind the data.” Within this positioning, we look forward to FineBI introducing more expressive visualization methods, advanced analytical techniques, and optimized user interactions, making data more accessible, more powerful, and more professional—ultimately empowering industries across the board.