Company Profile

Founded in April 1993, BOE Technology Group Co., Ltd. is a leading Internet of Things (IoT) innovation enterprise that provides intelligent interface products and professional services for information interaction and human health. BOE has developed a business architecture of “1+4+N+ecosystem,” with semiconductor displays at its core, supported by IoT innovation, sensors and solutions, Mini/Micro LED (MLED), and smart medical engineering integration.
As a global leader in the semiconductor display industry, BOE has led China's display sector from nothing to something, from small to large, and from large to strong. Today, one out of every four smart devices worldwide features a display screen manufactured by BOE. Its ultra-high-definition, flexible, and micro-display solutions have been widely adopted by renowned domestic and international brands.
According to global market research firm Omdia, in 2023, BOE ranked first worldwide in LCD panel shipments across five major application categories: smartphones, tablets, laptops, monitors, and TVs.
Business Needs & Challenges
Data Fragmentation
During production and operations, BOE accumulates large volumes of diverse data, including production-related data (equipment operation status, output performance, product quality inspection results, defect rates), and operational management data (finance, HR, procurement, sales), as well as external market data (market demand, industry trends, competitor information). These datasets are scattered across multiple systems, making centralized management and analysis difficult.
Inconsistent Definitions
For the same metrics, different departments or teams may have varying definitions and interpretations. The same metric may even originate from different data sources, each differing in data quality, structure, and update frequency, leading to inconsistent representations of the same business phenomenon.
Limited Data Utilization
Many users rely on paper reports or spreadsheets for data presentation and decision-making. Data generated by business systems often fails to integrate with actual operations. Moreover, IT and business staff often lack data analysis thinking. Most current reports are descriptive in nature, with very few diagnostic, predictive, or prescriptive reports, making it difficult to deeply integrate data with business scenarios and unlock its value.
Solutions
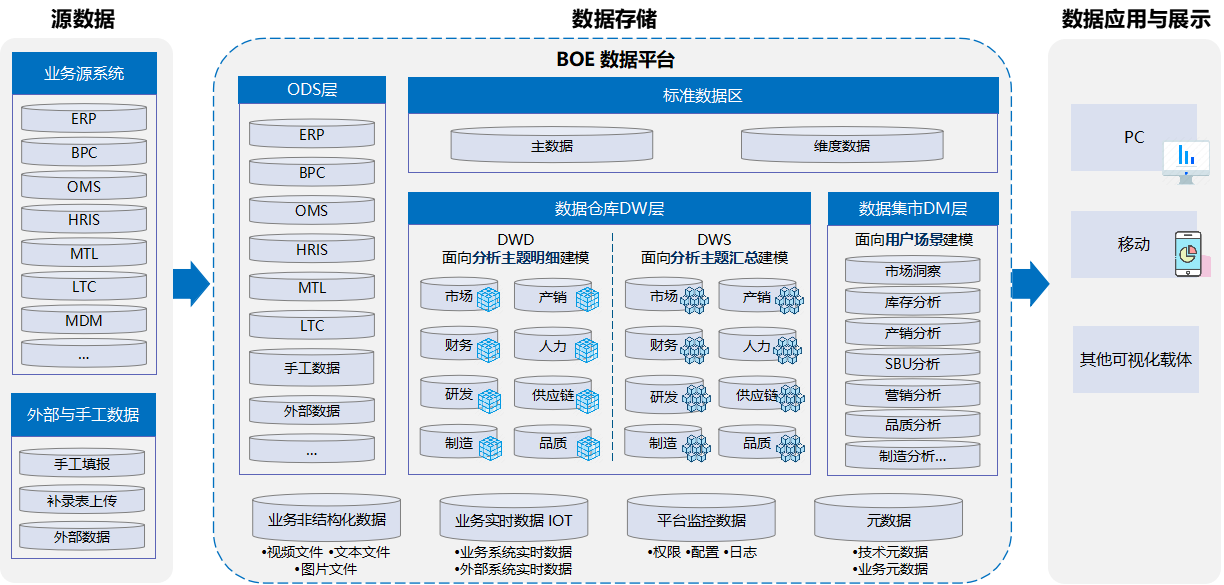
1. Breaking Down Data Silos and Enabling Data Integration
A data warehouse was built to consolidate data from business systems, external sources, and manual inputs into the ODS layer. Based on this, general models and metric calculation models were developed. At the top-tier data mart layer, business scenario modeling was conducted to support both PC and mobile applications. This project completed over 200+ model designs and builds, enabling automated data integration and significantly improving data processing efficiency and accuracy.
2. Standardizing Metric Definitions
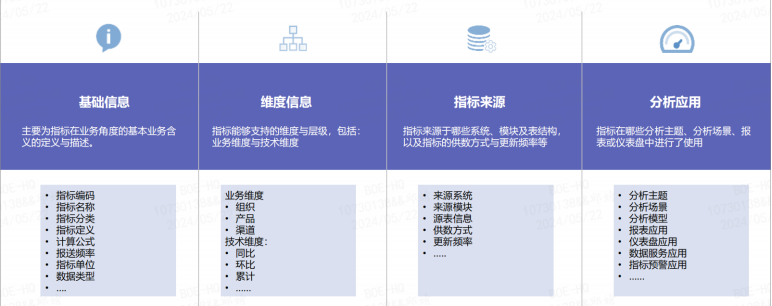
Inconsistent metric definitions and lack of centralized management often lead to misinterpretations, communication barriers across teams, redundant designs, and repeated development efforts. To address these issues, the project team established standardized rules for metric naming and definitions, and implemented a unified structure for metric attributes, as illustrated below.
Additionally, metric owners were designated to ensure consistency and alignment across different teams. A total of 257 metrics were unified during this project, covering various domains such as production and sales, SBUs, inventory, and supply chain operations.
3. Building a Metric System & Analytical Framework for Holistic Insights
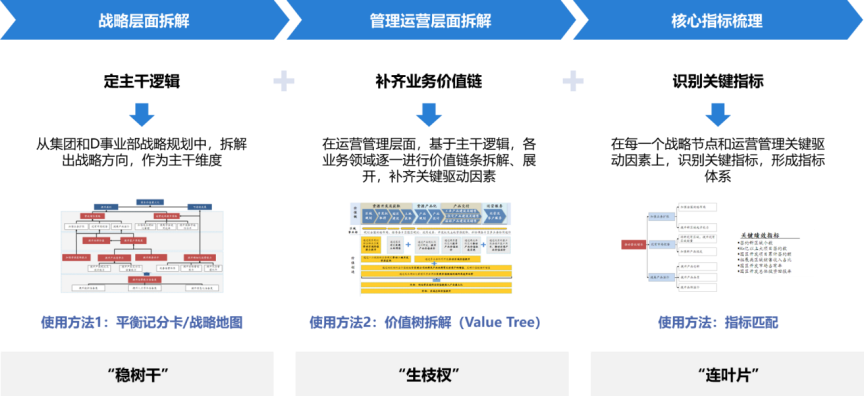
By leveraging tools such as the Balanced Scorecard and value tree decomposition, the project systematically mapped out core business processes across strategic and operational levels. Each value chain was broken down to identify key drivers, which were then matched with corresponding performance metrics to form a comprehensive metric system.
Building on this foundation, a unified and integrated operational analysis framework was designed to align with critical business scenarios. This framework vertically connects all levels—from the CEO to execution teams—enabling comprehensive oversight and management support, and ultimately achieving full-spectrum business insights.
Business Applications
Scenario 1: Planning & Operations KPI Dashboard
Challenges / Pain Points / Needs / Key Drivers
As enterprise scale and business complexity grow, traditional manual methods can no longer meet the need for rapid decision-making. There is an urgent need to centralize key performance indicators (KPIs) from multiple departments into a single dashboard to help users monitor business performance, identify risks early, and take timely action.
Solutions
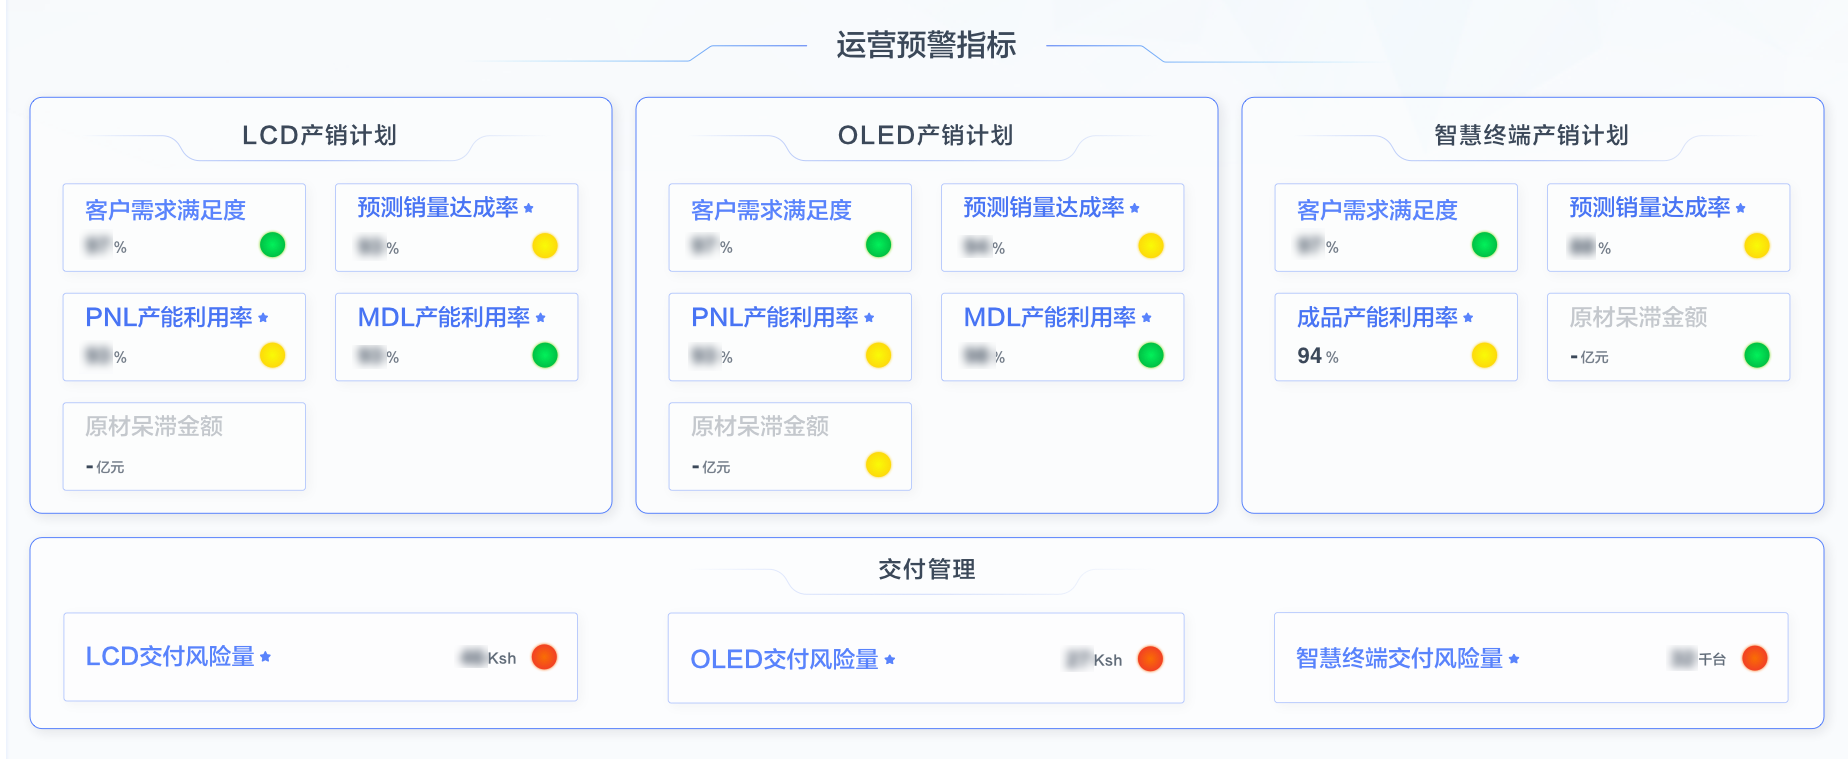
Operations KPI Dashboard:
Consolidate all key planning and operations metrics into a unified dashboard, categorized by business segments (LCD, OLED, Smart Terminals), for clear and structured display.
Traffic Light Alerts:
Set specific monitoring thresholds for each KPI. Actual performance is compared against the thresholds and displayed using color-coded indicators (e.g., red/yellow/green) to reflect real-time status.
Drill-Down KPI Details:
For any abnormal indicators, users can drill down into a detailed view for deeper analysis and root cause investigation.
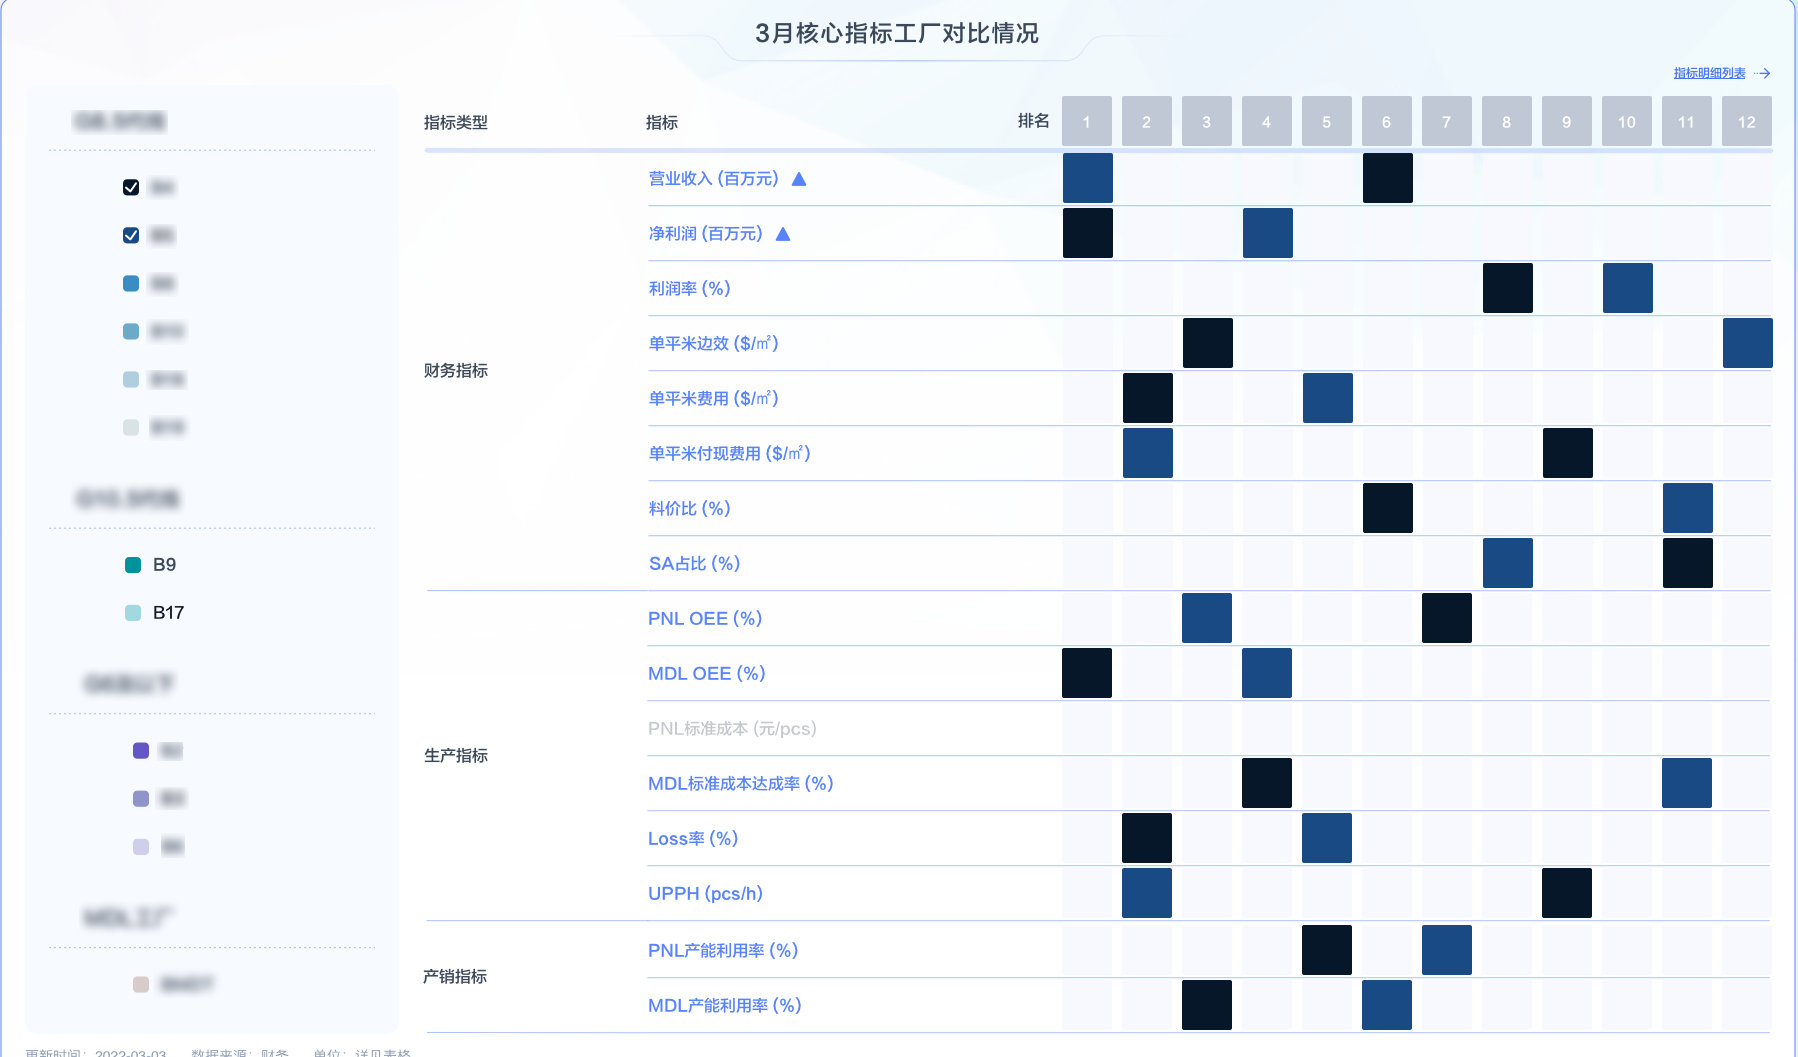
Scenario 2: Cross-Factory Benchmarking Analysis
By leveraging a unified data platform (data middle platform), data from various factories is integrated and standardized. Consistent KPI definitions are established for shared metrics, enabling the creation of a centralized factory benchmarking analysis platform. Specific implementations include:
Core KPI Benchmarking:
Select 16 key indicators across three major categories—finance, production, and sales & operations. Use heatmaps to visually compare performance across factories, with higher values ranked more prominently for quick identification of gaps and opportunities.2. Product-Specific Benchmarking Analysis
In addition to comparing overall key performance indicators, 7 critical metrics are selected for specific products to enable targeted benchmarking. This helps each factory gain a comprehensive understanding of a product’s performance across multiple dimensions, including production efficiency, sales outcomes, cost management, and quality control.
Conclusion and Outlook
The successful implementation of this project has brought significant transformation and value to the enterprise. First, by conducting in-depth analysis of business scenarios, we accurately identified key operational issues and bottlenecks, providing strong data support for executive decision-making. Second, the project has accelerated the company’s digital transformation, improving both data processing and decision-making efficiency.
Throughout the implementation process, we also accumulated valuable experience and best practices. Clear communication and collaboration across teams ensured the timely flow and sharing of project information. By adopting advanced data analysis tools and methodologies, we significantly enhanced the accuracy and efficiency of data insights. Moreover, close collaboration with business departments ensured that the outcomes of the analysis effectively met operational needs.
The project further underscored the critical importance of digital transformation. It is not only a means to improve operational efficiency but also a driver of new business opportunities. As such, we are committed to increasing investment in digital initiatives to support long-term sustainable growth.
Looking ahead, we will build on the foundation laid by this project to further deepen our efforts. We plan to continue optimizing our data analysis tools and techniques to enhance accuracy and efficiency. At the same time, we will strengthen collaboration with business units to ensure that analytics outcomes are more aligned with operational goals, while continually refining our KPI system. Additionally, we will closely monitor emerging technologies and actively explore the application of artificial intelligence, big data, and other innovations in business operations and analytics.


