A data analyst helps organizations make sense of their data. You collect information from various sources, clean it to remove errors, and organize it for analysis. By examining this data, you uncover patterns, trends, and insights that guide smart decisions. For example, you might identify why sales dropped or predict future customer preferences. Understanding what does data analyst do shows how vital this role is in solving problems and driving success in any industry.
Key Takeaways
Data analysts gather and sort data to find useful information.
They clean, study, and show data to give clear results.
Knowing coding languages like Python, R, and SQL is important.
Tools likeFineBI and Tableau make data easy to understand.
Good problem-solving and talking skills help share data ideas.
More companies need data analysts, so jobs are growing fast.
Learning new things and knowing trends improve job chances.
Doing real projects shows your skills and helps get hired.
What Does Data Analyst Do?
Overview of the Role
As a data analyst, you play a crucial role in helping organizations make sense of their data. Your primary responsibility involves collecting, organizing, and analyzing data to uncover patterns and trends. These insights guide decision-making and solve business problems. For example, you might analyze customer purchasing behavior to identify opportunities for targeted marketing or use historical sales data to forecast future revenue.
To achieve these outcomes, you rely on various analytical methods. Here’s a quick look at some techniques you might use:
Method
Description
Example
Cluster Analysis
Groups similar data points together based on characteristics.
Segmenting customers into groups based on purchasing behavior for targeted marketing campaigns.
Time Series Analysis
Analyzes data points over time to identify trends and make forecasts.
Forecasting monthly sales for the next year based on five years of historical sales data.
Factor Analysis
Identifies underlying factors that explain correlations among variables.
These methods allow you to extract actionable insights, making your role indispensable in today’s data-driven world.
Importance of Data Analysts in Modern Businesses
In modern businesses, your role as a data analyst is more critical than ever. Organizations increasingly rely on data to stay competitive and adapt to market changes. By analyzing data, you help businesses make informed decisions, optimize operations, and enhance customer experiences.
Here are some ways your work contributes to business success:
Improved decision-making: You provide objective insights that guide strategic choices.
Increased efficiency: Your analysis identifies bottlenecks and streamlines processes.
Enhanced customer experience: You personalize offerings based on customer data.
Competitive advantage: Your insights help companies adapt strategies to market trends.
The growing demand for data analysts reflects this importance. The global market for big data analytics reached $271.83 billion in 2022 and is projected to grow to $745.15 billion by 2030. Additionally, the employment of data analysts is expected to grow 11% from 2021 to 2031, outpacing the average for all occupations. These statistics highlight the expanding opportunities in this field and the value you bring to organizations.
How FanRuan Empowers Data Analysts with FineBI and FineDataLink
FanRuan provides powerful tools like FineBI andFineDataLink to support your work as a data analyst. These tools simplify complex tasks, enhance efficiency, and enable you to deliver impactful insights.
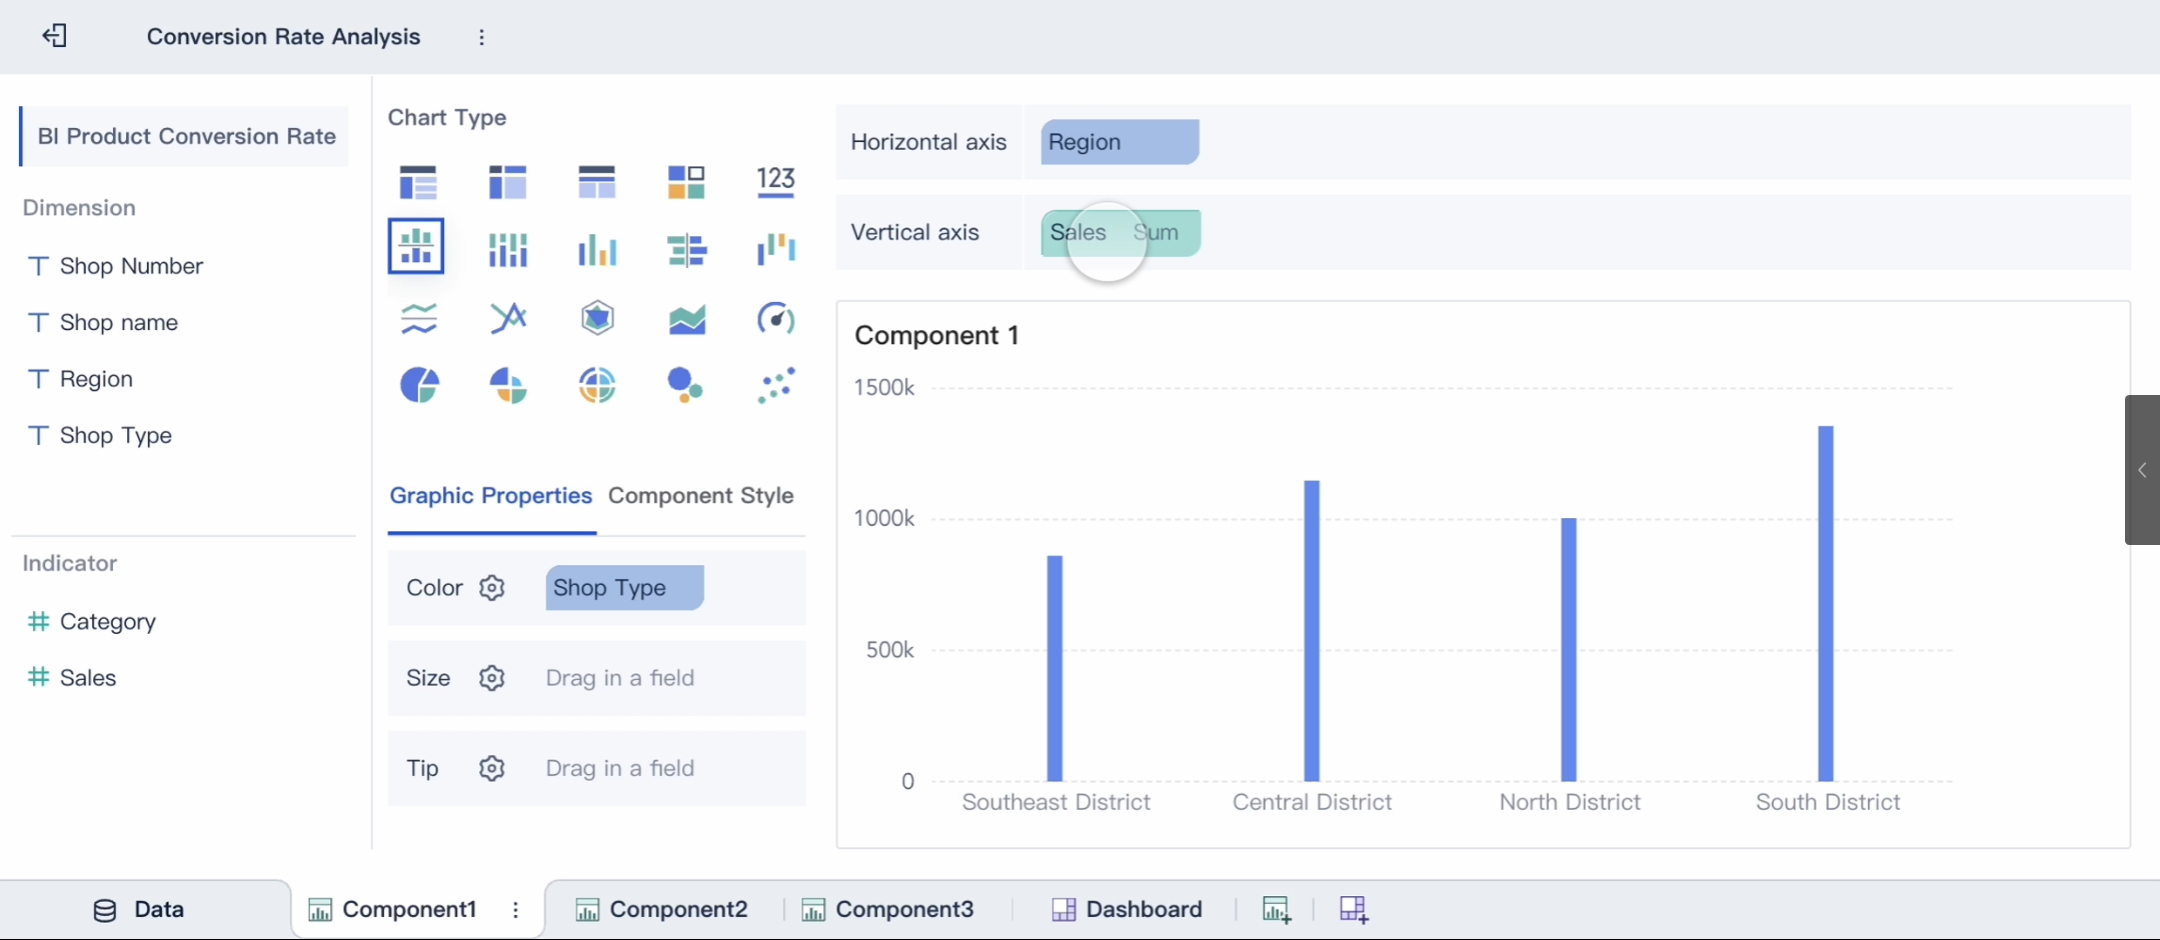
FineBI is a self-service business intelligence tool designed to make data analysis accessible. Its drag-and-drop interface allows you to explore data without needing advanced technical skills. With FineBI, you can connect to various data sources, create interactive dashboards, and perform real-time analysis. For example, its OLAP analysis feature lets you drill down into data, uncover trends, and generate actionable insights. FineBI also supports collaboration, enabling teams to share dashboards and work together seamlessly.
OLAP Analysis
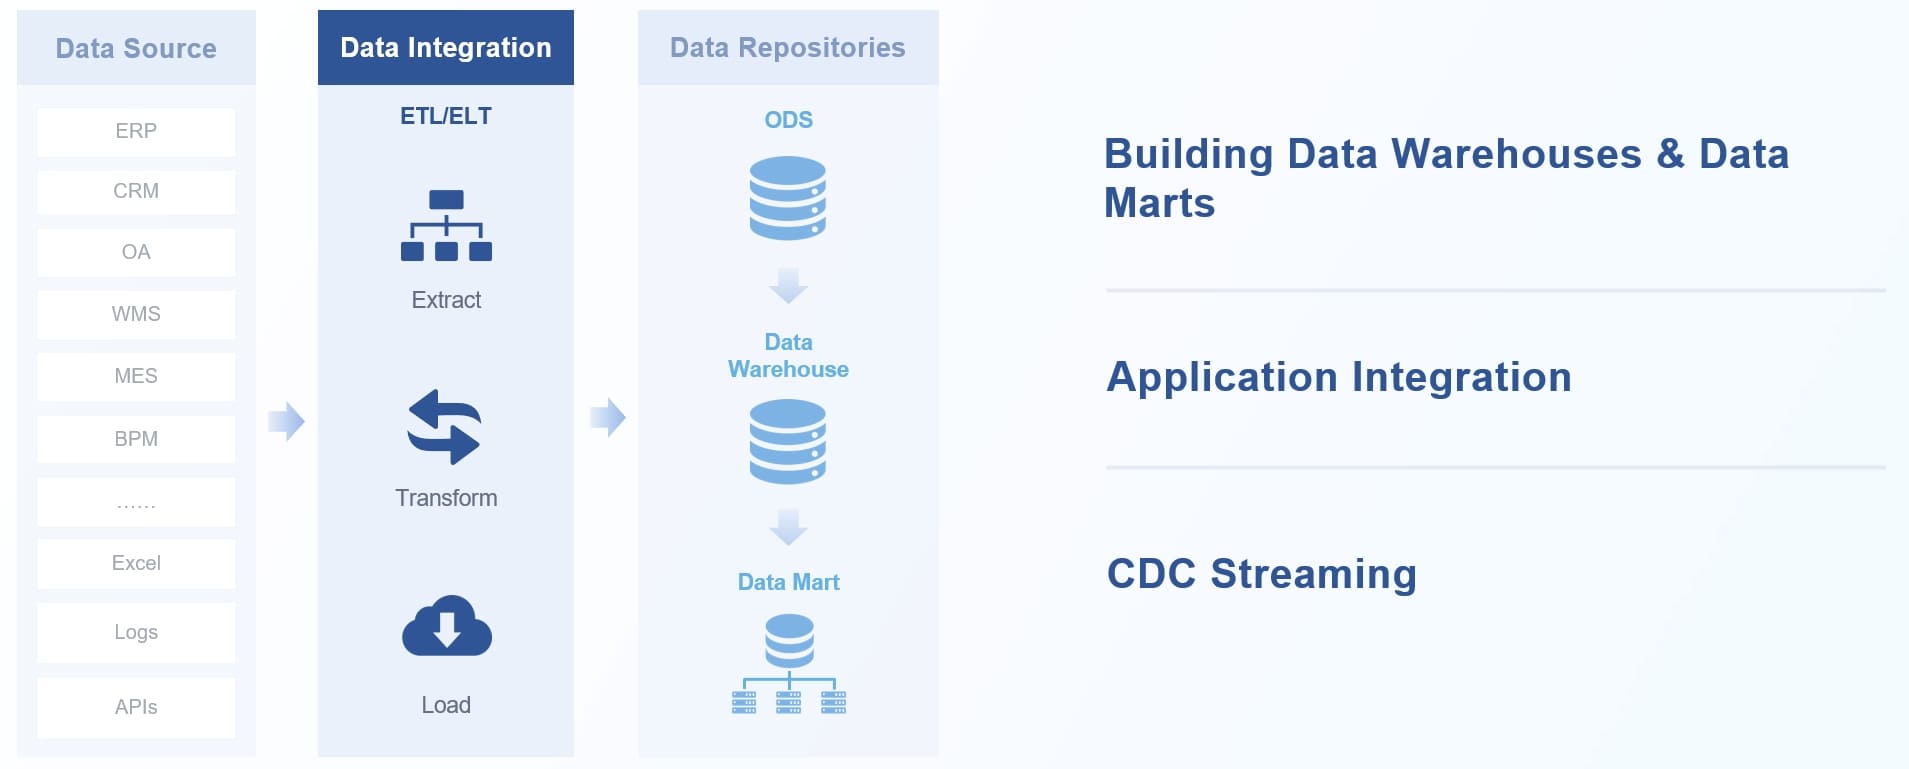
FineDataLink, on the other hand, focuses on data integration. It helps you manage data from multiple sources, ensuring accuracy and consistency. Its real-time synchronization feature allows you to build data pipelines with minimal latency, making it ideal for tasks like database migration or creating real-time data warehouses.
FineDataLink’s low-code platform simplifies complex ETL processes, saving you time and effort.
Together, these tools empower you to excel in your role. FineBI enhances your ability to analyze and visualize data, while FineDataLink ensures you have access to high-quality, integrated datasets. By leveraging these solutions, you can focus on delivering insights that drive business growth.
Tip: Explore how FineBI and FineDataLink can streamline your workflow and boost your productivity. Visit FanRuan’s website to learn more.
Gathering data from diverse sources like databases, APIs, and spreadsheets.
As a data analyst, one of your primary roles is to gather data from various sources. These sources include databases, APIs, spreadsheets, and even external platforms like social media or customer feedback tools. You ensure that the data you collect is relevant to the problem you're solving. For example, if you're analyzing customer behavior, you might pull data from a CRM system, website analytics, and sales records.
To measure the efficiency of your data collection methods, you can rely on quantitative metrics. Here's a table summarizing some useful measures:
Measure
Description
Response Rates
Percentage of users who chose each response in a survey, summarizing audience opinions.
Cross-tabulation
Comparing responses between groups to understand variations in behavior and preferences.
Mode
The most common answer in a dataset, useful for identifying popular responses.
Median
The middle value in a dataset, helpful for understanding central tendencies without outliers.
Mean (Average)
The sum of data points divided by the number of responses, representing the overall dataset.
Volume of Responses Over Time
Analyzing response trends over time to gauge the effectiveness of data collection methods.
Net Promoter Score (NPS)
A measure of customer loyalty and satisfaction, calculated based on customer recommendations.
By using these measures, you can evaluate how well your data collection strategies are working and make adjustments as needed.
Ensuring data accuracy and completeness during collection.
Accuracy and completeness are critical when collecting data. Inaccurate or incomplete data can lead to flawed analysis and poor decision-making. You verify the data by cross-checking it against reliable sources and using automated tools to identify discrepancies. For instance, if you're collecting sales data, you might compare figures from different systems to ensure consistency. By maintaining high standards during this stage, you set the foundation for meaningful analysis.
Identifying and correcting errors or inconsistencies in datasets.
Once you've collected the data, the next step is cleaning it. This involves identifying and fixing errors or inconsistencies. Common issues include duplicate entries, missing values, and incorrect formats. For example, you might find that some dates are formatted differently or that customer names are misspelled. You can use tools like Python or Excel to automate these corrections, saving time and reducing errors.
Data cleaning is essential for accurate analysis. Techniques like handling missing data through imputation or deletion ensure data integrity. Detecting outliers using box plots or z-scores prevents skewed results. Normalization and standardization make variables comparable, enhancing the reliability of your analysis.
Structuring raw data into usable formats for analysis.
Raw data is often messy and unstructured. Your job is to organize it into a format suitable for analysis. This might involve creating tables, categorizing data, or converting text into numerical values. For instance, if you're analyzing customer reviews, you might assign sentiment scores to each review to quantify customer satisfaction. Structuring data in this way makes it easier to apply statistical methods and uncover insights.
Data Analysis and Modeling
Using statistical methods to uncover patterns and trends.
After preparing the data, you analyze it to find patterns and trends. Statistical methods like regression analysis, clustering, and time series analysis help you make sense of the data. For example, you might use time series analysis to identify seasonal sales trends or clustering to group customers based on purchasing behavior. These methods allow you to extract actionable insights that drive business decisions.
Building predictive models to forecast outcomes.
Predictive modeling is another key responsibility. You use techniques like logistic regression, decision trees, and neural networks to forecast future outcomes. For instance, logistic regression can help detect fraud in financial transactions, while decision trees are useful for segmenting customers. Here's a table summarizing some common predictive models and their applications:
Technique
Application in Real-World Use Cases
Logistic Regression
Used in the financial sector to detect and prevent fraud.
Decision Trees
Popular for their interpretability and handling of various data types.
Neural Networks
Effective for modeling complex relationships and large datasets.
Linear Regression
Valued for its simplicity and statistical inference capabilities.
Random Forests
Combines multiple decision trees for improved accuracy and flexibility.
By building these models, you can provide valuable forecasts that help organizations plan for the future.
Creating charts, graphs, and dashboards to present findings.
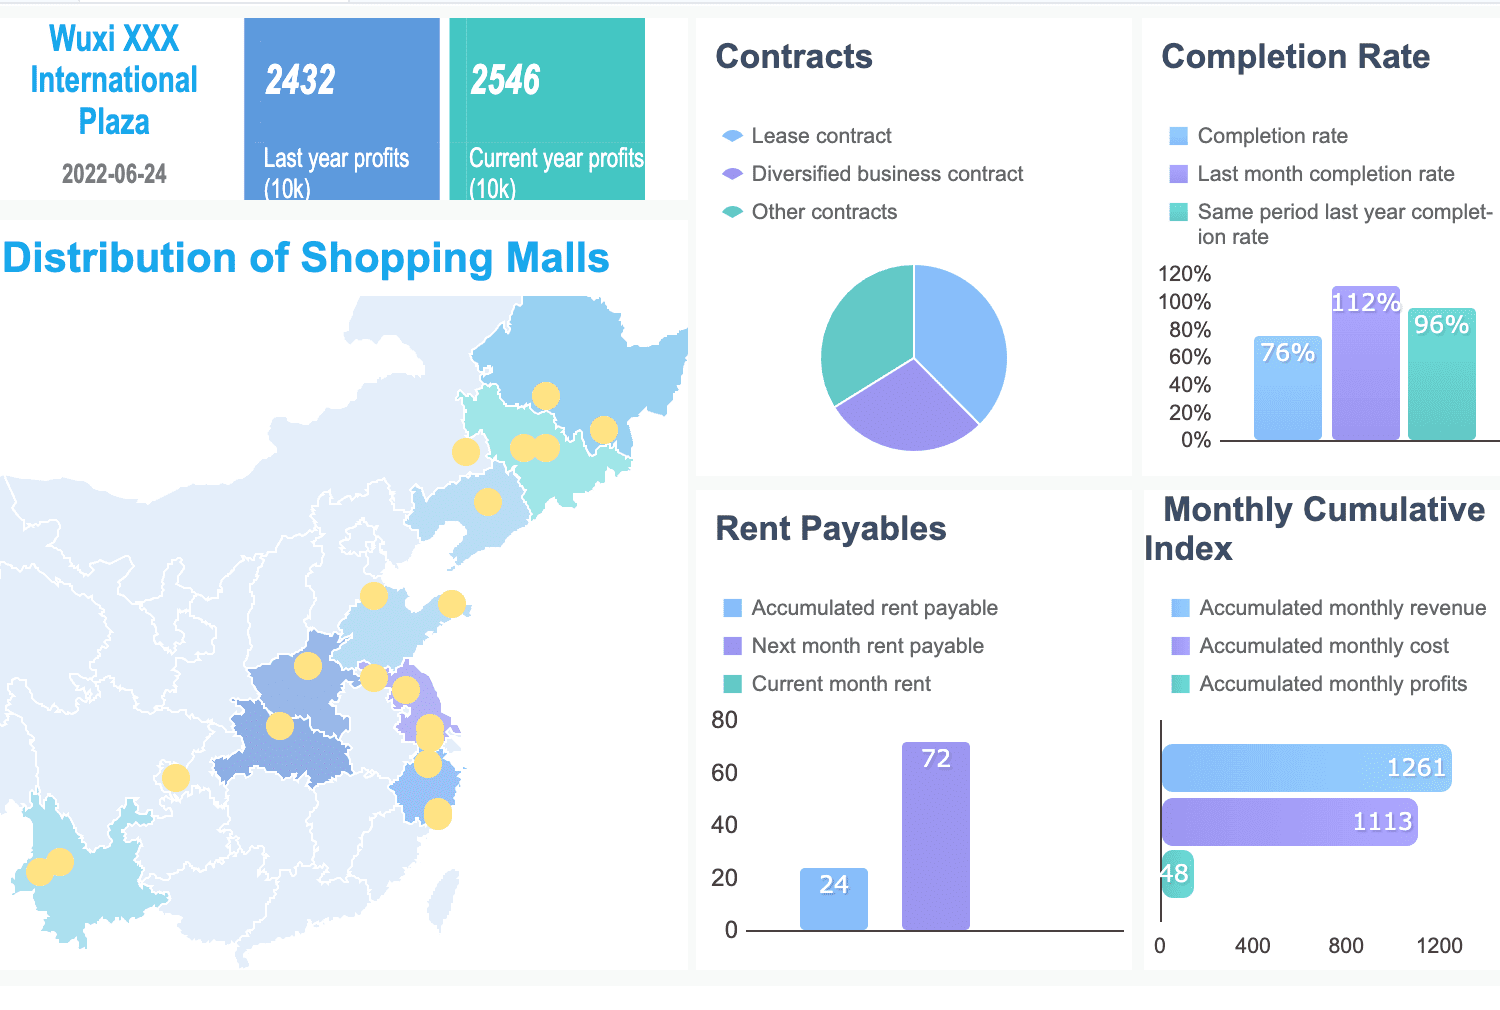
Data visualization transforms raw data into visual formats like charts, graphs, and dashboards, making complex information easier to understand. As a data analyst, you use these tools to highlight key insights and communicate findings effectively. For instance, a line chart can reveal sales trends over time, while a heat map can show regional variations in customer behavior. These visualizations not only simplify data interpretation but also help stakeholders grasp patterns and trends at a glance.
Effective data visualization focuses on clarity and relevance. Concentrating on key areas ensures that insights remain actionable. For example, a real-time dashboard can detect sudden drops in key metrics, enabling quicker responses to business problems. By presenting data visually, you enhance understanding, facilitate storytelling, and support data-driven decisions.
Leveraging tools like FineBI for self-service analytics and visualization.
FineBI empowers you to create impactful visualizations without requiring advanced technical skills. Its drag-and-drop interface simplifies the process, allowing you to connect to various data sources and design interactive dashboards effortlessly. With over 60 chart types and 70 styles, FineBI enables you to tailor visualizations to your audience's needs. Features like OLAP analysis let you drill down into data, uncover hidden patterns, and identify trends clearly.
Collaboration becomes seamless with FineBI. Teams can share dashboards and work together, ensuring everyone stays aligned. Additionally, FineBI’s real-time analysis capabilities allow you to update visualizations instantly as new data becomes available. This ensures that your visualizations remain relevant and actionable, driving data-driven decision-making across your organization.
Tip: Use FineBI’s data interpretation feature to click on anomalies within visualizations and uncover primary factors. This enhances your ability to provide deeper insights.
Generating Insights and Reporting
Translating data findings into actionable business recommendations.
Your role as a data analyst involves more than just analyzing data; you must also translate findings into actionable recommendations. By identifying trends and patterns, you can address business problems and guide strategic decisions. For example, analyzing customer feedback might reveal dissatisfaction with delivery times. You could recommend optimizing logistics to improve customer satisfaction.
Using descriptive and inferential statistics strengthens your recommendations. Descriptive statistics provide a snapshot of current performance, helping you identify immediate areas for improvement. Inferential statistics enable you to predict future trends, supporting long-term planning. Together, these methods enhance your ability to deliver insights that drive measurable business outcomes.
Type of Statistics
Impact on Business Outcomes
Descriptive Statistics
Provides a clear snapshot of current performance, aiding in immediate decision-making.
Inferential Statistics
Enables businesses to make predictions and informed decisions based on data analysis.
Communicating results to stakeholders through reports and presentations.
Clear communication is essential for ensuring that your insights lead to action. You achieve this by presenting findings through well-structured reports and engaging presentations. Visual elements like charts and graphs make complex data more accessible, while concise summaries highlight key insights. For example, a presentation on sales performance might include a bar chart comparing monthly revenues and a heat map showing regional sales variations.
Tailoring your communication to your audience is crucial. Executives may prefer high-level summaries, while department managers might need detailed analyses. Tools like FineBI simplify this process by enabling you to create customized dashboards and reports. These tools ensure that stakeholders receive the information they need to make informed decisions.
Note: Use storytelling techniques to make your presentations more compelling. Narratives that connect data insights to real-world outcomes resonate more with stakeholders.
What Does Data Analyst Do: Essential Skills
Technical Skills
Proficiency in programming languages like Python, R, or SQL.
As a data analyst, programming languages like Python, R, and SQL are your essential tools. Python and R allow you to perform data cleaning, statistical analysis, and machine learning. SQL helps you extract and manipulate data from databases efficiently. For example, you might use SQL to query a database for customer purchase histories or Python to analyze trends in sales data. Mastering these languages ensures you can handle diverse datasets and perform complex analyses with ease.
Expertise in data visualization tools such as FineBI and Tableau.
Data visualization tools are vital for transforming raw data into clear, actionable insights. Tools like FineBI and Tableau enable you to create interactive dashboards, charts, and graphs. These visualizations help stakeholders understand complex data quickly. For instance, FineBI’s drag-and-drop interface simplifies the creation of dashboards, while Tableau’s advanced features allow for detailed customization. Using these tools effectively enhances your ability to communicate findings and drive strategic decisions.
Data visualization is critical for telling compelling stories with data.
Exploratory Data Analysis (EDA) uncovers hidden patterns in datasets.
Advanced statistical analysis supports predictions and hypothesis testing.
Understanding of statistics and data modeling techniques.
A strong grasp of statistics and data modeling is essential for uncovering trends and making predictions. Techniques like regression analysis, clustering, and hypothesis testing allow you to analyze data rigorously. For example, regression analysis helps you understand relationships between variables, while clustering groups similar data points for targeted insights. These analytical skills enable you to provide accurate and actionable recommendations.
Soft Skills
Strong problem-solving and critical thinking abilities.
Problem-solving and critical thinking are at the heart of your role. You need to approach challenges methodically, identify root causes, and develop data-driven solutions. Reflecting on biases and forming objective judgments improves the quality of your analysis. For instance, when sales drop unexpectedly, your analytical thinking helps pinpoint the issue, whether it’s a pricing problem or a shift in customer preferences.
Effective communication skills for presenting data insights.
Your ability to communicate insights clearly determines how well stakeholders act on your findings. Data storytelling makes complex information understandable and actionable. For example, presenting a sales trend analysis with a compelling narrative helps executives make informed decisions. Collaboration with teams also benefits from strong communication, as it ensures everyone aligns on goals and strategies.
Communication bridges the gap between data and decision-making.
Teamwork enhances problem-solving through diverse perspectives.
Adaptability keeps you ahead in the rapidly evolving field of analytics.
Attention to detail and a methodical approach to work.
Attention to detail ensures the accuracy of your analysis. A methodical approach helps you structure your work efficiently, from data collection to reporting. For example, double-checking datasets for errors prevents flawed conclusions. This precision builds trust in your insights and supports better decision-making across the organization.
Tip: Cultivate a habit of reviewing your work thoroughly. Small errors in data can lead to significant misinterpretations.
What Does Data Analyst Do: Industries and Tools
What Does Data Analyst Do: Industries That Hire Data Analysts
Technology and software development
The technology sector heavily relies on data analysts to optimize software development, improve user experiences, and drive innovation. As a data analyst, you might analyze user behavior to enhance app functionality or evaluate system performance to identify bottlenecks. Companies like Google and Microsoft often seek professionals for these roles, reflecting the industry's growing demand.
Finance and banking
In finance, data analysts play critical roles in fraud detection, risk assessment, and investment strategy development. For example, you might analyze transaction patterns to identify fraudulent activities or use predictive models to forecast market trends. The financial sector values data-driven insights to ensure security and profitability.
Healthcare organizations use data analysts to improve patient care and streamline operations. You might analyze patient records to identify treatment trends or evaluate clinical trial data for new drug development. This industry also leverages analytics for resource allocation and disease outbreak predictions, making your role essential. Here is an interactive demo created by FineBI, click to experience ir.
Retail and e-commerce
Retailers and e-commerce platforms depend on data analysts to understand customer preferences and optimize inventory. You might analyze sales data to predict demand or evaluate marketing campaigns to measure their effectiveness. Companies like Amazon and Walmart use analytics to enhance customer satisfaction and boost revenue.
In marketing, data analysts help businesses target the right audience and measure campaign success. You might analyze social media metrics to identify trends or evaluate customer feedback to refine strategies. This role ensures that marketing efforts are both effective and data-driven.
Did you know? Industries like education, manufacturing, and government also hire data analysts. For example, education uses analytics for personalized learning, while manufacturing employs AI-driven efficiency models.
What Does Data Analyst Do: Tools Used by Data Analysts
Data integration platforms like FineDataLink for seamless data management
FineDataLink simplifies data integration by connecting multiple sources into a unified system. As a data analyst, you can use its real-time synchronization and ETL capabilities to ensure data accuracy and accessibility. This tool reduces manual effort, allowing you to focus on analysis rather than data preparation.
Visualization tools such as FineBI and Power BI
Visualization tools transform raw data into actionable insights. FineBI offers a user-friendly interface with over 60 chart types, enabling you to create interactive dashboards effortlessly. Power BI provides advanced customization options for detailed visualizations. Both tools help you communicate findings effectively to stakeholders.
Database management systems like SQL and NoSQL
SQL and NoSQL databases are essential for storing and querying data. SQL is ideal for structured data, while NoSQL handles unstructured formats like JSON. As a data analyst, proficiency in these systems allows you to extract and manipulate data efficiently, ensuring accurate analysis.
Tip: About 73% of businesses now use self-service authoring tools, highlighting the importance of mastering platforms like FineBI.
How to Become a Data Analyst
Educational Pathways
Earning a degree in fields like data science, statistics, or computer science.
Pursuing a degree in data science, statistics, or computer science provides a strong foundation for a career in data analysis. These programs teach essential skills like statistical modeling, programming, and data visualization. For example, a computer science degree often includes courses on algorithms and database management, which are critical for handling large datasets. A degree also signals to employers that you have the technical knowledge required for data analyst roles.
Completing online courses or certifications in data analytics.
If earning a degree isn’t feasible, online courses and certifications offer a flexible alternative. Platforms like Coursera, edX, and Udemy provide specialized training in tools like Python, SQL, and Tableau. Certifications such as Google Data Analytics or Microsoft Certified: Data Analyst Associate validate your expertise and enhance your resume. These programs allow you to learn at your own pace while gaining practical skills that align with industry demands.
Tip: Combine formal education with certifications to stand out in a competitive job market.
Gaining Practical Experience
Working on real-world projects or internships.
Practical experience is invaluable for developing your skills as a data analyst. Internships expose you to tools and software not typically covered in academic settings. They also allow you to apply classroom knowledge to real-world scenarios, boosting your technical proficiency. For instance, working on an internship project might involve using SQL to clean data or Python to create visualizations. These experiences refine your abilities in data cleaning, statistical analysis, and machine learning.
Internships enhance your resume by showcasing proficiency in industry-standard tools.
Real-world projects improve problem-solving and critical thinking skills.
Hands-on experience demonstrates your readiness to tackle complex challenges.
Building a portfolio showcasing data analysis skills.
A well-crafted portfolio highlights your expertise and sets you apart from other candidates. Include projects that demonstrate your ability to analyze data, create visualizations, and generate actionable insights. For example, you could showcase a project where you used clustering techniques to segment customers or built a dashboard to track sales trends. A portfolio not only proves your technical skills but also shows your ability to communicate findings effectively.
Note: Use platforms like GitHub or Tableau Public to share your portfolio with potential employers.
Networking and Career Development
Joining professional organizations or attending industry events.
Networking plays a crucial role in advancing your career. Joining organizations like the Data Science Society or attending events such as data analytics conferences connects you with industry professionals. These interactions provide mentorship opportunities and insights into the latest trends. Networking also strengthens your personal brand, ensuring you remain visible and relevant in the field.
Staying updated on the latest trends and tools in data analytics.
The field of data analytics evolves rapidly, making it essential to stay informed. Follow industry blogs, participate in webinars, and explore new tools like FineBI or FineDataLink. Staying updated not only enhances your skills but also demonstrates your commitment to growth. This proactive approach ensures you remain competitive and prepared for emerging challenges in data analysis.
Did you know? Networking accounts for 85% of job placements, highlighting its importance in career development.
What Does Data Analyst Do: Challenges and Benefits
Common Challenges
Dealing with incomplete or messy data.
As a data analyst, you often face the challenge of working with messy or incomplete datasets. Real-world data rarely comes in a clean, ready-to-use format. It may include missing values, duplicate entries, or inconsistencies in formatting. For example, customer names might appear in different formats, or some records may lack critical information like email addresses. Addressing these issues requires time and effort, but it is essential for ensuring accurate analysis.
To tackle these challenges, you can implement strategies such as:
Standardizing data formats to maintain consistency.
Deduplicating repeated records to avoid skewed results.
Using statistical methods like interpolation or multiple imputation to estimate missing values.
Data cleaning is a critical step in your workflow. While it can be time-consuming, it lays the foundation for meaningful insights and reliable decision-making.
Communicating complex findings to non-technical stakeholders.
Another challenge you may encounter is translating complex data insights into actionable recommendations for non-technical stakeholders. Business leaders and team members often lack the technical expertise to interpret raw data or statistical models. Your role involves bridging this gap by presenting findings in a clear and engaging way.
To communicate effectively:
Use visualizations like charts and dashboards to simplify complex information.
Focus on the "why" behind the data, connecting insights to business goals.
Avoid jargon and explain technical terms in plain language.
For example, instead of saying, "The regression model shows a significant negative correlation," you could say, "Our analysis indicates that as prices increase, customer purchases tend to decrease." This approach ensures your audience understands the insights and can act on them confidently.
Benefits of the Role
High demand and job security in various industries.
The demand for data analysts continues to grow across industries. Organizations increasingly rely on data-driven decision-making, creating a strong need for professionals in this field. According to the U.S. Bureau of Labor Statistics, data-related roles like data scientists and statisticians are projected to grow by over 30% from 2021 to 2031, far outpacing the average growth rate for all occupations.
Role
Projected Growth (2021-2031)
Median Salary
Data Scientists
36%
N/A
Statisticians
31%
N/A
Market Research Analysts
19%
N/A
All Occupations Average
5%
N/A
This high demand translates into job security. Data-related roles accounted for only 3% of layoffs in 2023, compared to 22% for software engineering roles. With a median salary of $82,000 and opportunities in industries like finance, healthcare, and IT, you can enjoy a stable and rewarding career.
Opportunities for continuous learning and growth.
As a data analyst, you have endless opportunities to learn and grow. The field evolves rapidly, with new tools, techniques, and technologies emerging regularly. Staying updated on these advancements allows you to enhance your skills and remain competitive. For instance, mastering tools like FineBI or FineDataLink can boost your efficiency and expand your capabilities.
You also gain exposure to diverse industries and business challenges. Each project offers a chance to deepen your expertise and broaden your perspective. Whether you’re analyzing customer behavior in retail or optimizing operations in healthcare, your work contributes to meaningful outcomes. This variety keeps the role dynamic and intellectually stimulating.
Tip: Embrace a mindset of lifelong learning. Explore certifications, attend workshops, and stay curious about emerging trends in data analytics.
Data analysts play vital roles in shaping business success. By mastering essential skills and using tools like FineBI and FineDataLink, you can transform raw data into actionable insights. Businesses that embrace data-driven strategies see significant benefits. For example, data-driven marketing achieves five times higher ROI compared to traditional methods. Firms also reduce customer acquisition costs by 47% and increase revenue by 8%. These outcomes highlight the value of your work in enhancing operational performance and driving growth. Pursuing this career offers exciting opportunities to make a meaningful impact.
Click the banner below to try FineBI and FineDataLink for free and empower your enterprise to transform data into productivity!
1. What is the difference between a data analyst and a data scientist?
A data analyst focuses on interpreting existing data to uncover trends and insights. A data scientist goes further by building predictive models and algorithms. Analysts answer "what happened," while scientists explore "why it happened" and "what will happen next."
2. Do you need coding skills to become a data analyst?
Yes, coding skills are essential. You often use languages like Python, R, or SQL to clean, analyze, and visualize data. These tools help you automate tasks and handle large datasets efficiently.
3. What industries hire the most data analysts?
Industries like technology, finance, healthcare, retail, and marketing hire the most data analysts. These sectors rely on data-driven strategies to improve operations, enhance customer experiences, and gain competitive advantages.
4. How does FineBI simplify data analysis?
FineBI offers a drag-and-drop interface for creating dashboards and visualizations. It connects to multiple data sources and supports real-time analysis. Its user-friendly design makes it accessible even if you lack advanced technical skills.
5. What is the role of FineDataLink in data integration?
FineDataLink integrates data from various sources into a unified system. It ensures accuracy through real-time synchronization and simplifies ETL processes. This tool helps you focus on analysis instead of spending time on data preparation.
6. How can you improve your data visualization skills?
Practice using tools like FineBI or Tableau. Experiment with different chart types and layouts. Focus on clarity and relevance. Always tailor your visualizations to your audience’s needs for better communication.
7. What certifications are valuable for data analysts?
Certifications like Google Data Analytics, Microsoft Certified: Data Analyst Associate, and Tableau Desktop Specialist are highly regarded. They validate your skills and make you stand out to employers.
8. How do you handle messy or incomplete data?
You clean messy data by removing duplicates, standardizing formats, and filling missing values. Tools like Python or Excel help automate these tasks. Cleaning ensures your analysis is accurate and reliable.
Tip: Always verify your cleaned data before starting analysis to avoid errors.
Product Trial
FineReport
Pixel-perfect reports · Interactive dashboards · Easy data entry · Digital twins