Graphs play a vital role in mathematics, helping you visualize numerical relationships and patterns. They transform numbers into visual stories, making data easier to interpret. For instance, statistical graphs effectively represent discrete data like counts and continuous data such as measurements. This ability to showcase data visually enhances your understanding and simplifies complex concepts in Malaysia.
Using graphs also improves decision-making in Malaysia. They reveal patterns and anomalies in datasets, enabling you to identify trends quickly. Businesses often rely on graph-based analytics to detect hidden insights and build predictive models, leading to smarter decisions in Malaysia.
Tools likeFineBI make graph creation effortless. With its user-friendly interface and advanced features, it empowers you to explore any type of graph while streamlining your data visualization and analysis process in Malaysia.
What is a Graph in Mathematics?
Definition and Purpose of Graphs
A graph in mathematics is a visual representation of relationships between data points. It helps you understand how variables interact and change. Graphs can take many forms, such as line graphs, bar graphs, and scatter plots, each serving a unique purpose. For example, a line graph connects data points to show trends over time, while a bar graph compares discrete categories.
In graph theory, graphs are structures made up of vertices (points) and edges (lines connecting the points). These structures model relationships between objects, making them essential in discrete mathematics. Whether you're analyzing a function or mapping connections, graphs simplify complex relationships into understandable visuals.
Type of Graph
Definition
Important Features
Line Graph
A graph that connects data points with a line to show trends over time.
- Time or independent variable on x-axis. - Dependent variable on y-axis. - Straight lines connect points.
Bar Graph
A graph that uses bars to compare discrete categories.
- Horizontal or vertical bars. - Height/length corresponds to value. - Compares amounts among groups.
Pie Chart
A circular graph divided into slices representing percentages of a whole.
- Size of each slice corresponds to percentage. - Ideal for comparing parts of a whole.
Importance of Graphs in Data Representation
Graphs transform abstract numbers into clear visuals, making data easier to interpret. They allow you to identify patterns, trends, and anomalies at a glance. For instance, a scatter plot can reveal correlations between two variables, helping you understand their relationship. This ability to visualize data enhances problem-solving and decision-making.
Studies show that graphs improve comprehension and retention. Students in Malaysia remember 65% of visual information compared to only 10-20% of written or spoken data. Graphs also make complex information accessible, enabling you to spot trends quickly and communicate ideas effectively. Whether you're a student or a professional in Malaysia, graphs are indispensable tools for understanding and presenting data.
Applications of Graphs in Real-World Scenarios
Graphs have countless applications across various fields in Malaysia. In healthcare, they integrate medical data to monitor patient information and aid in drug discovery. In finance, they help detect financial crimes and analyze transactions. Search engines use graphs to enhance search results and support voice queries. Even in e-commerce, graphs analyze customer behavior to recommend products.
These examples highlight how graphs simplify decision-making and improve efficiency in Malaysia. By using graphs, you can uncover insights that might otherwise remain hidden in raw data. Whether you're solving a math problem or optimizing a business process, graphs empower you to make informed decisions in Malaysia.
Exploring Different Type of Graph in FineBI
Line Graphs: Trends and Continuous Data
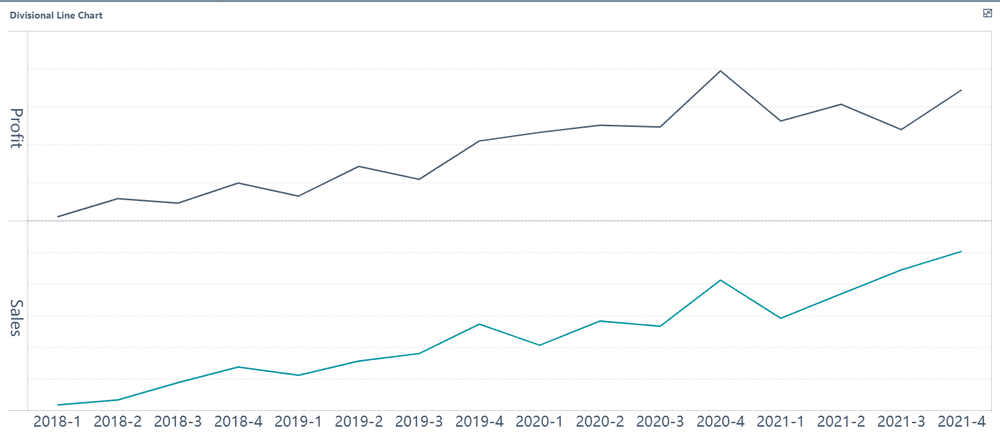
Line graphs are one of the most versatile tools for visualizing trends and continuous data. They connect individual data points with straight lines, creating a clear picture of how values change over time. For example, you can use a line graph to track monthly sales, temperature fluctuations, or stock prices in Malaysia.
FineBI makes working with line graphs simple and intuitive. Its drag-and-drop functionality allows you to plot data effortlessly in Malaysia. You can adjust axes, add labels, and customize colors to make your graph more informative. The software also supports real-time data updates, ensuring your line graph reflects the latest trends in Malaysia.
The uses of line graphs extend beyond business applications. In maths, they help you understand functions and equations visually. By observing the slope and curvature of a line graph, you can identify relationships between variables and predict future outcomes. Whether you're analyzing data for a project or solving mathematical problems, line graphs provide valuable insights.
Column Graphs
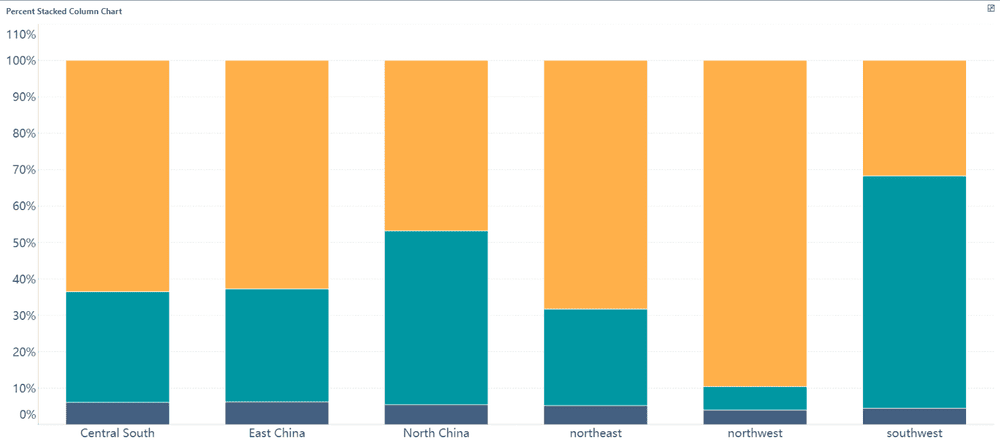
Column graphs are ideal for comparing data across categories. They use vertical bars to represent values, making it easy to see differences at a glance. For instance, you can use a column graph to compare the performance of different products, departments, or regions in Malaysia.
FineBI enhances the functionality of column graphs by offering customization options. You can group data, stack columns, or highlight specific bars to emphasize key points. The software also supports interactive features, allowing you to drill down into details by clicking on individual columns.
Column graphs are particularly useful when you need to present data in a structured and organized manner. They work well for both small datasets and large-scale comparisons. With FineBI, you can create column graphs that are not only visually appealing but also packed with actionable insights.
Bar Graphs: Comparing Categories
Bar graphs are among the most effective tools for comparing different categories. They use horizontal or vertical bars to represent values, with the length of each bar indicating its magnitude. This straightforward design makes bar graphs easy to interpret, even for complex datasets.
You can use bar graphs to compare discrete data categories, such as sales figures for different products or survey responses across age groups in Malaysia. FineBI simplifies the creation of bar graphs by providing pre-designed templates and customization options. You can adjust the spacing between bars, add annotations, and even combine multiple datasets into a single graph.
Bar graphs excel at highlighting differences between categories. Their visual clarity allows you to spot trends and relationships quickly. For example:
Bar graphs clearly show differences between categories.
They are ideal for comparing discrete data categories.
The varying lengths of bars make it easy to visualize and interpret data.
FineBI’s advanced features take bar graphs to the next level. You can integrate real-time data, apply filters, and share your graphs with team members in Malaysia for collaborative analysis. Whether you're exploring market trends or analyzing survey results, bar graphs help you make informed decisions.
Pie Charts: Visualizing Proportions
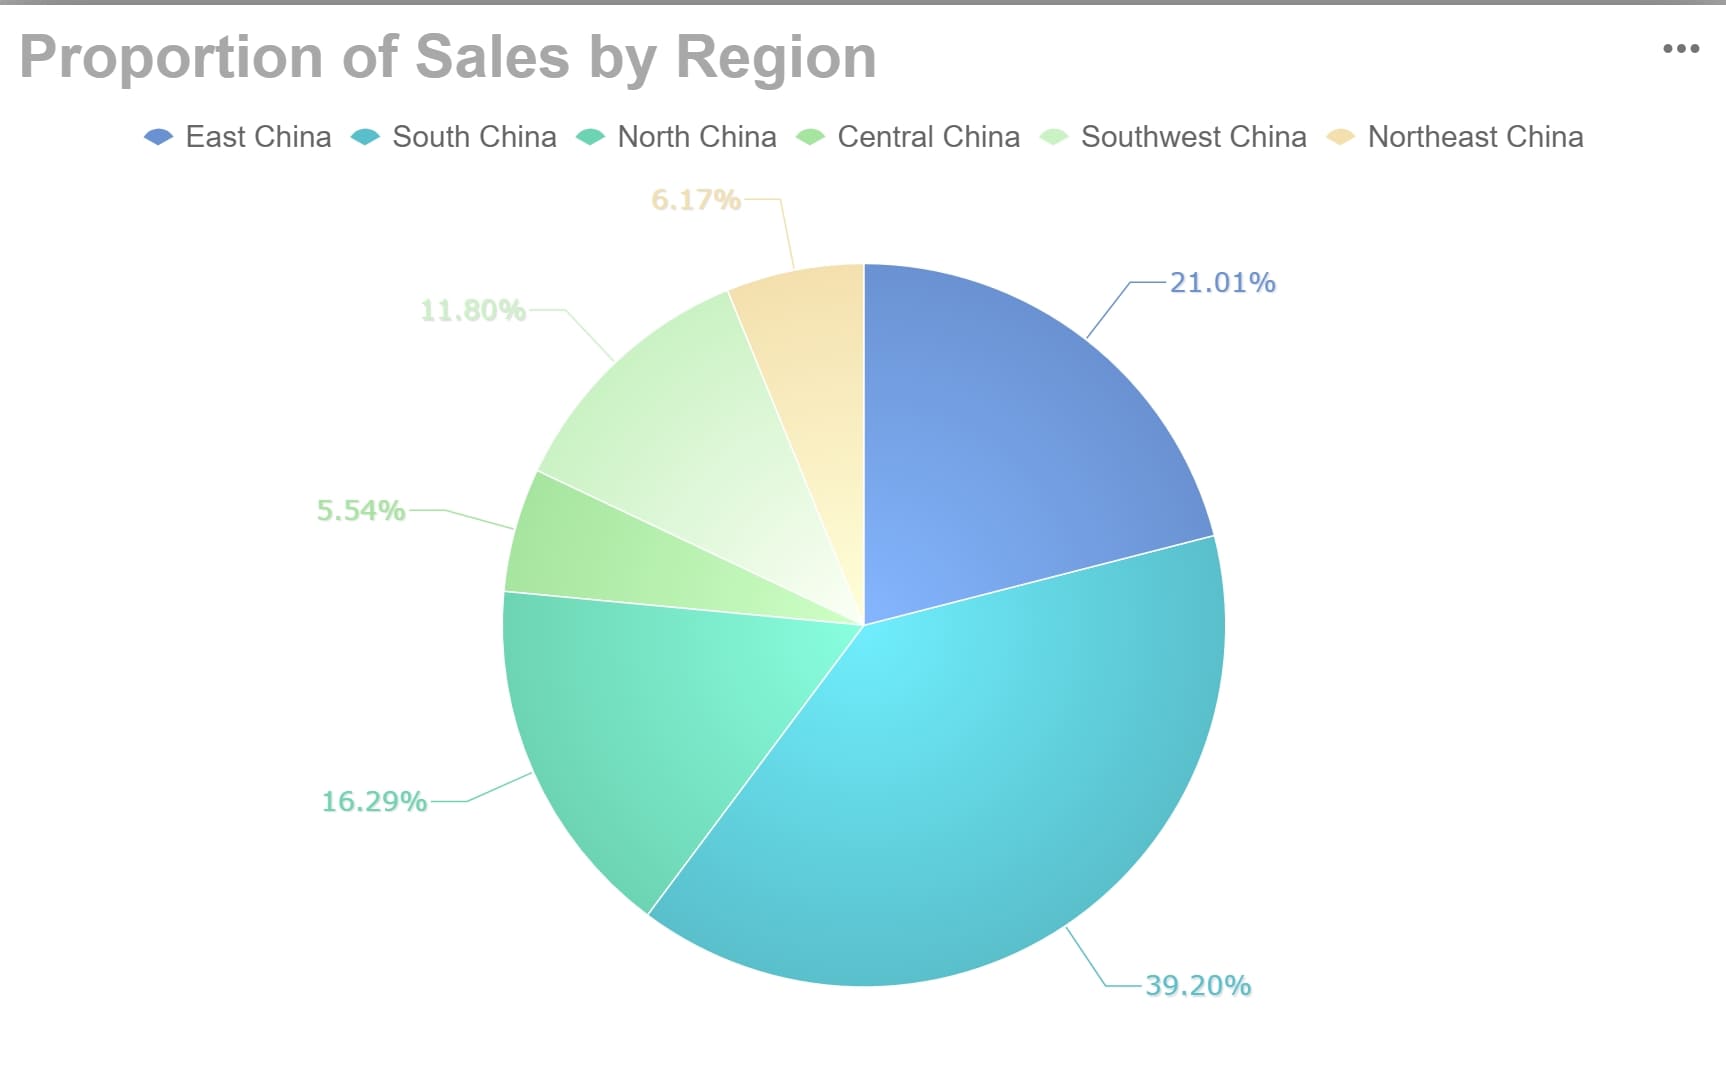
Pie charts are a powerful tool for visualizing proportions. They represent data as slices of a circle, with each slice corresponding to a percentage of the whole. This design makes it easy for you to compare parts of a dataset and understand their relative sizes. For example, you can use a pie chart to display the distribution of expenses in a monthly budget or the market share of different companies in an industry in Malaysia.
Studies have shown that pie charts excel at communicating part-to-whole relationships. When datasets contain fewer categories, pie charts allow faster and more accurate data estimation. Researchers Eells (1926) found that pie charts outperform bar charts in facilitating proportional judgments in certain cases. Additionally, Croxton and Stryker (1927) demonstrated that pie charts perform best when visualizing categorical data with up to five categories.
Evidence Description
Source
Pie charts are effective for communicating part-to-whole relationships.
Eells, 1926
Faster and more accurate data estimation with pie charts when data points are few.
Eells, 1926
Higher performance in visualizing categorical data (up to five categories).
Croxton and Stryker, 1927
FineBI enhances the usability of pie charts by offering customization options. You can adjust the size of slices, add labels, and apply color schemes to make your chart visually appealing. The software also supports interactive features, allowing you to hover over slices for detailed information. These features make pie charts not only informative but also engaging for presentations and reports.
When working with pie charts, remember their limitations. They work best for datasets with fewer categories. If you have too many slices, the chart may become cluttered and difficult to interpret. By using pie charts effectively, you can simplify complex data and communicate insights clearly.
Scatter Plots: Relationships Between Variables
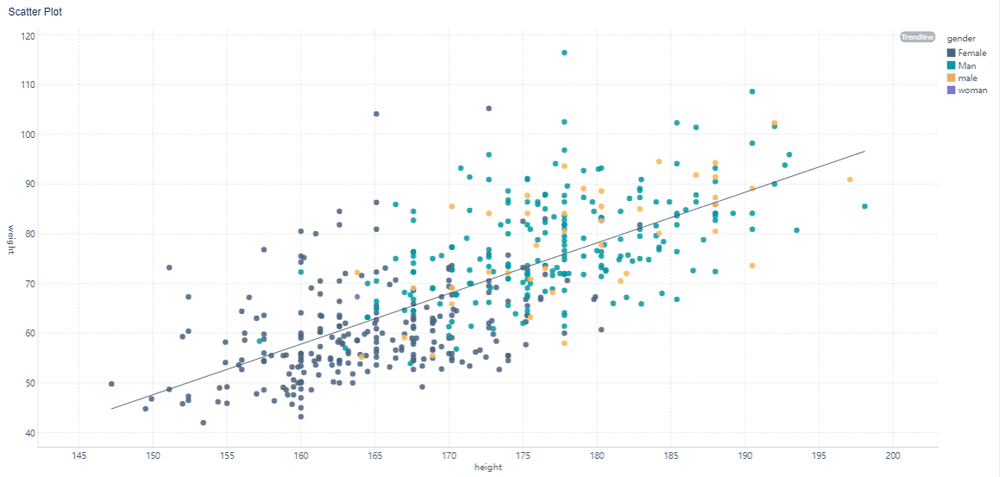
Scatter plots are essential for analyzing relationships between two variables. They display data points on a Cartesian plane, with each point representing a pair of values. This layout helps you identify patterns, trends, and correlations in your data. For instance, scatter plots can reveal how temperature affects ice cream sales or how study hours impact test scores.
FineBI takes scatter plots to the next level by integrating advanced analysis methods. Cross-analysis organizes values into a cross-table, making it easier to examine correlations. Matrix correlation categorizes items based on two attributes, uncovering associations that scatter plots can visualize effectively.
Analysis Method
Description
Cross-analysis
Organizes values in a cross-table to examine correlations.
Matrix correlation
Categorizes items based on two attributes, uncovering relationships visualized using scatter plots.
Scatter plots are particularly useful for identifying outliers and clusters. Outliers are data points that deviate significantly from the trend, while clusters group points with similar characteristics. These insights help you understand the dynamics between variables and make predictions in Malaysia.
FineBI’s scatter plot features include real-time data updates and interactive tools. You can zoom in on specific areas, filter data points, and customize axes to focus on key details. These capabilities make scatter plots a versatile type of graph for exploring relationships in diverse datasets in Malaysia.
When using scatter plots, ensure your data is well-organized and labeled. Clear axis titles and consistent scaling improve readability. By leveraging scatter plots effectively, you can uncover hidden patterns and gain deeper insights into your data.
Advanced Type of Graph in Mathematics
Trigonometric Graphs: Modeling Periodic Phenomena
Trigonometric graphs represent periodic functions like sine, cosine, and tangent. These graphs are essential for modeling phenomena that repeat over time, such as sound waves, tides, and seasonal changes. For example, the sine wave graph illustrates oscillations, making it useful in physics and engineering.
In maths, trigonometric graphs help you understand the behavior of periodic functions. They show key properties like amplitude, frequency, and phase shift. By analyzing these graphs, you can predict future patterns and solve real-world problems in Malaysia. FineBI enhances this process by allowing you to overlay multiple trigonometric functions for comparison. This feature is particularly useful in fields like signal processing and acoustics.
Logarithmic graphs are powerful tools for visualizing exponential trends. They transform exponential relationships into linear ones, making it easier to analyze data. For instance, Moore’s Law, which predicts the doubling of transistor density every 18-24 months, is best visualized using a logarithmic scale.
These graphs are also valuable in fields like environmental science and cryptocurrency. Radiocarbon dating uses logarithmic decay to determine the age of artifacts, while Bitcoin price movements are better understood on a logarithmic scale. The table below highlights some key applications:
Field
Example of Exponential Trend
Description
Technology
Moore’s Law
Transistor density doubles every 18-24 months, influencing advancements in computing and AI.
Data Analysis
Logarithmic transformations
Essential for handling skewed distributions and converting exponential relationships into linear ones.
Cryptocurrency
Bitcoin price movements
Dramatic price changes are better visualized on logarithmic scales, revealing consistent growth.
Environmental Science
Radiocarbon dating and logarithmic scales (Richter scale, pH scale)
Exponential decay processes and logarithmic measures allow precise age determination and concise expression of values.
FineBI simplifies the creation of logarithmic graphs, enabling you to explore exponential relationships with ease in Malaysia.
Weighted Graphs: Network Analysis
Weighted graphs are crucial for analyzing networks where relationships have varying strengths. Each edge in a weighted graph carries a numerical value, representing factors like distance, cost, or importance. These graphs are widely used in transportation, social networks, and molecular biology in Malaysia.
For example, in network analysis, weighted graphs improve precision, accuracy, and recall. The chart below demonstrates the impact of weighted graphs on datasets like Actor and Cornell:
FineBI supports weighted graph analysis by integrating real-time data and offering interactive visualization tools. These features help you uncover hidden patterns and optimize decision-making in complex networks.
Quadratic Graphs: Polynomial Functions
Quadratic graphs represent polynomial functions of degree two. These graphs take the shape of a parabola, which can open upward or downward depending on the sign of the leading coefficient. You encounter quadratic graphs in various mathematical and real-world scenarios, such as projectile motion, optimization problems, and economics.
Key Features of Quadratic Graphs
Quadratic graphs have distinct characteristics that make them easy to identify:
Vertex: The highest or lowest point of the parabola, depending on its orientation.
Axis of Symmetry: A vertical line that divides the graph into two symmetrical halves.
Roots: Points where the graph intersects the x-axis, representing solutions to the quadratic equation.
Direction: The parabola opens upward if the leading coefficient is positive and downward if it is negative.
Feature
Description
Vertex
The turning point of the parabola.
Axis of Symmetry
A line that splits the graph into two equal parts.
Roots
The x-values where the graph crosses the x-axis.
Direction
Determined by the sign of the leading coefficient.
Applications of Quadratic Graphs
Quadratic graphs help you solve problems involving maximum or minimum values. For example:
Physics: Analyze projectile motion to determine the highest point or range.
Economics: Model profit functions to find optimal pricing strategies.
Engineering: Design structures with parabolic shapes for strength and stability.
How FineBI Enhances Quadratic Graph Analysis
FineBI simplifies quadratic graph creation and analysis. Its drag-and-drop interface lets you plot data points effortlessly. You can customize axes, add labels, and overlay multiple graphs for comparison. FineBI also supports real-time data updates, ensuring your graphs reflect the latest trends.
Tip: Use FineBI’s interactive features to zoom in on specific areas of the graph and analyze key details.
Quadratic graphs provide valuable insights into mathematical relationships and real-world phenomena. By leveraging tools like FineBI, you can explore these graphs with greater precision and efficiency in Malaysia.
Comparative Analysis of Type of Graph
Key Features and Differences
Graphs serve as powerful tools for visualizing relationships and presenting data effectively. Each type of graph has unique features that make it suitable for specific purposes. Understanding these differences helps you choose the right graph for your data.
Type of Graph
Key Features
Use Cases
Line Graphs
Show trends over time or continuous data.
Ideal for tracking trends in data over a period.
Bar Graphs
Compare data across categories.
Useful for comparing different groups or categories.
Pie Charts
Represent proportions within a whole.
Effective for showing percentage breakdowns of a dataset.
Scatter Plots
Display relationships or correlations between variables.
Helpful for identifying correlations in data sets.
Histograms
Visualize data distribution and frequency.
Commonly used to show frequency distributions of numerical data.
Contour Plots
Analyze three variables in a two-dimensional format using shading or color.
Used in meteorology to illustrate variables like ocean salinity at different depths.
Heat Maps
Chart varying temperatures at different geographical points.
Effective for visualizing temperature variations or web traffic data.
3D Graphs
Display multi-dimensional data sets across three axes.
Useful for complex data visualizations, such as wind fields in meteorology.
Scatter-Line Combo
Combine line graphs with scatter plots to illustrate relationships.
Effective for comparing daily temperatures with historical averages.
A study comparing type of graph highlights the importance of analyzing their structures and distance measures. This approach helps you evaluate performance metrics and understand topological features in both random and real-world networks in Malaysia. By adopting a multi-scale analysis, you can better assess the effectiveness of different type of graph.
Choosing the Right Type of Graph for Your Data
Selecting the most appropriate type of graph depends on your data and the message you want to convey. To make an informed choice, consider the following performance indicators:
Prioritize key indicators to avoid overwhelming your audience with unnecessary data.
Understand your audience's needs to tailor the type of graph accordingly.
Ensure clarity in reporting by focusing on a single message per graphic.
For example, if you aim to track trends over time, a line graph works best. If you need to compare categories, bar graphs provide clarity. Pie charts excel at showing proportions, while scatter plots are ideal for visualizing relationships between variables. The table below offers additional guidance:
Type of Graph
Accuracy Enhancement
Comparison with Textual Disclosure
Column Graph
High
Enhanced accuracy
Line Graph
Moderate
Enhanced accuracy
Textual Disclosure
Low
Baseline comparison
Table
Low
No significant difference
When choosing a graph, remember that simplicity often leads to better comprehension. Avoid cluttered visuals and focus on presenting data in a way that aligns with your objectives in Malaysia.
How FineBI Enhances Graph Analysis
FineBI revolutionizes graph analysis by offering advanced features that simplify data visualization. Its intuitive interface allows you to create graphs effortlessly, even without technical expertise. The platform supports over 60 chart types, enabling you to explore diverse ways of visualizing relationships in your data.
Performance Metric
Description
Real-Time Calculation & Analysis
Ensures decisions are based on the latest data, enhancing the timeliness of insights.
Advanced Data Visualization & Customization
Allows for the creation of tailored dashboards, improving the relevance of visual data.
Empowers users to create reports quickly without needing technical expertise, increasing accessibility.
FineBI also excels in tracking trends with real-time updates. For instance, you can monitor sales performance or website traffic as it happens. The drag-and-drop functionality simplifies the process of creating interactive dashboards, making it easier to analyze complex datasets. Additionally, FineBI’s customization options let you tailor graphs to highlight key insights, ensuring your visuals align with your goals in Malaysia.
By leveraging FineBI, you can enhance your graph analysis capabilities and make data-driven decisions with confidence in Malaysia.
Leveraging Type of Graph with FanRuan and FineBI
Role of FineBI in Data Visualization
FineBI plays a pivotal role in modern data visualization by simplifying the process of creating and analyzing graphs. Its intuitive interface allows you to explore various types of charts effortlessly. Whether you need a line graph to track trends or a pie chart to display proportions, FineBI provides the tools to visualize data effectively. The platform supports over 60 chart types, ensuring you can find the perfect graph for your data.
FineBI also enhances collaboration. Teams in Malaysia can work together on dashboards, sharing insights and improving decision-making. Its real-time data updates ensure your visualizations reflect the latest information. This feature is particularly useful for businesses in Malaysia that rely on up-to-date analytics to stay competitive.
Benefits of Using FineBI for Different Type of Graph
FineBI offers numerous benefits when working with different types of charts. Its drag-and-drop functionality makes it easy to create graphs without technical expertise. You can customize colors, labels, and axes to make your charts more informative and visually appealing. The platform also supports interactive features, allowing you to drill down into data for deeper insights.
For example, FineBI’s scatter plots help you analyze relationships between variables, while its bar graphs excel at comparing categories. The software’s ability to integrate real-time data ensures your charts remain relevant and actionable. Additionally, FineBI’s advanced customization options allow you to tailor graphs to your specific needs, making it a versatile tool for data visualization.
Real-World Applications of FineBI in Graph Analysis
FineBI has proven its effectiveness in real-world scenarios. For instance, Global Data Discoveries reported a 40% improvement in meeting efficiency after adopting FineBI’s real-time visual analytics. Similarly, Data Trends Weekly Survey experienced a 33% increase in team collaboration within three months of using the platform. Anita Desai, a business analyst, highlighted how FineBI 6.0 transformed reporting processes, enabling non-technical staff to interpret complex data with ease.
These examples demonstrate how FineBI empowers organizations to leverage different types of charts for better decision-making. By simplifying graph creation and analysis, FineBI helps you uncover insights, improve efficiency, and achieve your goals in Malaysia.
Understanding different type of graph empowers you to interpret data effectively and make informed decisions. Each type of graph serves a unique purpose, helping you uncover patterns, relationships, and trends in various scenarios in Malaysia.
Tools like FineBI simplify this process. Its intuitive interface and advanced features allow you to create and analyze graphs effortlessly.
Explore advanced type of graph to gain deeper insights into your data. By leveraging FineBI, you can transform complex datasets into actionable visualizations, enhancing your ability to solve problems and achieve your goals.
Click the banner below to try FineBI for free and empower your enterprise to transform data into productivity!
Smarter product, pricing, and inventory management across retail sectors.
FAQ
What are exponential graphs, and where can you use them?
Exponential graphs represent exponential relationships, where values grow or decay rapidly. You can use them in fields like finance to model compound interest, biology to study population growth, or physics to analyze radioactive decay.
How do logarithmic graphs differ from exponential graphs?
Logarithmic graphs transform exponential relationships into linear ones. While exponential graphs show rapid growth or decay, logarithmic graphs simplify this trend, making it easier to analyze data. They are often used in technology and environmental science.
Why are frequency distribution graphs important?
Frequency distribution graphs help you visualize how data is distributed across intervals. They are essential for identifying patterns, such as the most common or rare values in a dataset. These graphs are widely used in statistics and research.
Can logarithmic graphs help with skewed data?
Yes, logarithmic graphs are ideal for handling skewed data. They compress large values and expand smaller ones, making patterns more visible. This feature is especially useful in fields like cryptocurrency and environmental science.
How do you choose between exponential and logarithmic graphs?
Choose exponential graphs to show rapid changes over time. Use logarithmic graphs to simplify exponential trends for easier analysis. Your choice depends on the data and the insights you want to uncover.