A Business Intelligence (BI) Analyst uses data to help organizations make better decisions by analyzing trends, improving efficiency, and finding growth opportunities, tasks that involve gathering, cleaning, and visualizing data, creating reports, and presenting insights to leadership to drive strategy and performance. They bridge the gap between raw data and actionable business strategy, requiring skills in SQL, data modeling, and visualization tools to transform information into clear, impactful business intelligence.By leveraging advanced tools, you enable businesses to harness data and uncover actionable insights. Companies using exploratory data analysis see decision-making improvements by 30%, while those applying inferential statistics achieve up to 40% better forecasting accuracy.
Real-time analyticstransforms industries by minimizing delays and increasing agility. Retailers now use streaming data processing tools to adjust inventory dynamically, avoiding lost opportunities. Machine learning models predict consumer behavior, ensuring optimal stock levels and enhancing customer satisfaction. These advancements keep you ahead of competitors and aligned with ever-changing market needs.
Key Responsibilities of a Business Intelligence Analyst in 2026
Data Collection and Integration with Tools like FineDataLink
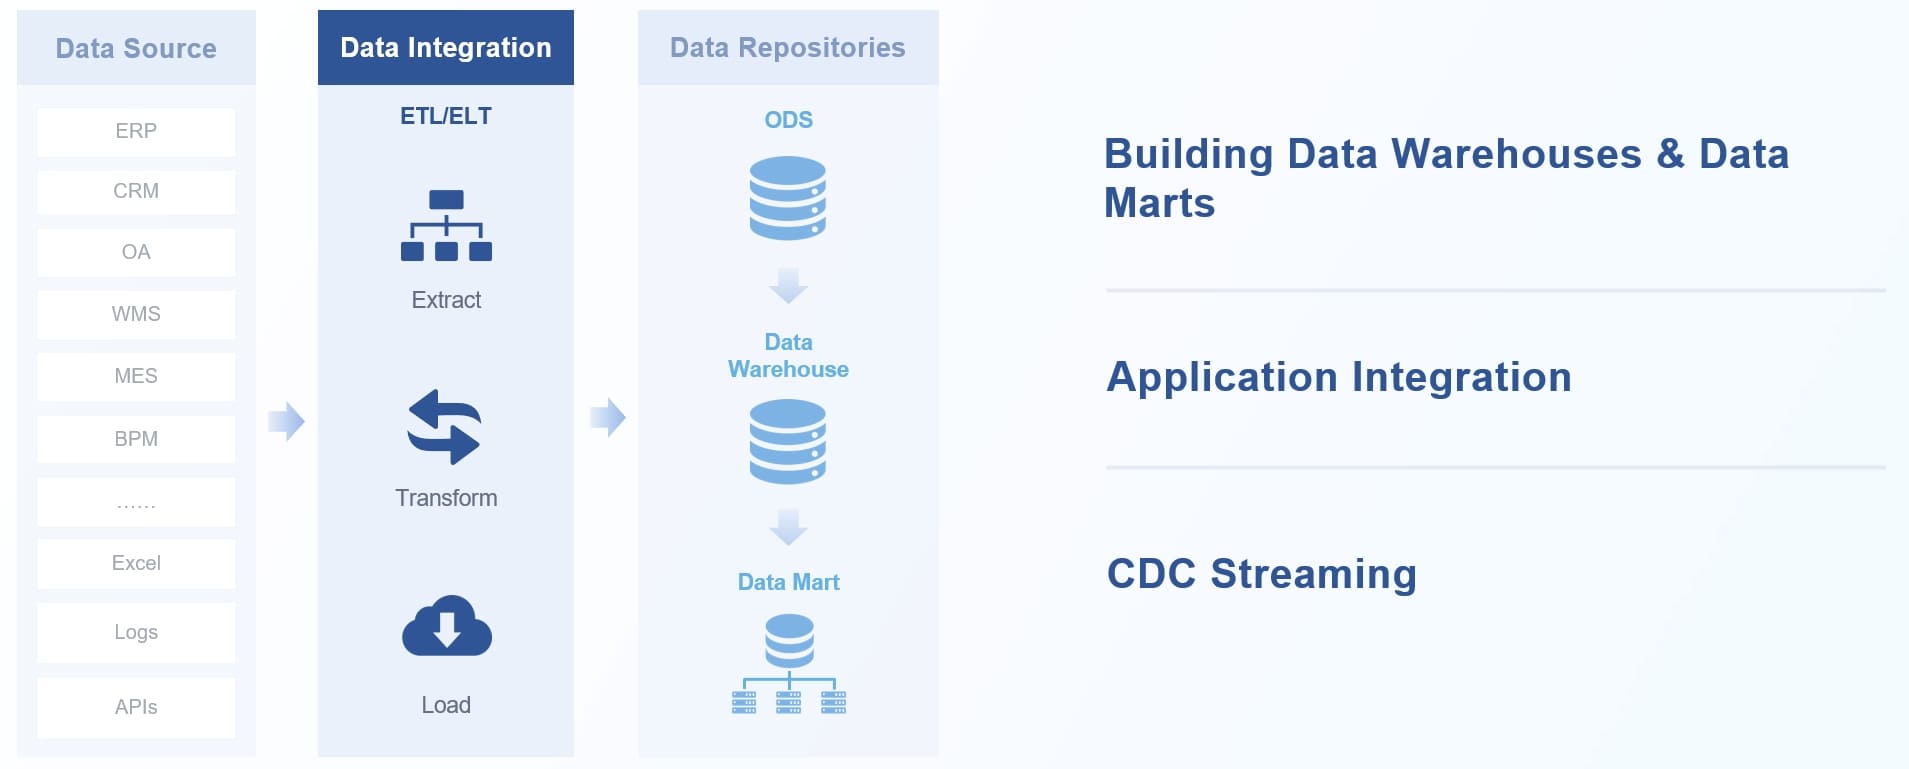
As a business intelligence analyst, you play a vital role in gathering and integrating data from multiple sources. This responsibility has become more dynamic due to the increasing complexity of data systems. Tools like FineDataLink simplify this process by enabling real-time data synchronization and seamless integration across various platforms. With FineDataLink, you can connect over 100 data sources, ensuring that no valuable information remains siloed.
You also need to address challenges like data silos and inconsistent formats. FineDataLink’s visual interface allows you to transform and preprocess data efficiently. For example, its ETL/ELT capabilities help you build both offline and real-time data warehouses, ensuring high-quality data for analysis. This streamlined approach reduces manual effort and enhances productivity.
Effective Data Development
Tip: Mastering tools like FineDataLink not only improves your efficiency but also positions you as a key player in your organization’s data strategy.
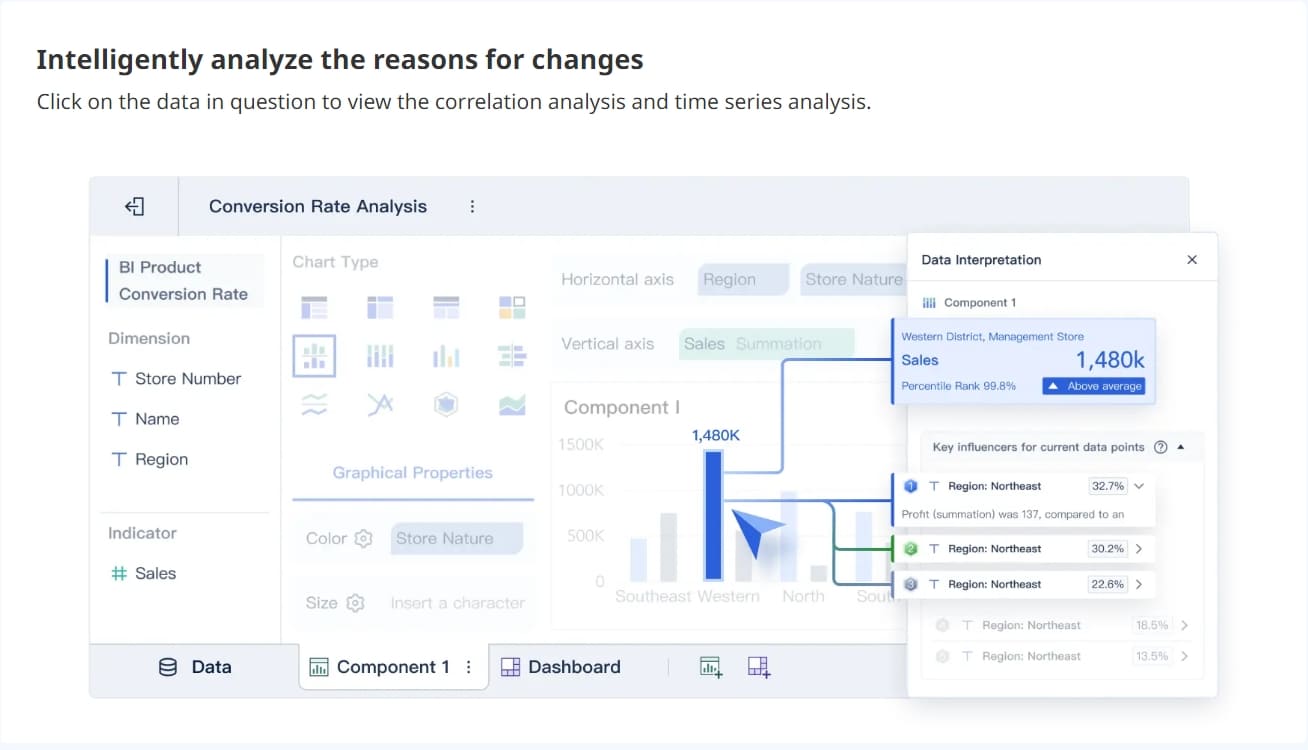
Analyzing Trends and Patterns for Strategic Insights
Analyzing trends and patterns is at the heart of your role. By identifying these patterns, you help organizations make informed decisions and stay ahead of competitors. For instance, predictive analytics enables you to forecast customer behavior, optimize inventory, and improve operational efficiency.
The effectiveness of this responsibility is evident in various industries. In education, data-driven methodologies have improved student performance by up to 30%. Predictive analytics has also identified 80% of students at risk of dropping out, allowing timely interventions. These examples highlight how analyzing trends can lead to significant improvements.
Evidence Description
Numerical Evidence
Growth of the global education analytics market
From $8.4 billion in 2020 to $17.7 billion by 2026 (CAGR of 16.3%)
Improvement in student achievement through data-driven instruction
93% of teachers reported improvements
Predictive analytics effectiveness
Identified up to 80% of students likely to drop out
Your ability to interpret data trends not only drives strategic decisions but also ensures that organizations remain agile in a rapidly changing environment.
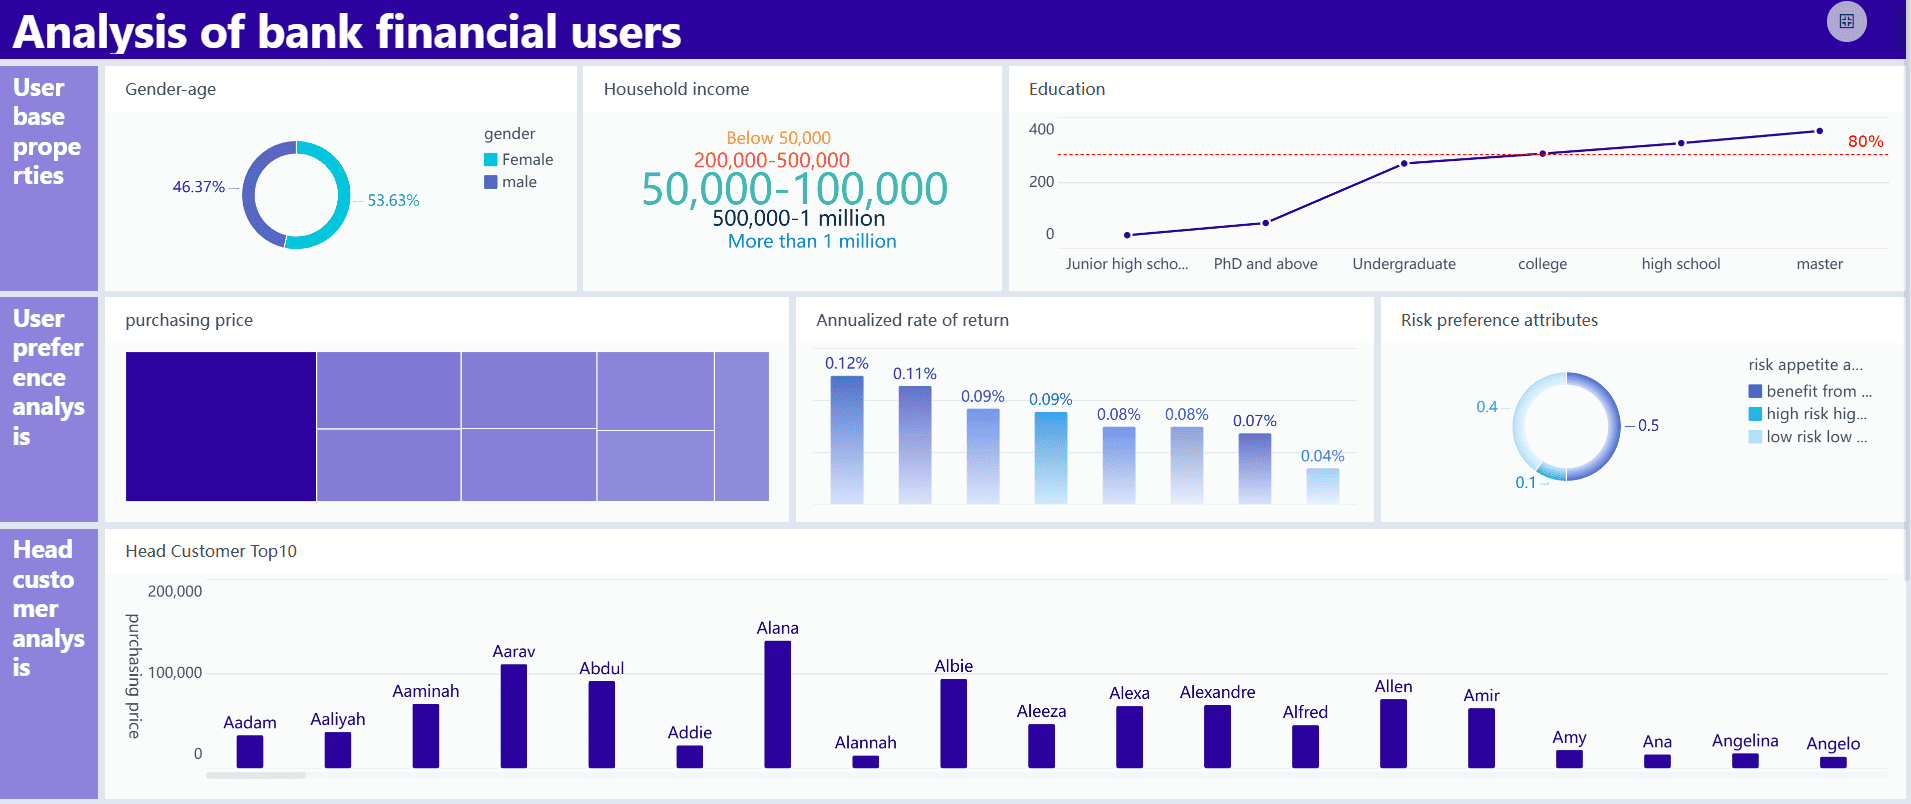
Designing Dashboards and Reports with FineBI
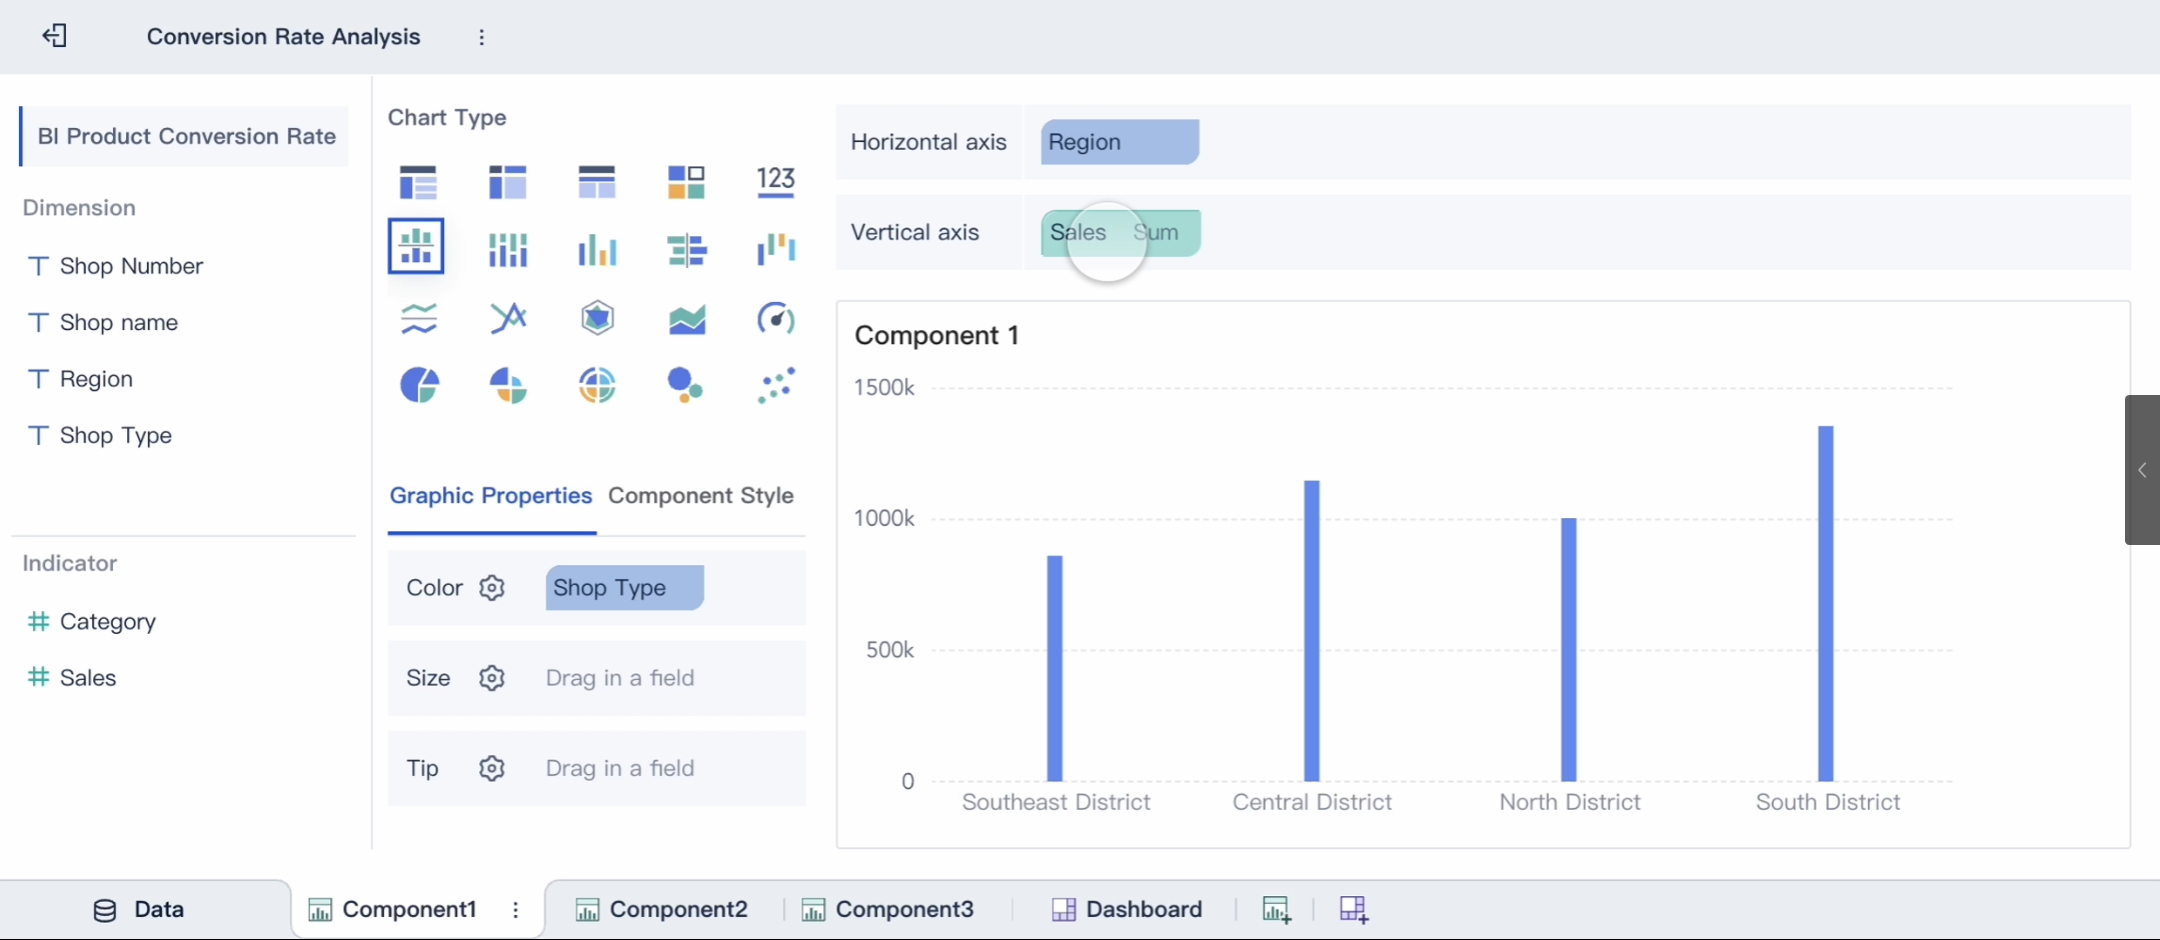
Creating dashboards and reports is another critical responsibility. FineBI, a self-service business intelligence tool, empowers you to design intuitive dashboards that make data accessible to everyone in your organization. Its drag-and-drop functionality and over 60 chart types allow you to present complex data in a visually appealing way.
FineBI also supports real-time analysis, enabling you to provide up-to-date insights. For example, its OLAP analysis capabilities let you drill down into data, apply filters, and conduct cross-theme analysis. This flexibility ensures that your dashboards meet the unique needs of different teams.
OLAP Analysis
Collaboration is another key feature of FineBI. Teams can share dashboards and datasets, fostering a culture of data-driven decision-making. By using FineBI, you not only enhance your organization’s analytical capabilities but also contribute to a more collaborative work environment.
Note: Strong communication skills are essential when designing dashboards. Clear and concise visualizations help stakeholders understand the insights and take action quickly.
Collaborating Across Teams to Drive Data-Driven Decisions
Collaboration across teams is essential for driving data-driven decisions. As a business intelligence analyst, you act as a bridge between departments, ensuring that data insights are shared effectively. Tools like FineBI and FineDataLink simplify this process by creating centralized platforms where teams can access and analyze data together.
When teams collaborate, they bring diverse perspectives to the table. This diversity leads to innovative solutions and cohesive strategies. For example, in manufacturing, shared dashboards provide a unified view of data. Teams use these dashboards to align their objectives and improve communication. This collaborative atmosphere fosters cross-functional problem-solving and enhances overall business success.
Business intelligence tools also streamline the sharing of insights. FineBI allows teams to work on the same dashboard, enabling real-time collaboration. You can share datasets, modify reports, and track key performance indicators together. This approach ensures that decisions are informed by a comprehensive understanding of the data.
Centralized platforms improve decision-making by breaking down silos. When teams access the same data, they can identify trends and patterns more effectively. This unified approach ensures that decisions are based on accurate and consistent information. In manufacturing, this has led to better operational efficiency and innovation.
Tip: Encourage team members to use shared dashboards and collaborate on data analysis. This practice not only improves decision-making but also strengthens teamwork.
By facilitating collaboration, you help organizations harness the full potential of their data. Your role ensures that teams work together to achieve common goals, making data-driven decision-making a cornerstone of success.
Essential Skills for Business Intelligence Analyst
Proficiency in Data Visualization and Tools
Data visualization is a cornerstone of your role as a business intelligence analyst. It transforms raw data into meaningful insights that drive decisions. Tools like FineBI simplify this process by offering drag-and-drop functionality and over 60 chart types. These features allow you to create dashboards that are both visually appealing and easy to understand.
FineBI also supports real-time analysis, enabling you to provide up-to-date insights. For example, its OLAP capabilities let you drill down into data and uncover trends. This skill ensures that your visualizations not only inform but also inspire action.
Tip: Focus on clarity and simplicity when designing visualizations. Clear charts and graphs help stakeholders grasp insights quickly.
Analytical Thinking and Problem-Solving
Analytical thinking and problem-solving are essential for breaking down complex issues and finding effective solutions. These skills enable you to evaluate data, identify patterns, and make informed decisions. For instance, you might use predictive analytics to forecast customer behavior or optimize supply chains.
Benefit
Description
Improved problem-solving
Breaking down complex issues into manageable parts to identify effective solutions.
Better decision-making
Evaluating data and assessing risks to make informed choices, leading to strategic decisions.
Enhanced critical thinking
Assessing situations logically to identify patterns and draw conclusions for effective solutions.
Strengthened communication
Articulating insights clearly to collaborate with teams and present findings effectively.
Increased efficiency
Identifying inefficiencies and optimizing processes to boost productivity and streamline workflows.
Curiosity and attention to detail further enhance your problem-solving abilities. These traits help you uncover hidden insights and ensure accuracy in your work.
Expertise in Programming and Query Languages
Programming and query languages are vital for managing and analyzing data. SQL remains a fundamental skill, allowing you to retrieve and manipulate data efficiently. Tools like Python and R add versatility, enabling advanced analytics and machine learning applications.
Historical Context
Tools and Skills Required
Current Relevance
Business analytics were historically conducted with specific skill sets
Statistical analysis in MiniTab or Excel, report writing via SQL
These tools and skills are still required today, with new tools making data understanding easier
Mastering these languages empowers you to handle large datasets and automate repetitive tasks. This expertise not only boosts your productivity but also enhances your value as a business intelligence analyst.
Communication and Storytelling with Data
Your ability to communicate and tell stories with data is a game-changer in 2026. As a business intelligence analyst, you transform raw numbers into compelling narratives that inspire action. Data storytelling bridges the gap between complex analytics and decision-makers, ensuring insights lead to meaningful outcomes.
Visualizations play a crucial role in this process. Charts, graphs, and dashboards simplify data, making it easier for stakeholders to grasp key points. Tools like FineBI enhance this by offering over 60 chart types and real-time analysis capabilities. These features allow you to create visuals that not only inform but also engage your audience.
Stories evoke emotions and make data memorable. For example, presenting a trend in customer behavior as a story helps stakeholders connect with the data on a deeper level. This emotional connection ensures your insights resonate and drive impactful decisions.
Simplicity is key when crafting your narrative. Avoid overwhelming your audience with too much information. Instead, focus on the most relevant insights that align with your organization’s goals. Clear and concise storytelling ensures your message is both digestible and actionable.
The table below highlights the importance of communication and storytelling with data:
Converts complex data into understandable narratives for decision-makers.
Role of Visualizations
Enhances comprehension by transforming data into engaging visuals.
Emotional Connection
Stories evoke empathy, making data more memorable and impactful.
Simplicity in Storytelling
Ensures clarity and digestibility of the message, aligning with goals.
Alignment with Strategic Objectives
Connects insights with broader company goals for effective decision-making.
By mastering communication and storytelling, you ensure your insights drive action. This skill not only enhances your value but also strengthens your organization’s data-driven culture.
Essential Tools and Technologies for Business Intelligence Analyst
Self-Service BI Platforms like FineBI
Self-service BI platforms have revolutionized how you analyze and visualize data. FineBI, a leading tool in this space, empowers you to independently explore data without relying on IT teams. Its user-friendly interface simplifies complex analytics, making it accessible even if you lack advanced technical skills. With FineBI, you can create dashboards, analyze trends, and share insights seamlessly.
FineBI’s features enhance your efficiency. For example, its OLAP analysis capabilities allow you to drill down into data, uncover patterns, and conduct cross-theme analysis. The platform also integrates with big data systems and multi-dimensional databases, enabling you to process billions of records effortlessly. This scalability ensures that FineBI meets the demands of modern enterprises.
Feature
Description
User Empowerment
FineBI empowers business users to conduct their own analyses without needing extensive coding.
Rapid Analysis
The platform allows for quick analysis and visualization of business data.
It can efficiently process vast amounts of data, supporting analysis of billions of records.
Dashboard Functionality
Provides a single-page view of key indicators and metrics for business leaders.
FineBI also fosters collaboration. Teams can work together on shared dashboards, ensuring that everyone stays aligned. This collaborative approach not only improves decision-making but also strengthens your organization’s data-driven culture.
Tip: Use FineBI’s real-time analysis feature to provide up-to-date insights, helping your team make timely decisions.
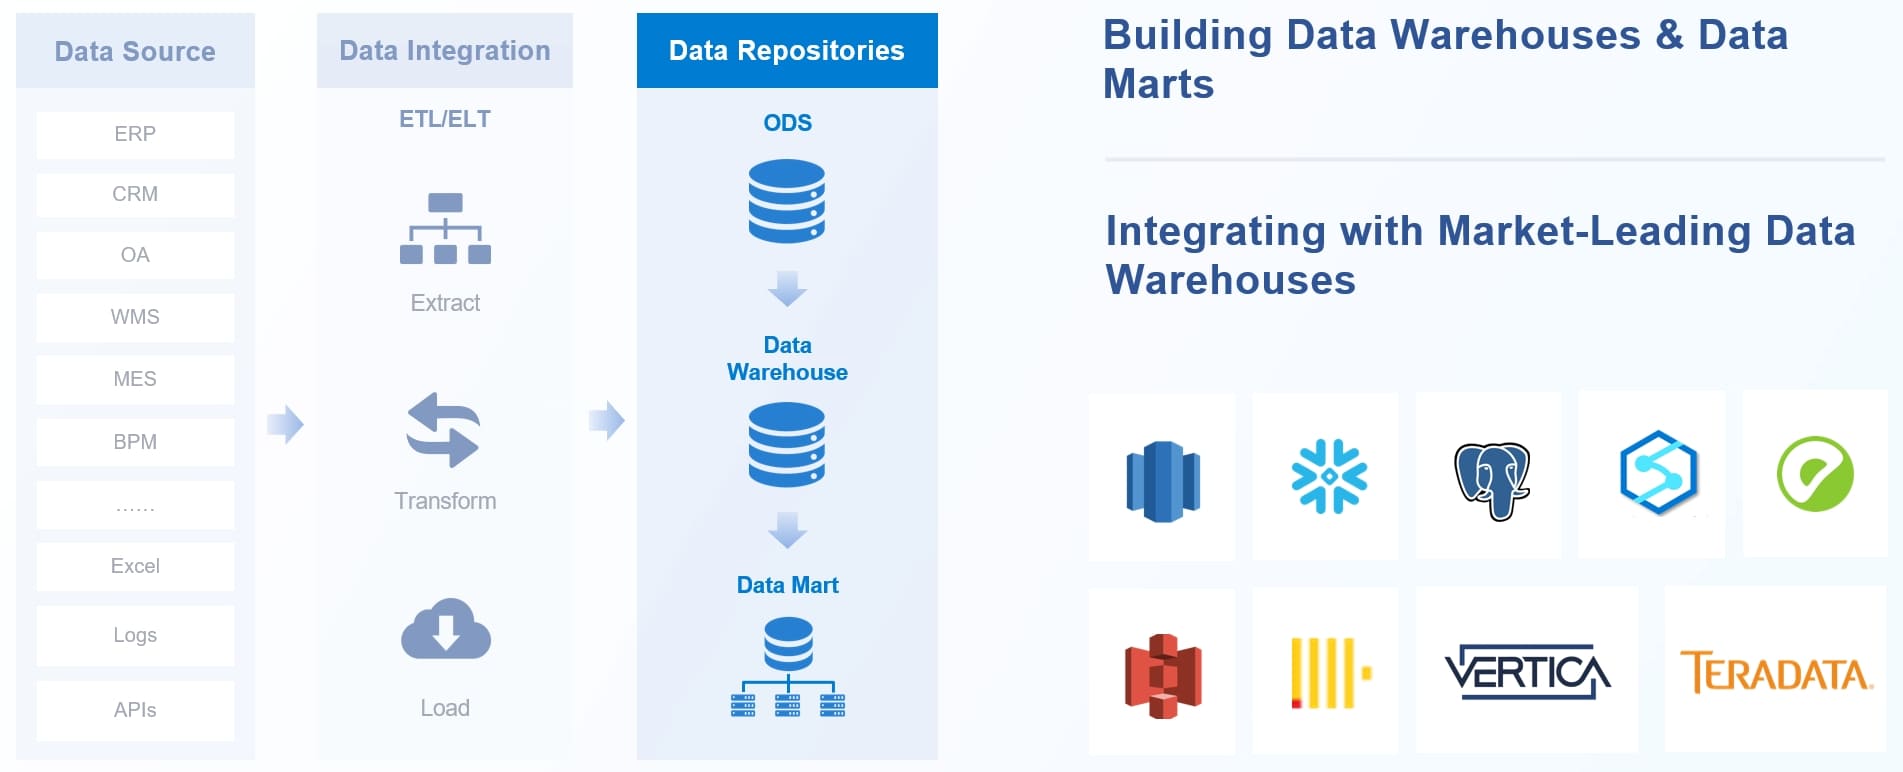
Data Integration Solutions such as FineDataLink
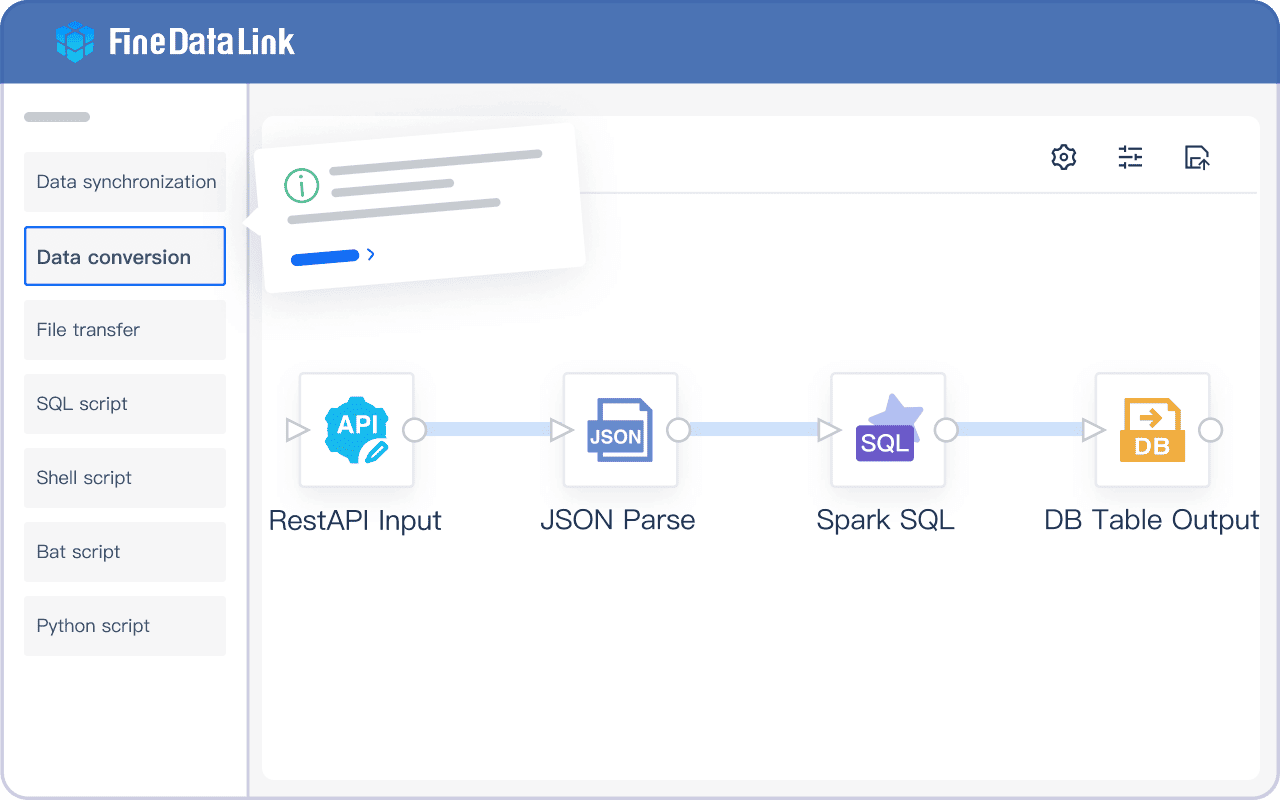
Data integration is a cornerstone of your role as a business intelligence analyst. FineDataLink simplifies this process by enabling you to connect and synchronize data from over 100 sources. Its visual interface makes it easy to transform and preprocess data, ensuring high-quality inputs for analysis.
FineDataLink’s real-time synchronization capabilities are particularly valuable. You can build real-time data warehouses with minimal latency, allowing your organization to respond quickly to changing conditions. For example, its ETL/ELT functions streamline data preprocessing, reducing manual effort and enhancing productivity.
Key Benefits of Data Integration Tools:
Break down data silos, enabling a unified view of information.
Automate reporting and predictive analysis, reducing reliance on manual processes.
Identify trends and competitive factors, supporting strategic decision-making.
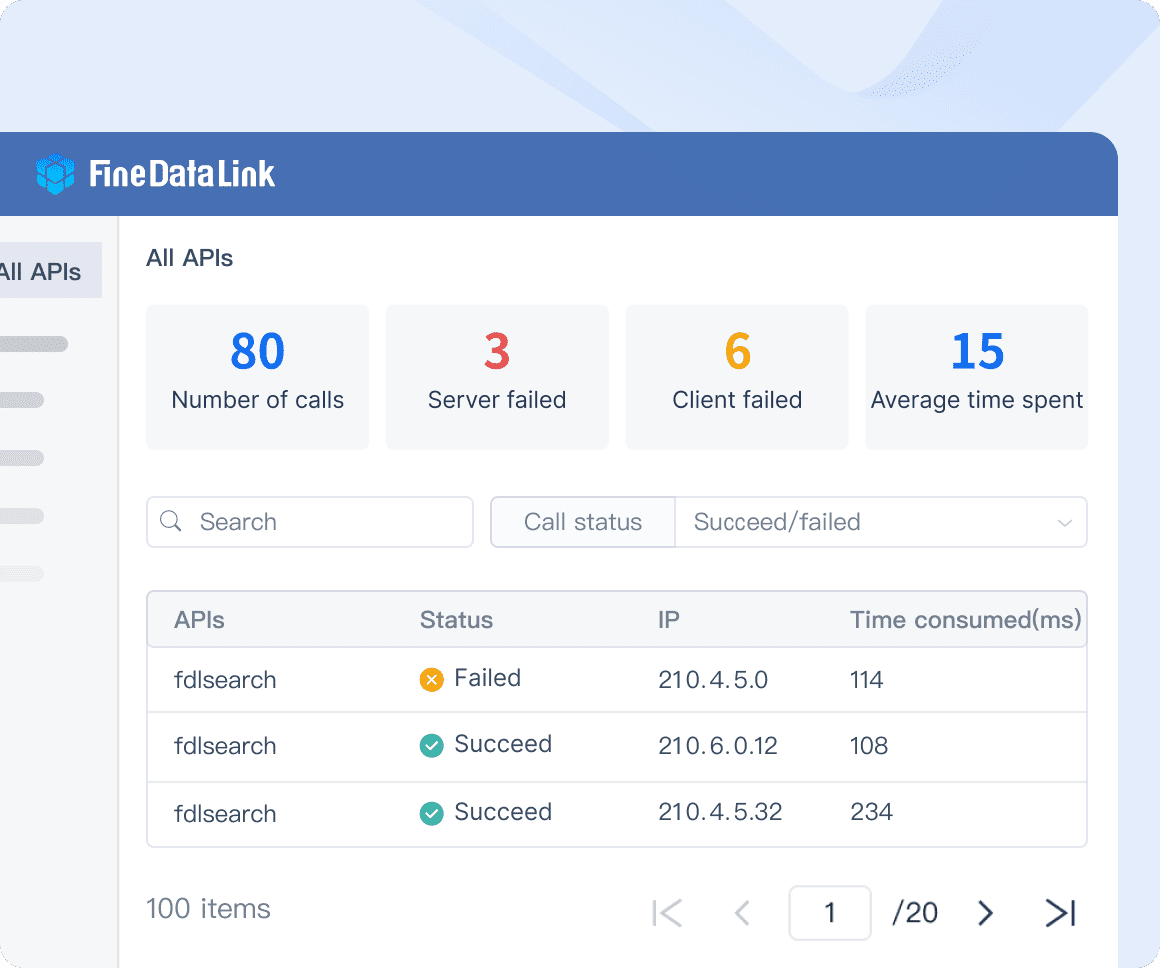
FineDataLinkalso supports API development, enabling seamless data sharing between systems. This feature is especially useful for organizations using multiple SaaS applications. By integrating data effectively, you ensure that your organization can harness its full potential.
Note: Mastering tools like FineDataLink positions you as a critical asset in your organization’s data strategy.
Machine Learning and AI for Predictive Analytics
Machine learning (ML) and artificial intelligence (AI) have transformed predictive analytics, enabling you to forecast trends and make proactive decisions. These technologies analyze historical data to identify patterns, helping you predict future outcomes with remarkable accuracy.
In healthcare, predictive models identify high-risk patients, allowing early interventions. Retailers use ML to forecast demand, optimize inventory, and personalize marketing campaigns. The table below highlights how ML and AI enhance predictive analytics across industries:
Industry
Application
Example
Healthcare
Patient Readmission Prevention
Predictive models identify high-risk patients for early intervention.
Chronic Disease Management
Tools forecast disease progression for tailored treatment plans.
Operational Efficiency
Streamlining staffing and resource management in hospitals.
Insurance
Fraud Detection
Analyzing claims data to detect patterns of fraud.
Risk Assessment
Evaluating policyholders’ risk profiles using behavioral data.
Claims Management
Predicting high-cost claims to manage resources effectively.
Retail
Demand Forecasting
Predictive modeling for future product demand to optimize inventory.
Personalized Marketing
Crafting marketing campaigns based on customer purchase history.
Pricing Optimization
Setting optimal prices based on competitor pricing and demand trends.
Real Estate
Property Valuation
Estimating property values using historical sales data and market trends.
Market Trend Prediction
Forecasting market trends to identify investment opportunities.
Rental Yield Forecasting
Using historical rental data to forecast rental yields.
These applications demonstrate the versatility of ML and AI in business intelligence. By leveraging these technologies, you can provide actionable insights that drive innovation and growth.
Tip: Stay updated on the latest advancements in ML and AI to enhance your predictive analytics capabilities.
Cloud-Based Data Warehousing and Real-Time Analytics
Cloud-based data warehousing has revolutionized how you store, manage, and analyze data. Unlike traditional on-premises systems, cloud-based solutions offer scalability, flexibility, and cost-efficiency. These platforms allow you to handle vast amounts of data without worrying about infrastructure limitations. Real-time analytics complements this by enabling you to process and analyze data as it is generated, ensuring that insights are always up-to-date.
Why Cloud-Based Data Warehousing Matters
Cloud-based data warehousing eliminates the need for expensive hardware and maintenance. You can scale storage and computing power based on your organization’s needs. This flexibility ensures that your data infrastructure grows with your business. Additionally, cloud platforms provide robust security measures, ensuring that your data remains safe and compliant with regulations.
Real-world performance metrics highlight the advantages of adopting cloud-based solutions:
The latency between data creation and insight availability has decreased from days to seconds.
Organizations using real-time analytics report a 15-25% improvement in operational efficiency.
Faster decision-making leads to a 10-20% reduction in opportunity costs.
These benefits demonstrate how cloud-based data warehousing and real-time analytics can transform your organization’s decision-making processes.
The Role of Real-Time Analytics in Business Intelligence
Real-time analytics allows you to act on data as events unfold. This capability is crucial in today’s fast-paced business environment, where delays can result in missed opportunities. For example, financial services firms use real-time analytics to detect fraud instantly. E-commerce platforms adjust product recommendations based on current user behavior, enhancing customer satisfaction. In manufacturing, real-time data helps you modify production parameters to maintain quality standards.
Real-Time Processing: Analyze streaming data to gain instant insights.
Cost Efficiency: Pay only for the resources you use, reducing overall expenses.
These features ensure that your organization can handle complex data requirements without compromising performance.
How to Maximize the Benefits
To fully harness the power of cloud-based data warehousing and real-time analytics, you should focus on the following strategies:
Centralize Your Data: Use tools like FineDataLink to integrate data from multiple sources into a single platform. This approach eliminates silos and ensures consistency.
Automate Workflows: Automate data processing and reporting to save time and reduce errors.
Invest in Training: Equip your team with the skills needed to use advanced analytics tools effectively.
Monitor Performance: Regularly evaluate the performance of your data systems to identify areas for improvement.
By implementing these strategies, you can unlock the full potential of your data and drive better business outcomes.
Note: Cloud-based solutions and real-time analytics are not just trends. They are essential components of a modern business intelligence strategy.
Cloud-based data warehousing and real-time analytics empower you to make faster, smarter decisions. By adopting these technologies, you position your organization for success in an increasingly data-driven world.
Trends Transforming Business Intelligence Analyst
The Rise of Self-Service BI Tools like FineBI
Self-service BI tools have revolutionized how organizations approach data analysis. These platforms empower users to independently explore and analyze data without relying on IT teams. FineBI, for instance, simplifies complex analytics with its user-friendly interface and drag-and-drop functionality. This accessibility allows business users to create dashboards, uncover trends, and share insights seamlessly.
The growing demand for self-service BI tools reflects their transformative impact. Despite economic challenges during the pandemic, businesses increasingly adopted these solutions to achieve measurable goals. For example, companies in Russia experienced rapid growth in BI adoption due to digitalization projects and state initiatives. Large enterprises also recognized the value of BI tools in enhancing decision-making and productivity.
Evidence
Description
Increased Demand
Businesses turned to self-service BI tools like FineBI to navigate economic uncertainties.
Growth in BI Market
Russia's BI market expanded significantly due to digital transformation efforts.
Enhanced Productivity
Organizations set specific goals for BI implementation, boosting efficiency.
Tip: Adopting self-service BI tools like FineBI can help you stay competitive by enabling faster, data-driven decisions.
Real-Time Data Analysis for Agile Decision-Making
Real-time data analysis has become a cornerstone of agile decision-making. By processing data as it is generated, organizations can respond to changes instantly. This capability is vital in competitive markets where delays can lead to missed opportunities. For example, a major supermarket chain improved customer satisfaction by 25% after implementing real-time tracking systems.
Businesses leveraging real-time analytics report significant benefits. Operational efficiency increases by up to 30%, while decision-making speeds up by five times. Companies like Amazon reduced operational costs by 20% through advanced real-time data analysis.
Metric/Case Study
Evidence
Operational Efficiency
Real-time analytics boosts efficiency by up to 30%.
Decision-Making Speed
Businesses accelerate decision-making by five times.
Cost Reduction
Amazon cut operational costs by 20% using real-time analytics.
Note: Real-time analytics enables you to act on insights immediately, improving efficiency and reducing risks.
Emphasis on Data Governance and Ethical Practices
Data governance and ethical practices have become critical in modern business intelligence. Establishing clear guidelines ensures compliance with privacy laws and promotes responsible data use. Organizations that neglect governance risk reputational damage and financial penalties. Recent data breaches, such as SolarWinds, highlight the consequences of inadequate governance.
Key aspects of data governance include ensuring data quality, protecting sensitive information, and maintaining transparency. Blockchain technology enhances data integrity, while natural language processing makes data more accessible. These advancements support ethical practices and build trust with stakeholders.
Why Data Governance Matters:
Protects against data breaches and ensures compliance with regulations.
Enhances data quality, making insights more reliable.
Promotes ethical practices, fostering trust and accountability.
Tip: Prioritize data governance to safeguard your organization’s reputation and ensure ethical decision-making.
Integration of AI and Automation in BI Workflows
AI and automation have transformed business intelligence workflows, making them faster, smarter, and more efficient. These technologies handle repetitive tasks, analyze vast datasets, and deliver actionable insights in record time. By integrating AI into your workflows, you can focus on strategic decision-making while automation takes care of routine processes.
AI-powered tools excel in analyzing data with precision. For instance, COiN reviews 12,000 commercial credit agreements annually within seconds, achieving unmatched accuracy. Similarly, Amazon uses AI to analyze purchasing behaviors, forecasting demand and optimizing inventory levels. Siemens applies AI for predictive maintenance, reducing downtime and extending machinery lifespan. Netflix’s recommendation engine personalizes content suggestions, boosting user engagement.
Automation complements AI by streamlining processes. AI-driven chatbots in customer service provide real-time assistance, improving efficiency and reducing costs. In supply chain management, AI models forecast demand and automate inventory planning, ensuring responsiveness to market changes. Financial services use AI to detect fraud in real-time, enhancing accuracy and compliance.
Area of Application
Example Description
Benefits
AI in Customer Service
AI-powered chatbots handle customer inquiries, providing real-time assistance and integrating with CRM systems.
The impact of AI and automation extends across industries. Amazon’s forecasting tools improve customer satisfaction by optimizing inventory. Siemens reduces maintenance costs through predictive analytics. Netflix enhances user retention with personalized recommendations. These examples highlight how AI and automation elevate business intelligence workflows, enabling you to achieve better outcomes with less effort.
Tip: Embrace AI and automation to streamline your workflows. These technologies free up your time for strategic tasks, helping you stay ahead in a competitive landscape.
Career Pathways and Opportunities for Business Intelligence Analyst
Certifications like FanRuan Global Certification Program
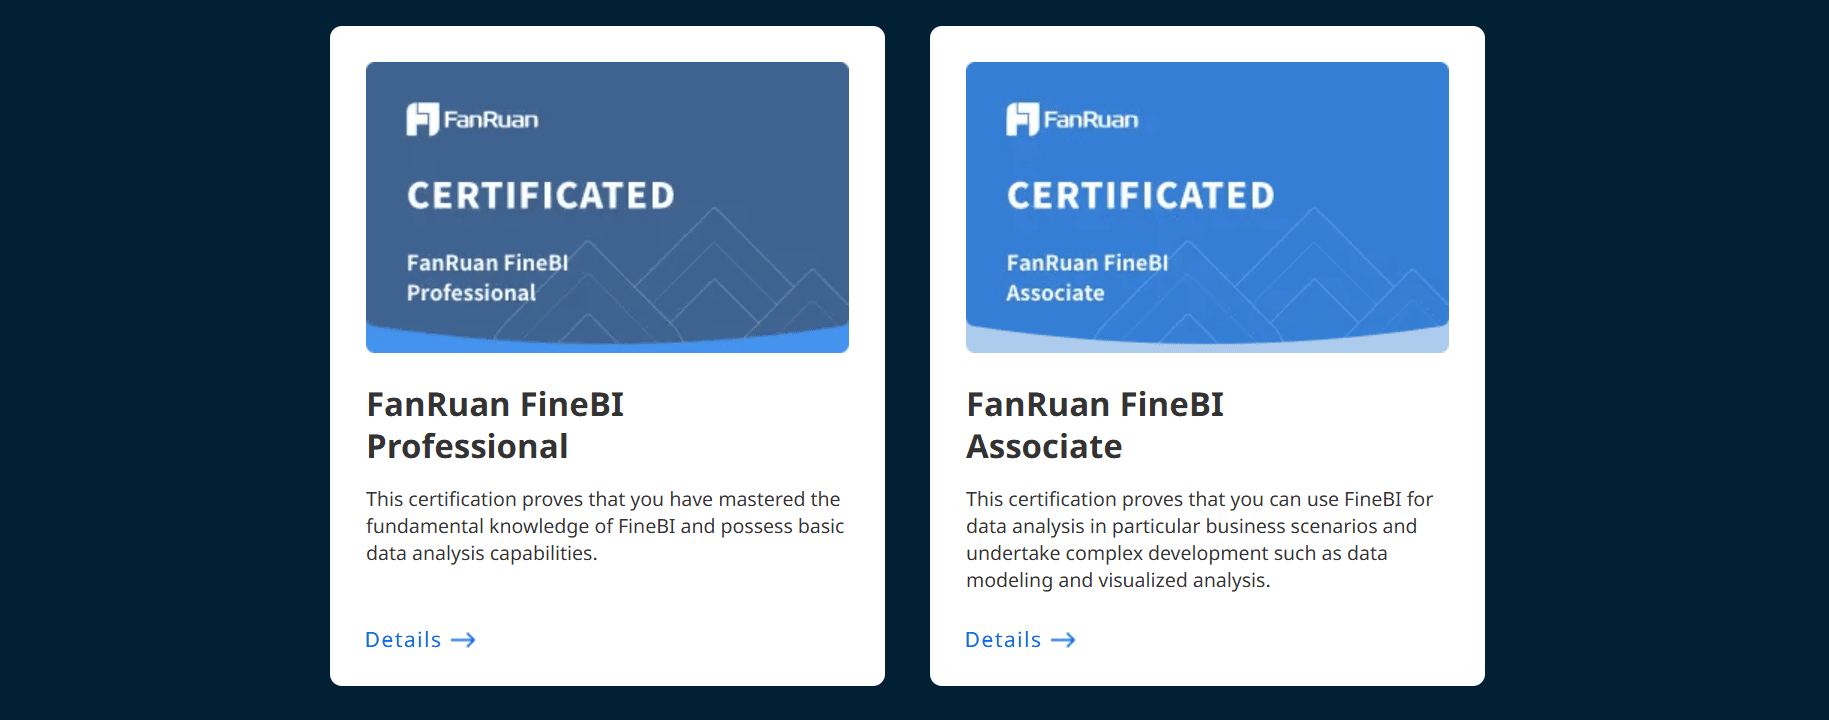
Certifications play a vital role in advancing your career as a business intelligence analyst. Programs like the FanRuan Global Certification validate your expertise in tools such as FineBI and FineReport. These credentials demonstrate your proficiency in areas like data modeling, dashboard design, and system management. They also enhance your visibility within FanRuan’s global talent network, opening doors to new opportunities.
The certification program offers two levels: Associate for beginners and Professional for advanced users. As you progress, you gain recognition for your skills and increase your chances of securing higher-level roles. Recommended learning paths, practice exams, and online resources make preparation straightforward. By earning these certifications, you position yourself as a valuable asset in the competitive BI landscape.
Tip: Pursuing certifications not only boosts your technical skills but also strengthens your resume, making you stand out to potential employers.
Entry-Level Roles and Career Progression
Starting your journey in business intelligence often begins with entry-level roles like business intelligence analyst I or Junior Business Intelligence Analyst. These positions focus on data extraction and basic analysis under supervision. As you gain experience, you can advance to roles such as Business Intelligence Analyst II or Senior Business Intelligence Analyst, where you conduct advanced analyses and data modeling with greater autonomy.
Here’s a typical progression path in the BI field:
Business Intelligence Analyst I: Entry-level role focusing on foundational tasks like data extraction and reporting.
Business Intelligence Analyst II: Mid-level role involving more complex analyses and independent decision-making.
BI Developer or BI Engineer: Technical role focused on optimizing BI tools and guiding data processes.
BI Manager or Director of BI: Leadership role managing teams and coordinating BI strategies across departments.
The data industry’s rapid growth creates numerous opportunities for career advancement. Internships and projects provide practical experience, while specialization in areas like data engineering or machine learning can propel you into senior roles. Understanding this progression helps you navigate the evolving landscape and identify the skills needed to succeed.
Note: Building a strong foundation in data concepts and tools early in your career sets the stage for long-term success.
Opportunities Across Industries
Business intelligence analyst enjoys diverse opportunities across industries. Healthcare, for instance, is expected to reach a market size of $25.86 billion by 2032, driven by the need for data-driven patient care and operational efficiency. FinTech is another booming sector, with forecasts predicting growth to $22.9 billion by 2031. Retail continues to adopt BI solutions to optimize inventory and enhance customer experiences.
The table below highlights the variety of industries leveraging BI:
Industry
Market Size/Forecast
Healthcare
Expected to hit $25.86 billion by 2032
IT and Telecommunications
Dominated revenue share in 2022
FinTech
Expected to soar to $22.9 billion by 2031
BFSI
Fastest growth predicted from 2023 to 2032
Education
High expectations for BI platforms
Retail
Increasing adoption of BI solutions
These industries demonstrate the versatility of BI skills. Whether you’re optimizing supply chains in manufacturing or enhancing digital banking in finance, your expertise in data analysis positions you as a key contributor to organizational success.
Tip: Explore industries aligned with your interests and strengths to maximize your career potential in business intelligence.
Future Prospects for Business Intelligence Analyst in a Data-Driven World
The future for business intelligence analyst looks exceptionally bright. Organizations across industries are increasingly relying on data to guide their strategies. This growing reliance creates a strong demand for professionals who can transform raw data into actionable insights. As a business intelligence analyst, you will find yourself at the center of this transformation.
The business intelligence market is projected to reach $54.27 billion by 2030, growing at a compound annual growth rate (CAGR) of 9.1%. This rapid expansion highlights the critical role of data-driven decision-making in modern businesses. Companies are investing heavily in advanced analytics tools and platforms, ensuring a steady demand for skilled analysts like you.
Emerging technologies such as artificial intelligence, machine learning, and real-time analytics will further enhance your role. These tools will allow you to predict trends, optimize operations, and deliver insights faster than ever before. For example, AI-powered analytics can help you identify patterns in customer behavior, enabling businesses to personalize their offerings and improve customer satisfaction.
Your career opportunities will also expand as industries like healthcare, finance, and retail continue to adopt business intelligence solutions. In healthcare, you might analyze patient data to improve treatment outcomes. In finance, you could forecast market trends to guide investment strategies. These diverse applications ensure that your skills remain relevant and in demand.
Tip: Stay updated on the latest tools and technologies in business intelligence. Continuous learning will keep you ahead in this rapidly evolving field.
The future promises exciting opportunities for you as a business intelligence analyst. By mastering the right skills and tools, you can play a pivotal role in shaping the data-driven world of tomorrow.
In 2026, your role as a business intelligence analyst becomes essential for organizations striving to excel in a data-driven world. Tools like FineBI and FineDataLink enable you to transform raw data into actionable insights, fostering innovation and growth. As businesses increasingly rely on data to shape their strategies, your expertise will remain in high demand. This evolving landscape offers you exciting opportunities to advance your career while making a significant impact on organizational success.
Click the banner below to try FineBI and FineDataLink for free and empower your enterprise to transform data into productivity!
Continue Reading About Business Intelligence Analyst
Track energy and carbon in real time to reduce cost, meet disclosures, and prove ESG impact.
FAQ
What is the role of a business intelligence analyst in 2026?
You analyze data to provide actionable insights that guide business decisions. Your role involves using tools like FineBI and FineDataLink to visualize trends, predict outcomes, and optimize strategies. Collaboration across teams and real-time analytics are key aspects of your responsibilities.
How does FineBI help with data visualization?
FineBI simplifies data visualization with drag-and-drop functionality and over 60 chart types. It enables you to create dashboards that are visually appealing and easy to understand. Its real-time analysis feature ensures your insights remain up-to-date, helping stakeholders make informed decisions quickly.
Why is data integration important for business intelligence?
Data integration ensures a unified view of information by breaking down silos. Tools like FineDataLink allow you to connect over 100 data sources, synchronize data in real-time, and preprocess it efficiently. This process improves data quality and supports accurate analysis for better decision-making.
What skills should you focus on as a business intelligence analyst?
You should develop skills in data visualization, programming (e.g., SQL, Python), and analytical thinking. Communication and storytelling with data are equally important. Mastering tools like FineBI and FineDataLink will enhance your ability to analyze and present data effectively.
How can certifications like the FanRuan Global Certification Program benefit you?
Certifications validate your expertise in tools like FineBI and FineReport. They enhance your resume and increase your visibility within the global talent network. With credentials at Associate and Professional levels, you gain recognition and access to better career opportunities in the BI field.